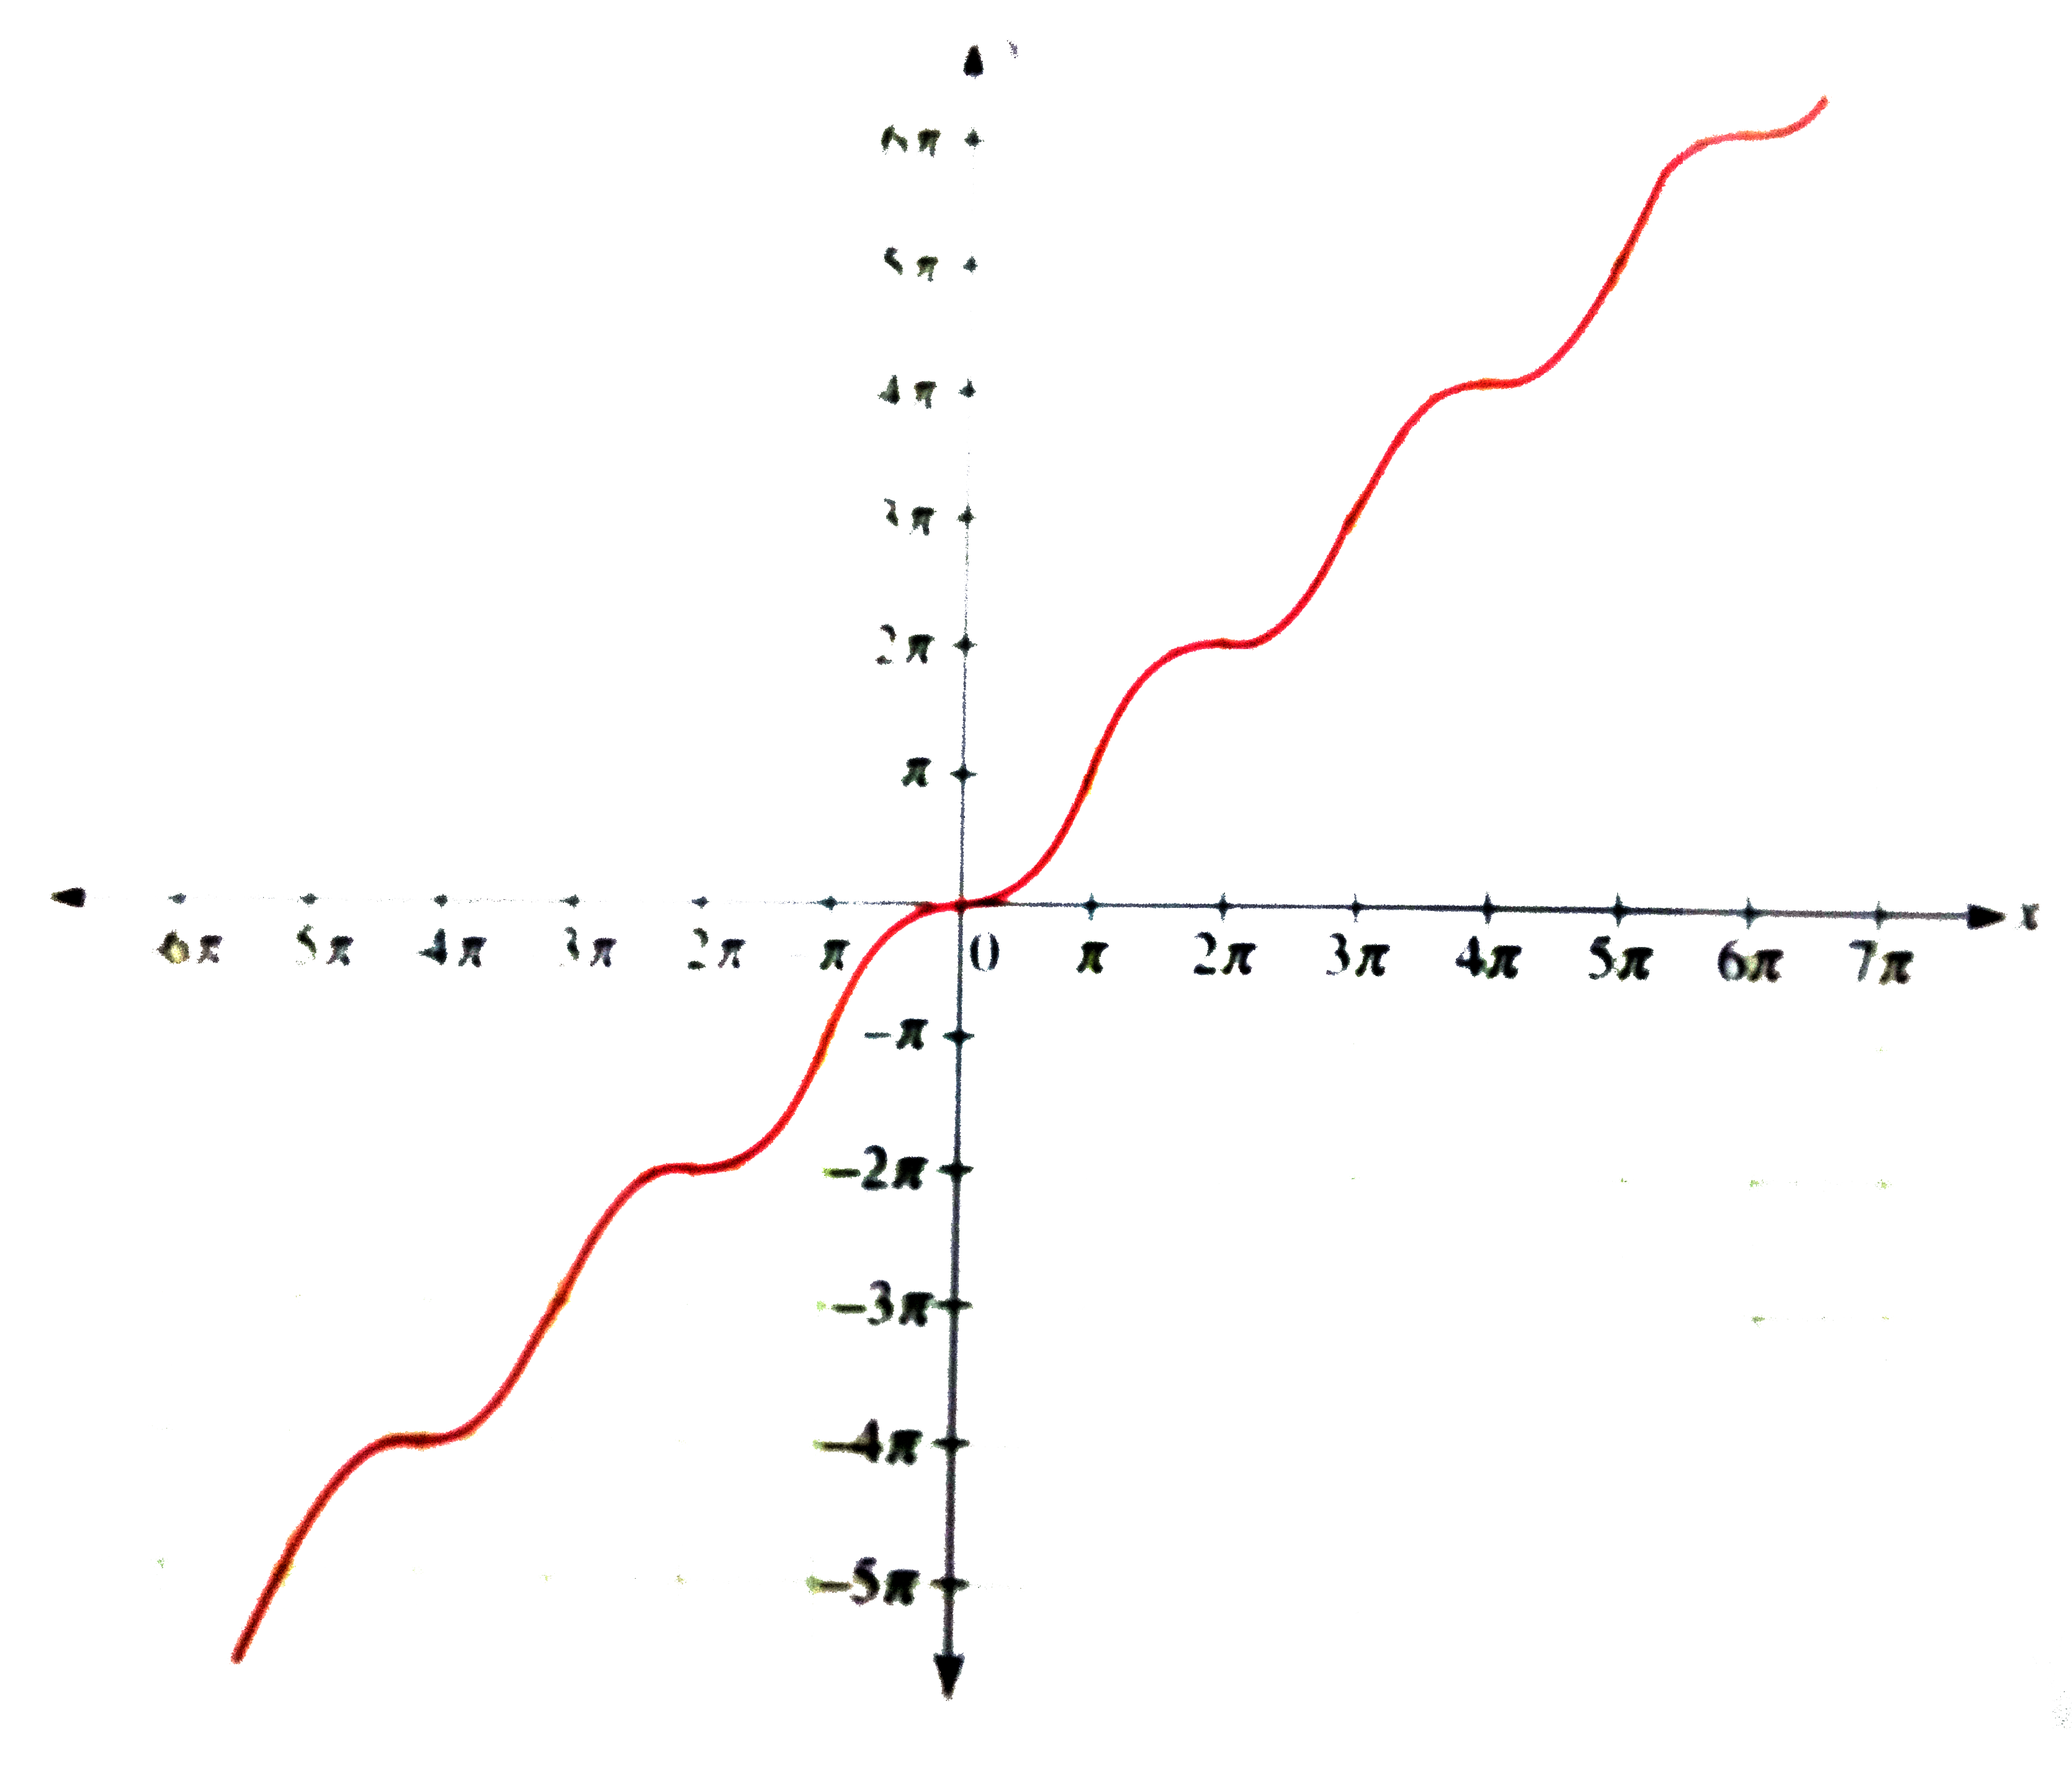
Draw the graph of y=x−sinx
Video Solution
Text Solution
We have y=f(x)=x−sinx
⇒f′(x)=1−cosx
Now, f(x)>0,∀x except at x=0,±2π,±4π etc.
f(x)=0 for x=0,±2π,±4π
Also when x→∞,f(x)→∞ and when x→∞,f(x)→−∞.
Hence, the graph of the function y=f(x) is as shown in the following figure.

|
Topper's Solved these Questions
Similar Questions
Draw the graph of y=|x|
View SolutionDraw the graph of y=2x.
View SolutionDraw the graph of y=[sinx].
View SolutionDraw the graph of y≤x+2.
View SolutionDraw the graph of y=|sinx|+sin|x|.
View SolutionDraw the graph of y=|sinx| and hence the graph of y=sin−1|sinx|.
View SolutionDraw the graph of |y|=sinx.
View SolutionDraw the graph of y=sin|x|.
View SolutionDraw the graph of y=sinxx.
View SolutionDraw the graph of y = x sin x.
View Solution
