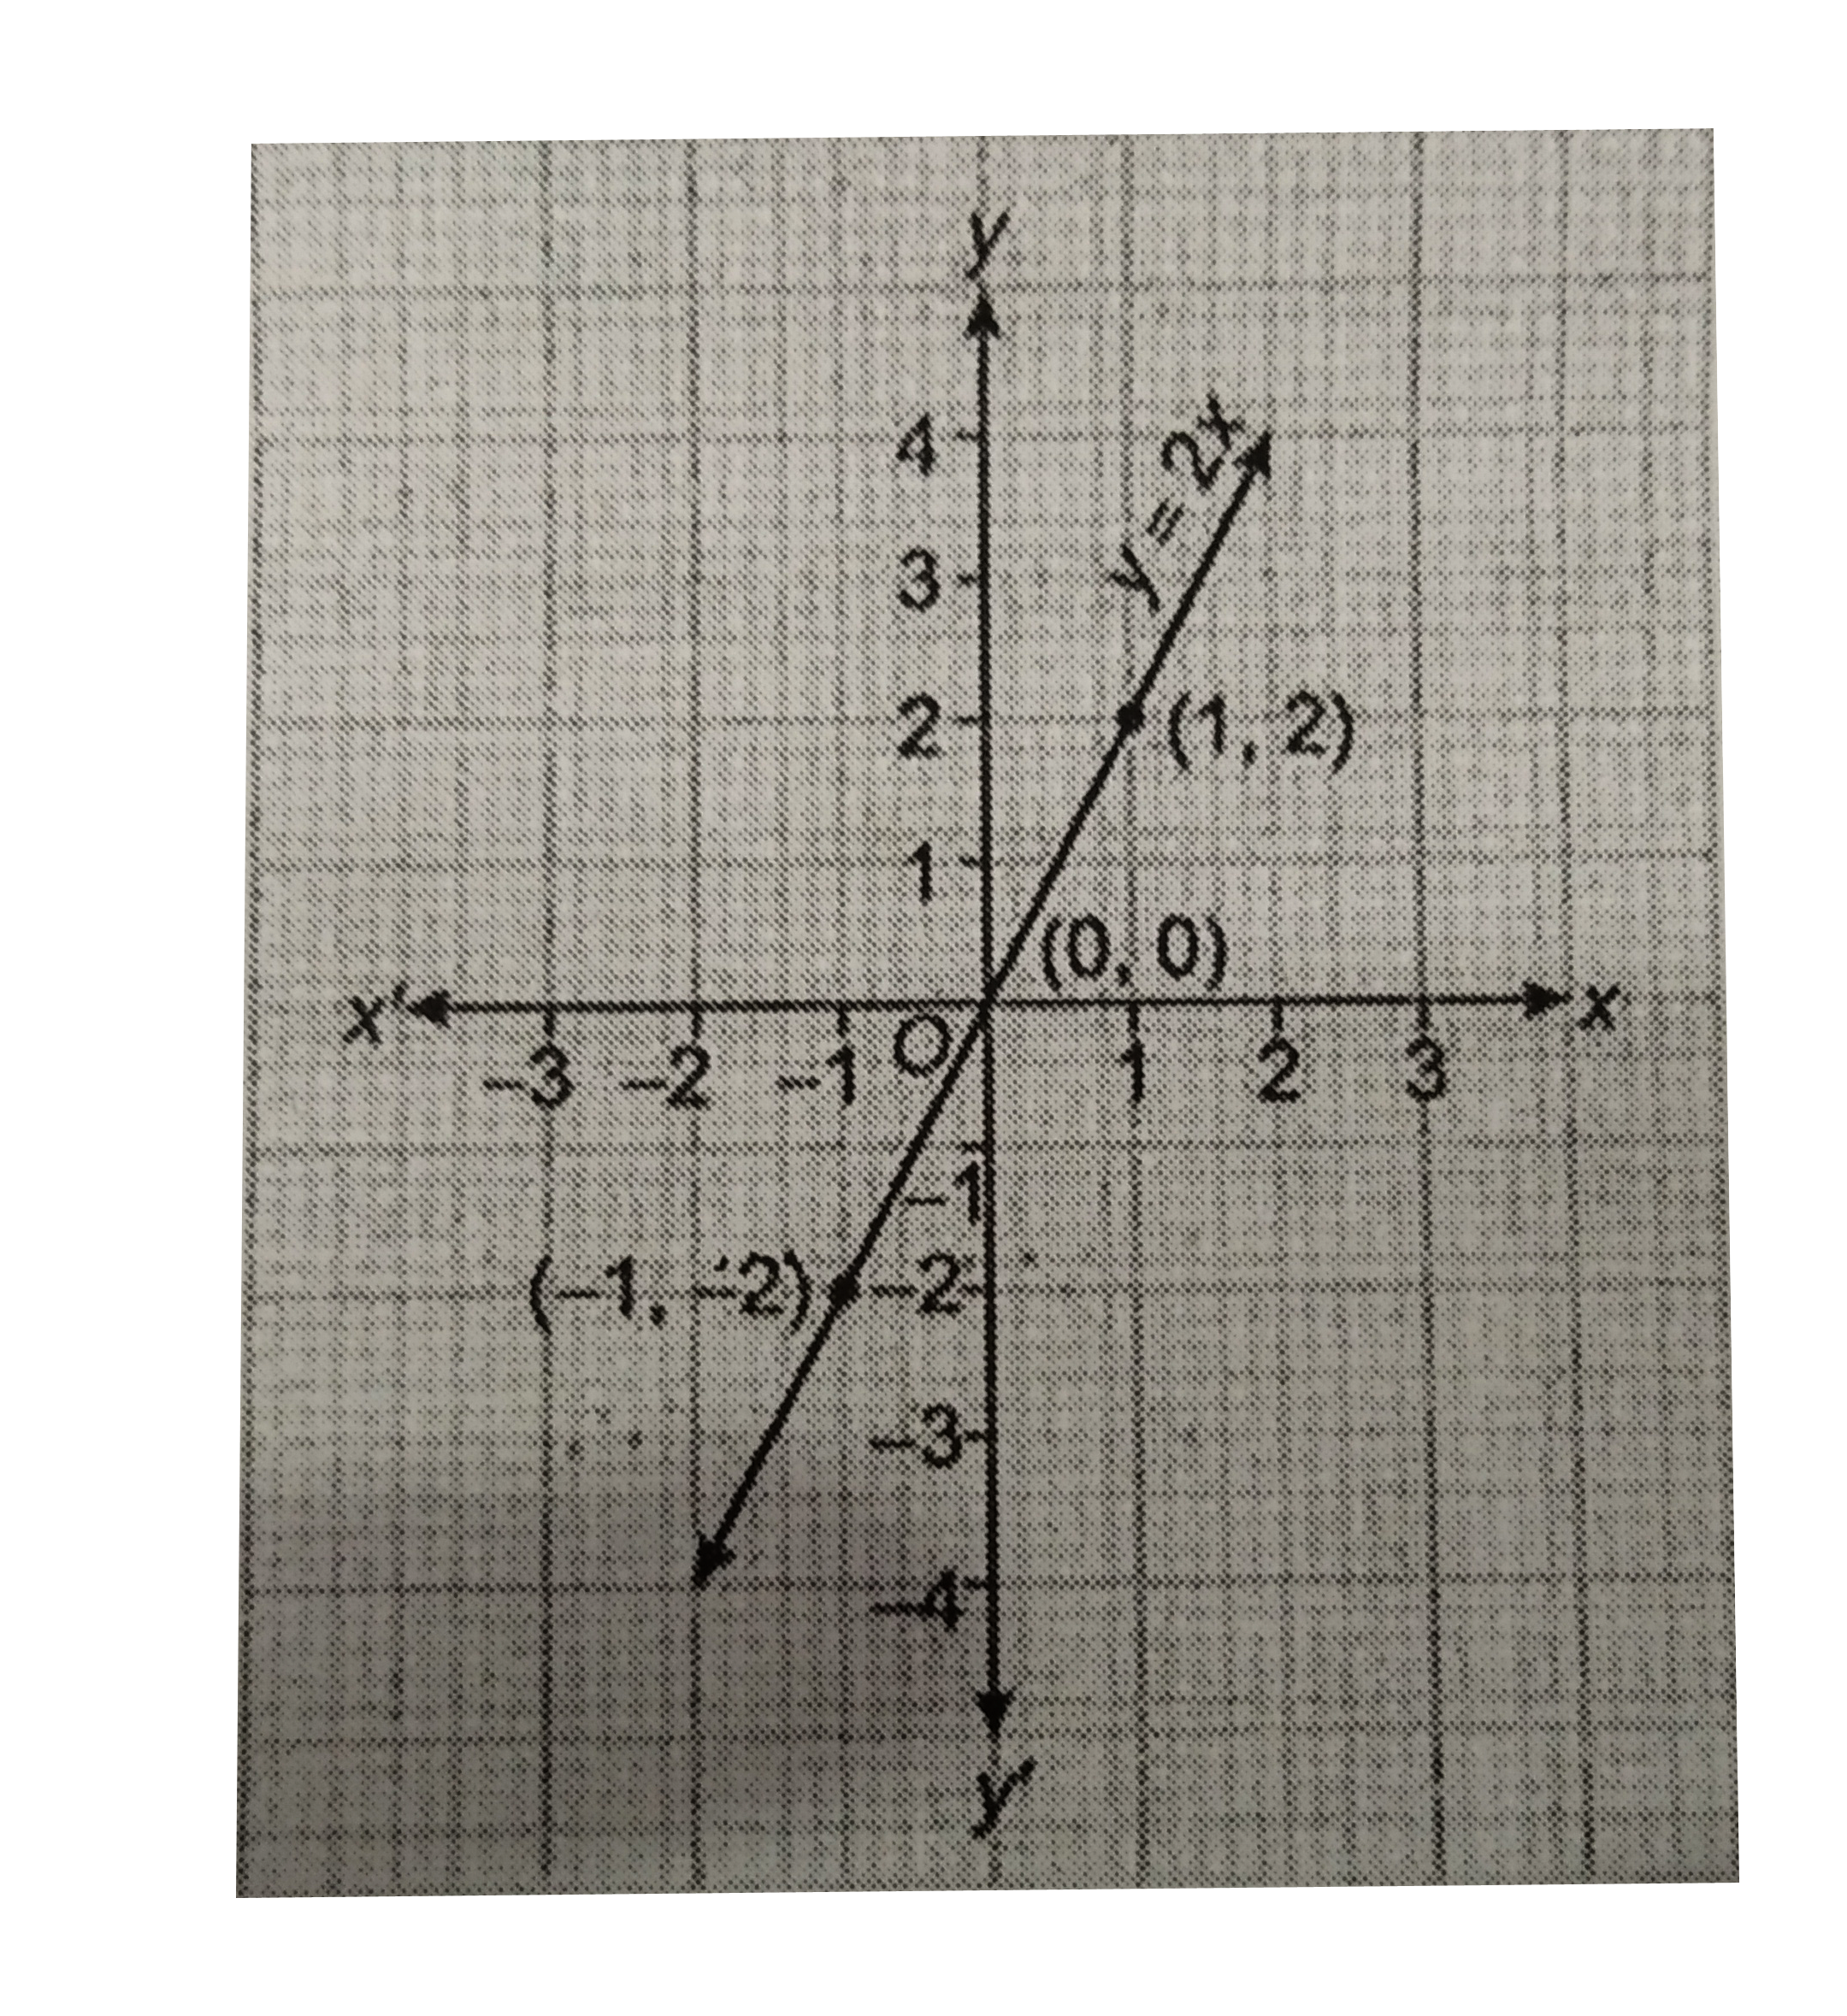
Draw the graph of y=2x.
Video Solution
Text Solution
Given equation is y= 2x
Let x =0 then y =2×0=0
Let x = 1 then y = ×1=2
Let x = -1 then y = 2×-1=-2
Tables for values:

Plot the points (0,0), (1,2) and (-1, -2) and draw a line passing through these points.

|
Topper's Solved these Questions
- LINEAR EQUATIONS IN TWO VARIABLESBOOK - NAGEEN PRAKASHANCHAPTER - LINEAR EQUATIONS IN TWO VARIABLESEXERCISE - Problems From NCERT/exemplar
7 Videos
- LINEAR EQUATIONS IN TWO VARIABLESBOOK - NAGEEN PRAKASHANCHAPTER - LINEAR EQUATIONS IN TWO VARIABLESEXERCISE - Exercise
3 Videos
- INTRODUCTION TO EUCLID'S GEOMETRYBOOK - NAGEEN PRAKASHANCHAPTER - INTRODUCTION TO EUCLID'S GEOMETRYEXERCISE - Exercise
3 Videos
- LINES AND ANGLESBOOK - NAGEEN PRAKASHANCHAPTER - LINES AND ANGLESEXERCISE - Revision Exercise (long Answer Questions )
6 Videos
Similar Questions
Draw the graph of y=2−x.
View SolutionDraw the graph of y=2(|x|+x)x.
View SolutionDraw the graph of y=2−|x−1|.
View SolutionDraw the graph of y=2{x}, where {⋅} represents the fractional part function.
View SolutionDraw the graph of y=(x2−x5)(x−2)3.
View SolutionDraw the graph of y=x2+1x2,x≠0.
View SolutionDraw the graph of y=x2√x+1
View SolutionDraw the graph of y≤x+2.
View SolutionDraw the graph of y=|x|+2
View SolutionDraw the graph of y=∣∣|x|2−2∣∣x|−3|, if the graph for y=x2−2x−3 is given.
View Solution
