Draw the graph of y=x2+1x2,x≠0.
Video Solution
Text Solution
We have f(x)=x2+1x2,x≠0.
Clearly , x=0 is the vertical asymptote.
Curve has no horizontal and oblique asymptotes.
Since the function is even, draw the graph of y=f(x) for x>0 first.
limx→0+(x2=1x2)=∞ and limx→∞(x2+1x2)=∞
f'(x)=2x−2x3,f''(x)=2+6x4
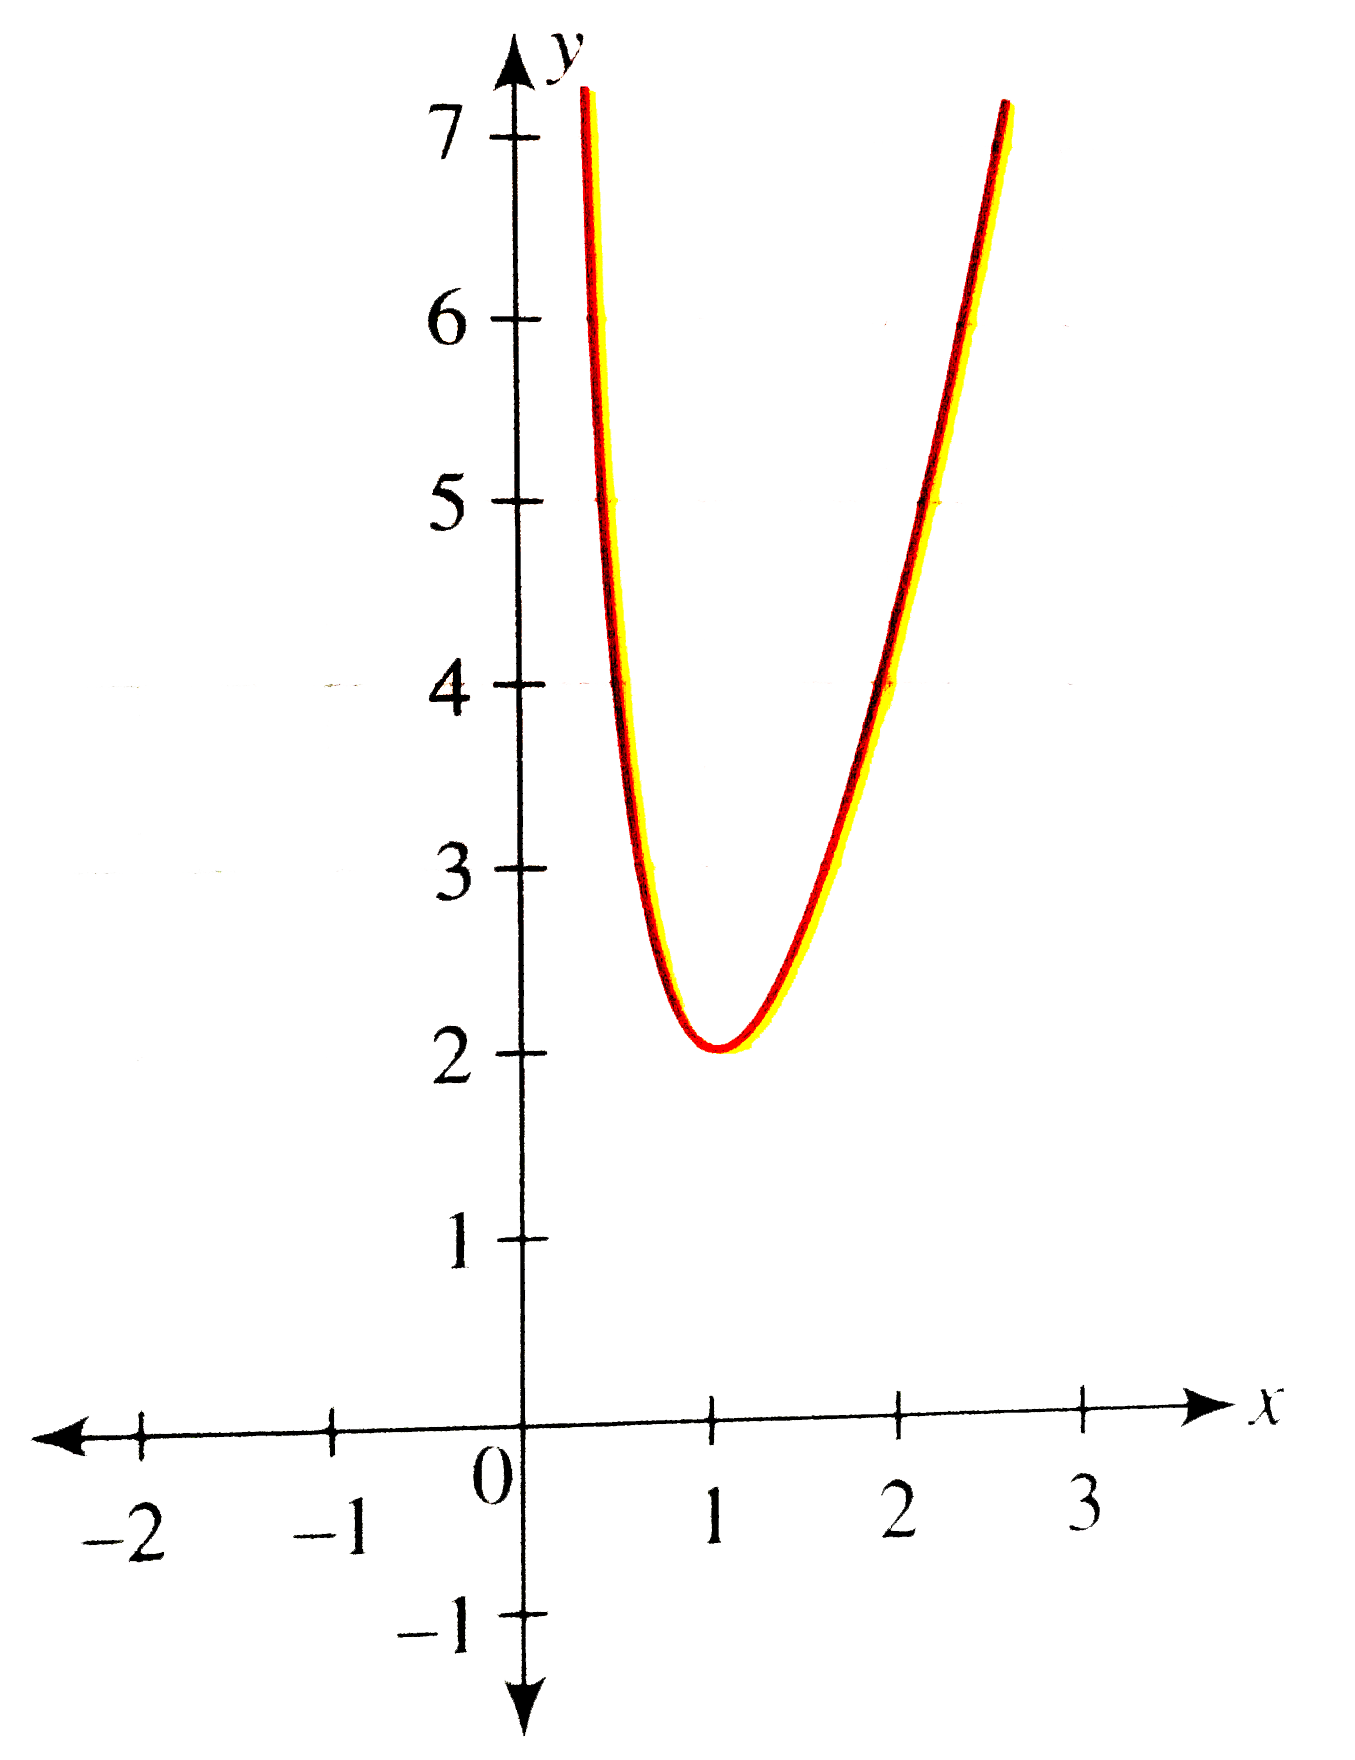
f'(x)=0⇒x4=1⇒x=1, which is point of minima as f''(1)=8>0
f(1)=2
So the graph of y=f(x) for x>0 is as shown in the following figure.

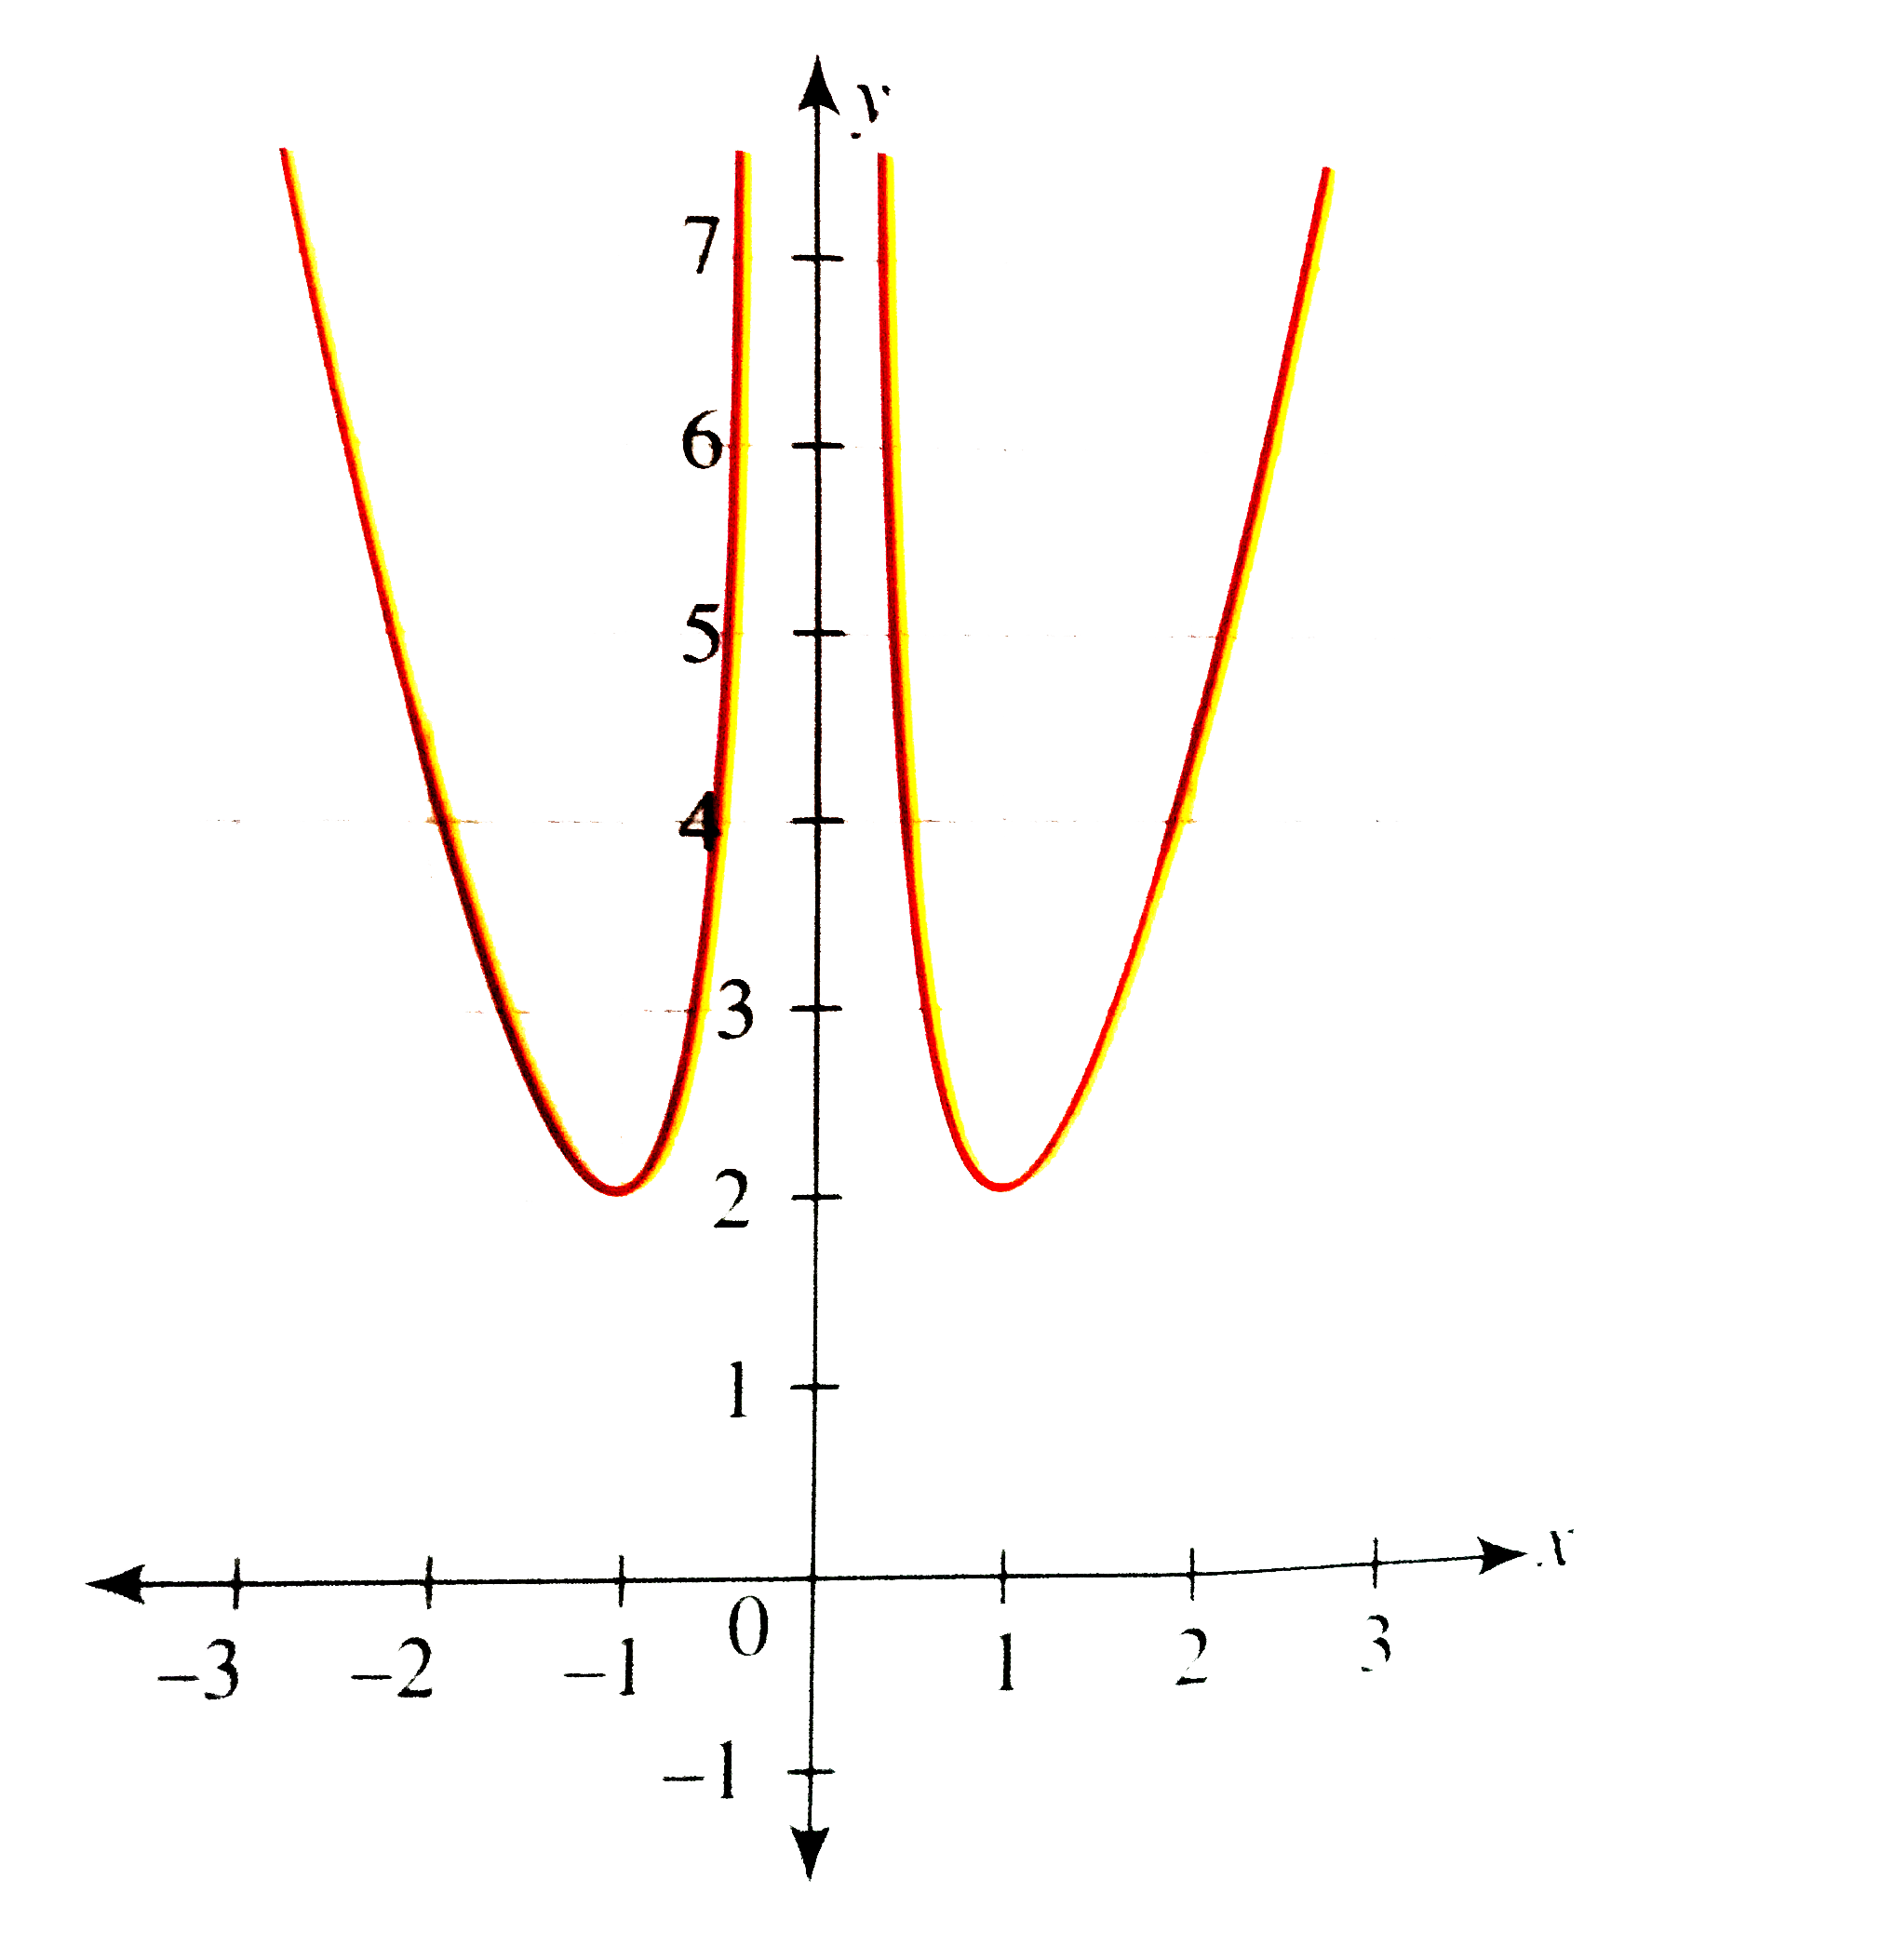
Since y=f(x) is an even function , the graph for R−{0} is as shown in the following figure .

|
Topper's Solved these Questions
- GRAPHS OF POLYNOMIAL AND RATIONAL FUNCTIONSBOOK - CENGAGECHAPTER - GRAPHS OF POLYNOMIAL AND RATIONAL FUNCTIONSEXERCISE - Exercise
13 Videos
- GRAPHICAL TRANSFORMATIONSBOOK - CENGAGECHAPTER - GRAPHICAL TRANSFORMATIONSEXERCISE - Exercise
22 Videos
- GRAPHS OF ELEMENTARY FUNCTIONS BOOK - CENGAGECHAPTER - GRAPHS OF ELEMENTARY FUNCTIONS EXERCISE - Exercise
34 Videos
Similar Questions
Draw the graph of y=2x.
View SolutionDraw the graph of y=x2/5
View SolutionDraw the graph of y=|x|+2
View SolutionDraw the graph of y=2−x.
View SolutionDraw the graph of y=x+1x
View SolutionDraw the graph of y=f(x)=x+1x2+1
View SolutionDraw the graph of y=cos−1(x2).
View SolutionDraw the graph of y=f(x)=x2x2+1.
View SolutionDraw the graph of y=sin−1(x2)
View SolutionDraw the graph of x−2y≥4
View Solution
