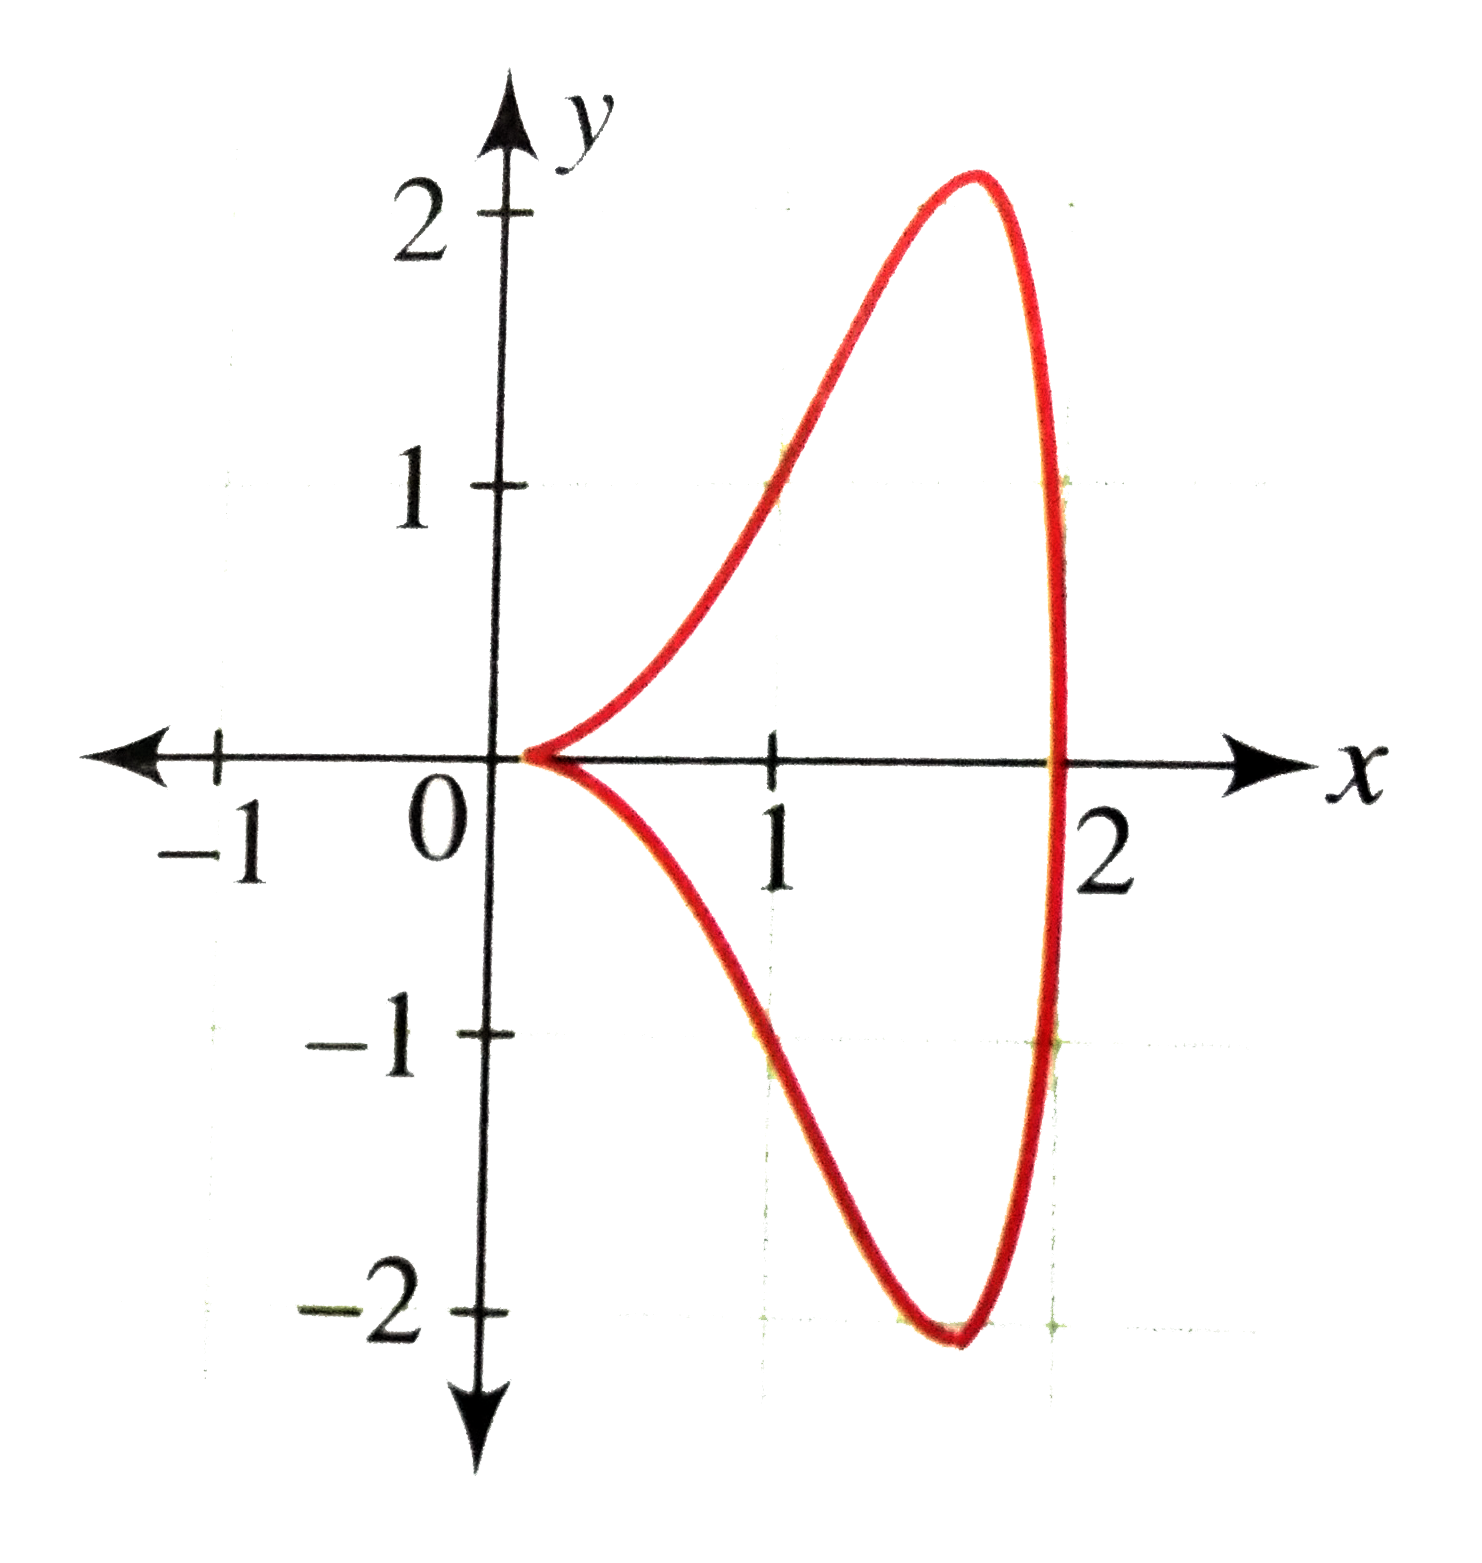
Draw the graph of the relation y2=x5(2−x)
Video Solution
Text Solution
We have y2=x5(2−x)
∴y=±√2x−x2
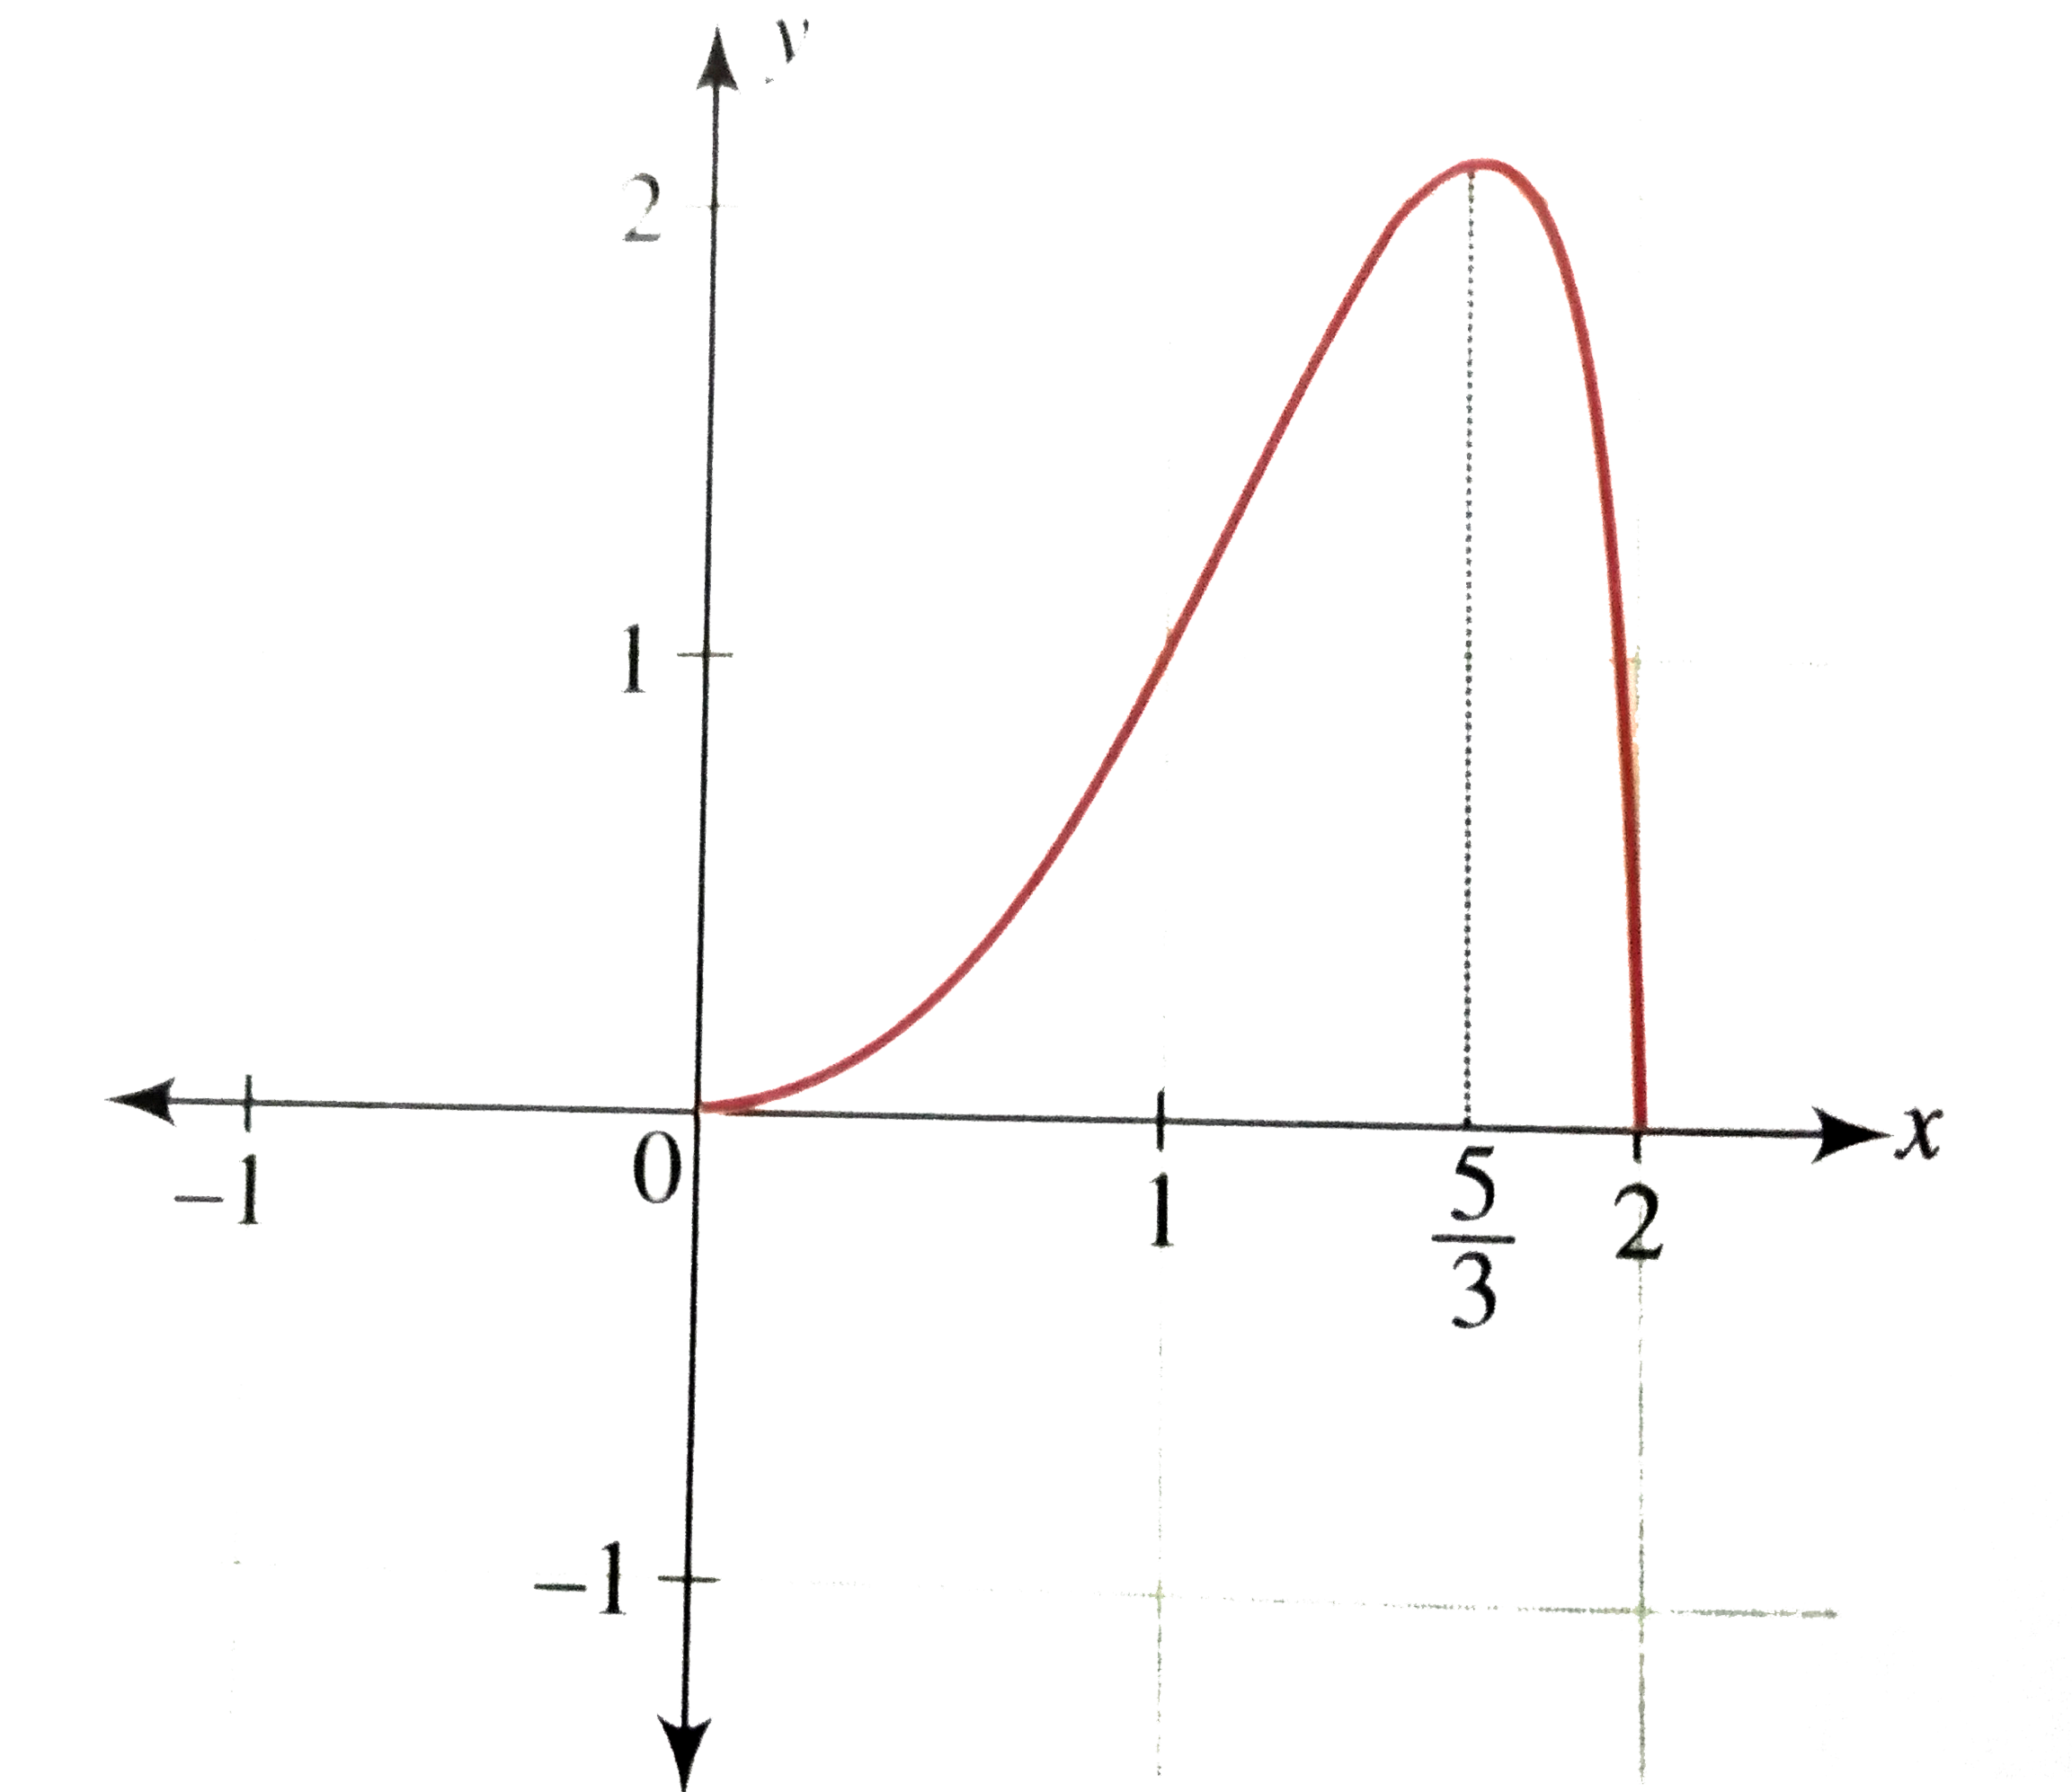
Let us first draw the graph of y=f(x)=x2√2x−x2.
Clearly, the domain of function is [0,2].
So, the graph meets the x-axis at (0,0) and (2,0).
Also f(x)≥0
f′(x)=2x√2x−x2+x21−x√2x−x2=x2(5−3x)√2x−x2
f′(x)=0 ∴x=5/3, which is the point of maxima.
f''(x)=(10x−9x2)√2x−x2−1−x√2x−x2(5x2−3x2)2x−x2
x26x2−20x+15(2x−x2√2x−x2)
f''(x)=0∴x=10−√106, which is the point of inflection.
Hence, the graph of y=f(x) is as shown in the following figure.

To draw the graph of y=−x2√2x−x2, reflect the above graph in the x-axis.
Hence, the graph of the given relation y2=x5(2−x) is as shown in the following figure.

|
Topper's Solved these Questions
Similar Questions
Draw the graph of the relation y2=x2(1−x)
View SolutionDraw the graph of the relation 4y2=x2(4−x2)
View SolutionDraw the graph of the relation (y−x)2=x3
View SolutionDraw the graph of the relation y2(x−1)=x2(1+x)
View SolutionDraw the graph of the equation y−x=2
View SolutionDraw the graph of the equation 2x+y=3
View SolutionDraw the graph of the relation y=|x|√1−x2
View SolutionDraw the graph of y=2x.
View SolutionDraw the graph of equation x+y=5
View SolutionDraw graph of the equation y=x+5
View Solution
