Which one of the following graphs represents correctly represent the variation of the gravitational field (E) with the distance (r) from the centre of a spherical shell of mass M radius R ?
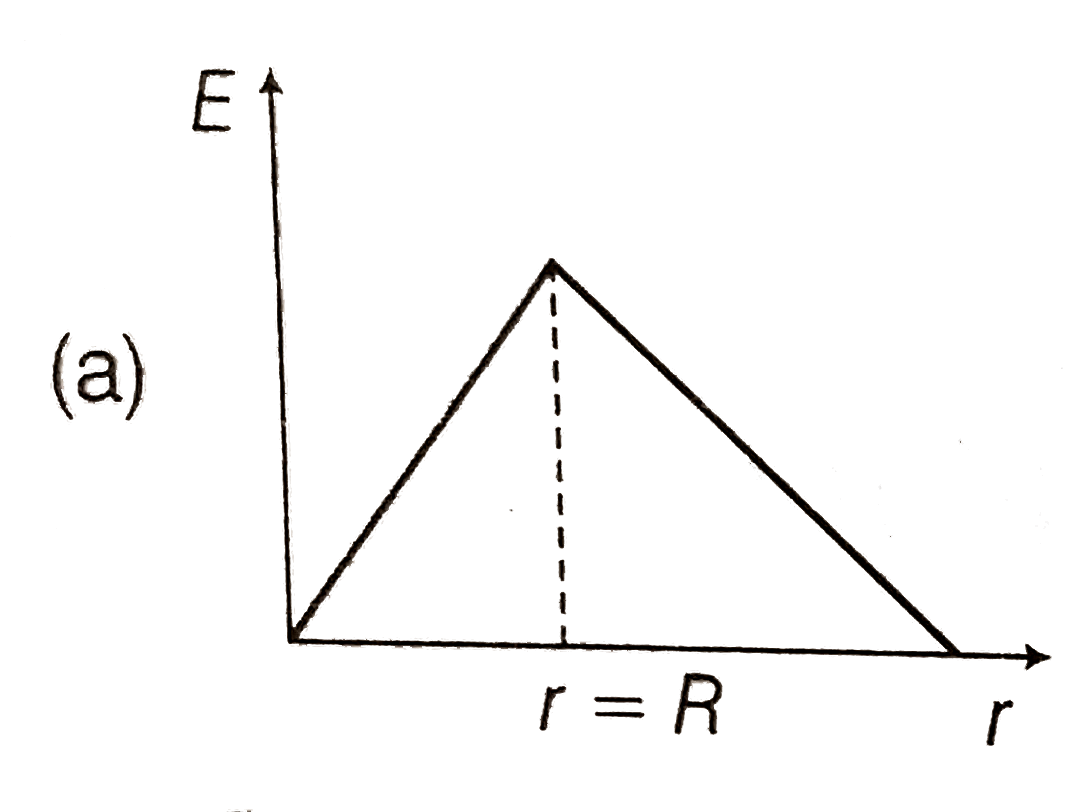
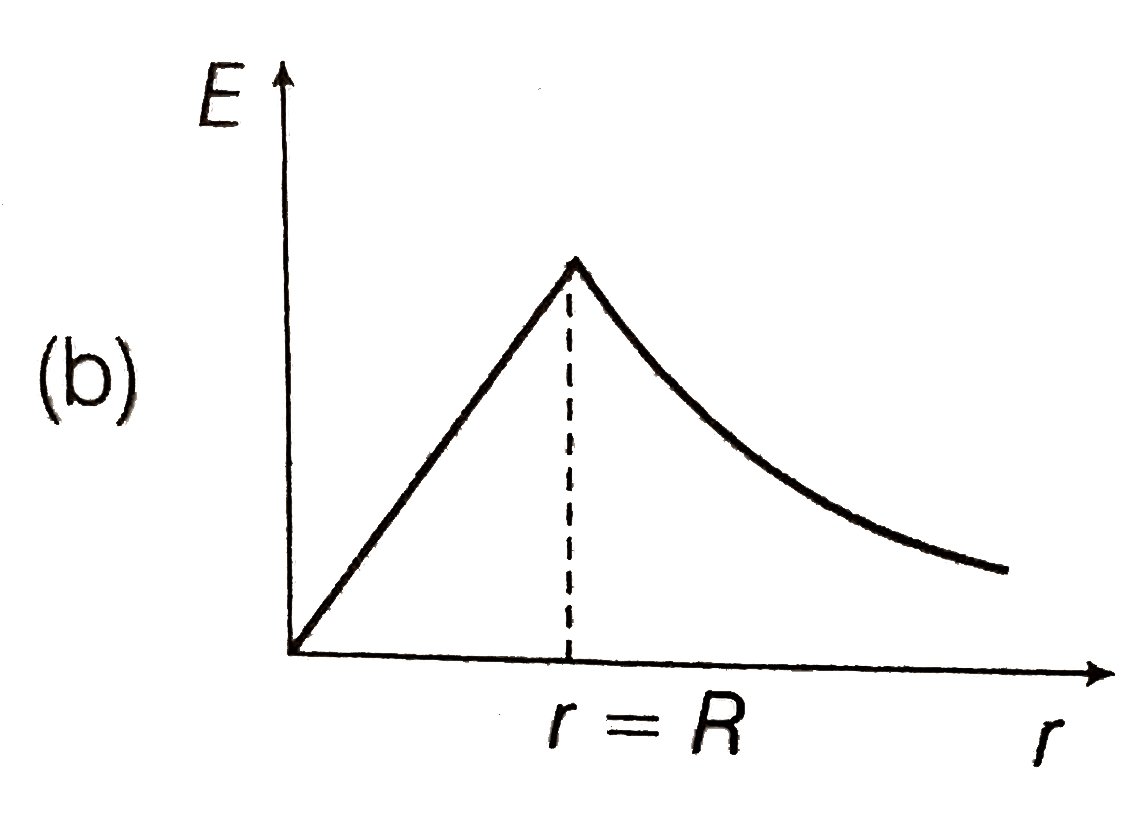
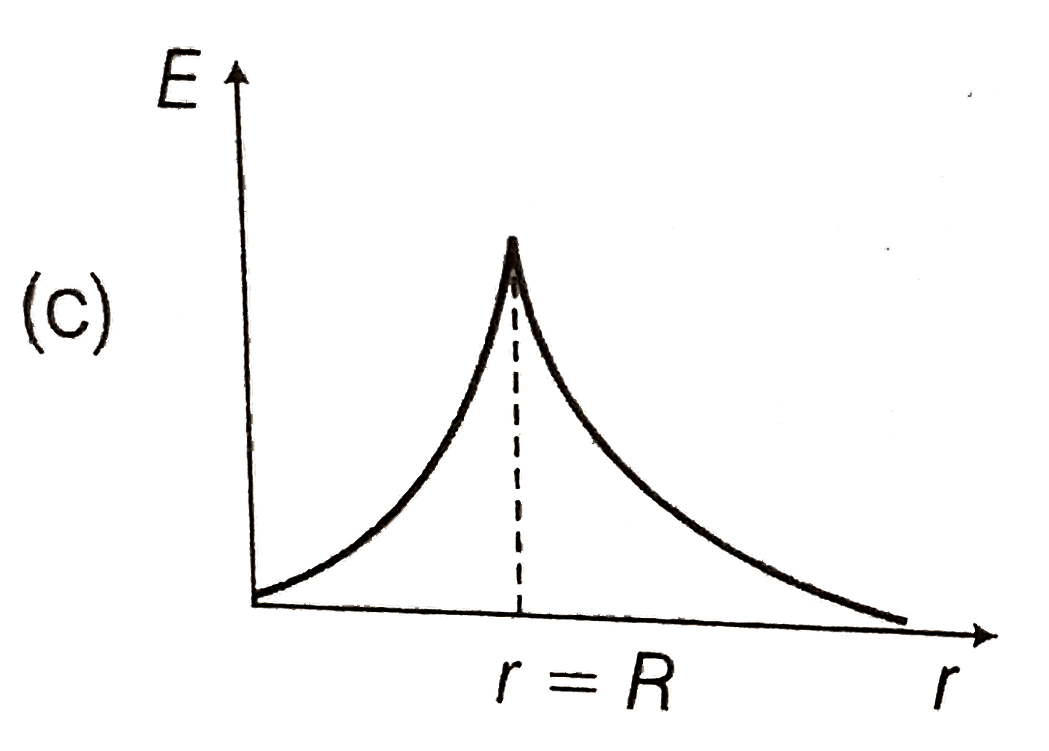
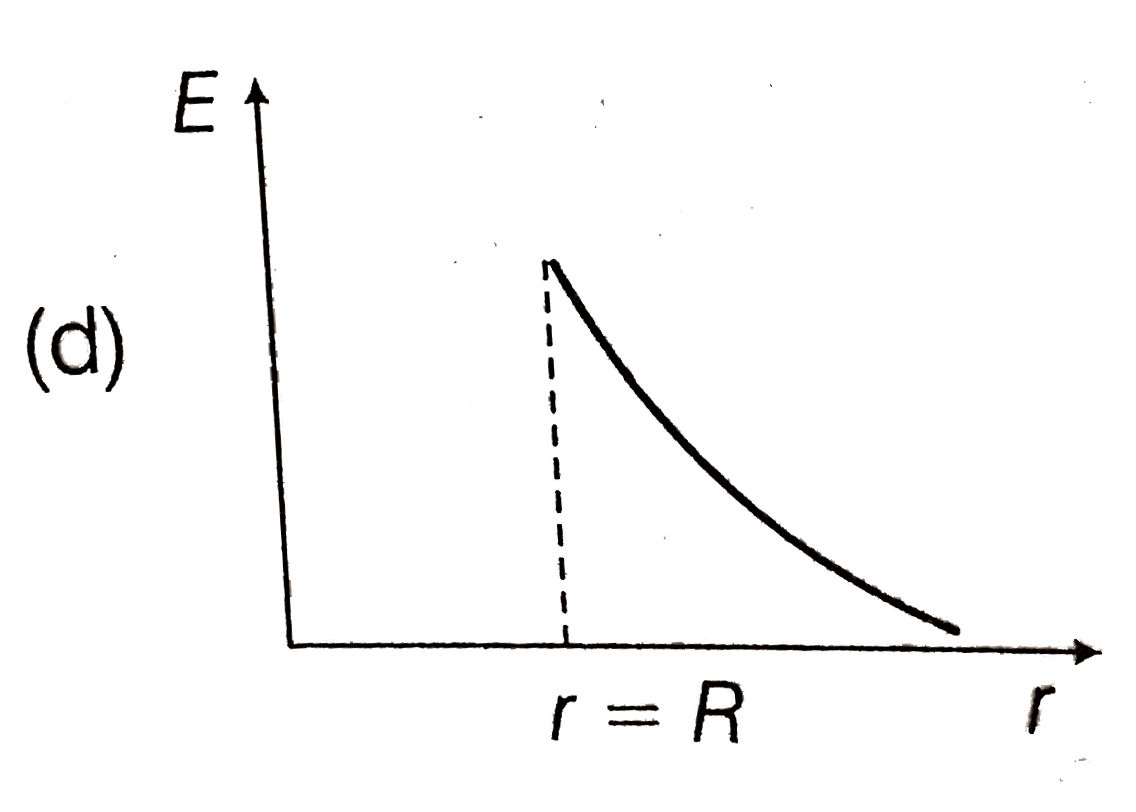
The correct Answer is:D
To solve the question regarding the variation of the gravitational field (E) with the distance (r) from the center of a spherical shell of mass M and radius R, we can follow these steps:
Step 1: Understand the Gravitational Field Inside the Shell
According to the shell theorem, the gravitational field inside a uniform spherical shell of mass is zero. This means that for any point inside the shell (where r < R), the gravitational field E = 0.
Step 2: Analyze the Gravitational Field Outside the Shell
For points outside the spherical shell (where r > R), the gravitational field behaves as if all the mass of the shell were concentrated at its center. The gravitational field E outside the shell can be expressed using Newton's law of gravitation:
E=GMr2
where G is the gravitational constant, M is the mass of the shell, and r is the distance from the center of the shell.
Step 3: Sketch the Graph
- For r < R (inside the shell), E = 0. This means the graph will be flat at zero for this range.
- For r = R, the graph will still be at zero.
- For r > R, E will decrease with the square of the distance (inversely proportional to r2). This means the graph will start to decline as r increases.
Step 4: Identify the Correct Graph
Based on the above analysis, the correct graph will show:
- A horizontal line at E = 0 for r < R.
- A curve that starts from E = 0 at r = R and decreases as r increases for r > R.
Conclusion
The correct option that represents this variation is option D.
---
According to the shell theorem, the gravitational field inside a uniform spherical shell of mass is zero. This means that for any point inside the shell (where r < R), the gravitational field E = 0.
For points outside the spherical shell (where r > R), the gravitational field behaves as if all the mass of the shell were concentrated at its center. The gravitational field E outside the shell can be expressed using Newton's law of gravitation:
E=GMr2
where G is the gravitational constant, M is the mass of the shell, and r is the distance from the center of the shell.
- For r < R (inside the shell), E = 0. This means the graph will be flat at zero for this range.
- For r = R, the graph will still be at zero.
- For r > R, E will decrease with the square of the distance (inversely proportional to r2). This means the graph will start to decline as r increases.
Based on the above analysis, the correct graph will show:
- A horizontal line at E = 0 for r < R.
- A curve that starts from E = 0 at r = R and decreases as r increases for r > R.
The correct option that represents this variation is option D.
Topper's Solved these Questions
- GRAVITATIONBook:DC PANDEYChapter:GRAVITATIONExercise:Check Point 10.4
Explore 10 Videos
- GRAVITATIONBook:DC PANDEYChapter:GRAVITATIONExercise:Check Point 10.5
Explore 20 Videos
- GRAVITATIONBook:DC PANDEYChapter:GRAVITATIONExercise:Check Point 10.2
Explore 20 Videos
- GENERAL PHYSICSBook:DC PANDEYChapter:GENERAL PHYSICSExercise:INTEGER_TYPE
Explore 2 Videos
- KINEMATICSBook:DC PANDEYChapter:KINEMATICSExercise:INTEGER_TYPE
Explore 11 Videos
Similar Questions
Which one of the following graphs represents the variation of electric field with distance r from the centre of a charged spherical conductor of radius R?
View SolutionCalculate gravitational field intensity at a distance x on the axis from centre of a uniform disc of mass M and radius R .
View Solution
Knowledge Check
Which one of the following plots represents the variation of the gravitational field on a particle with distance r due to a thin spherical shell of raduis R? (r is measured from the centre of the spherical shell).
A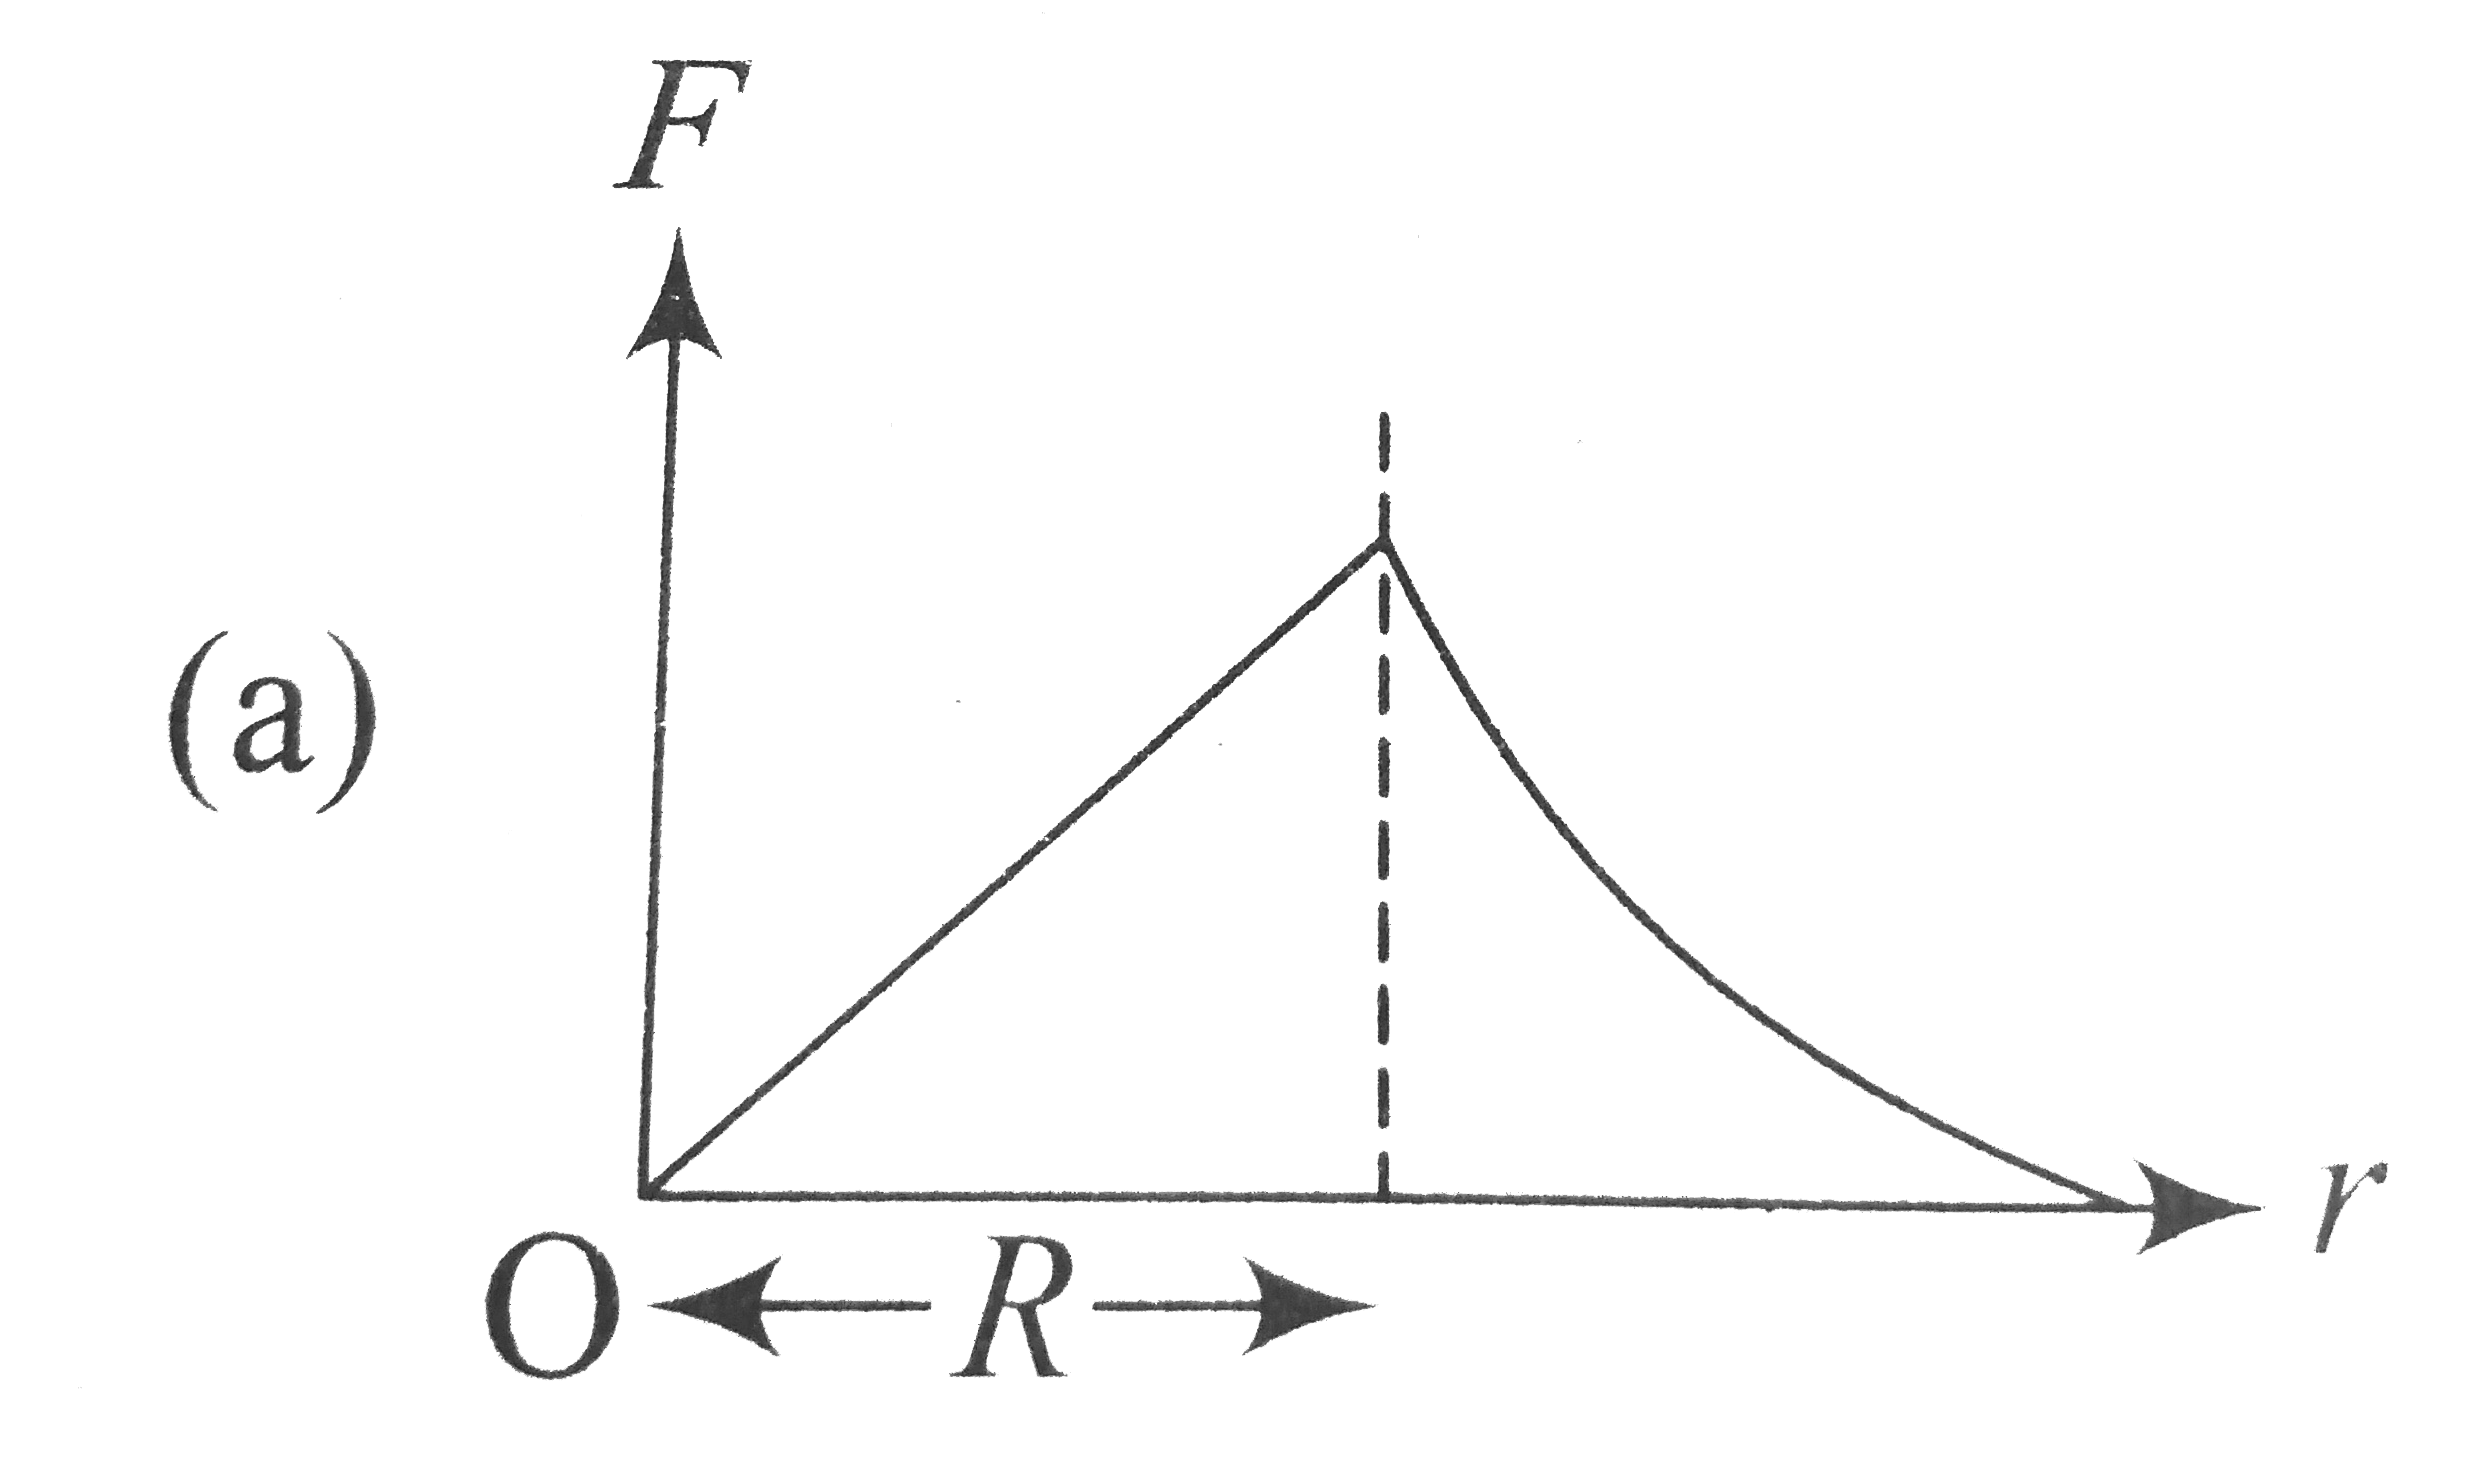 B
B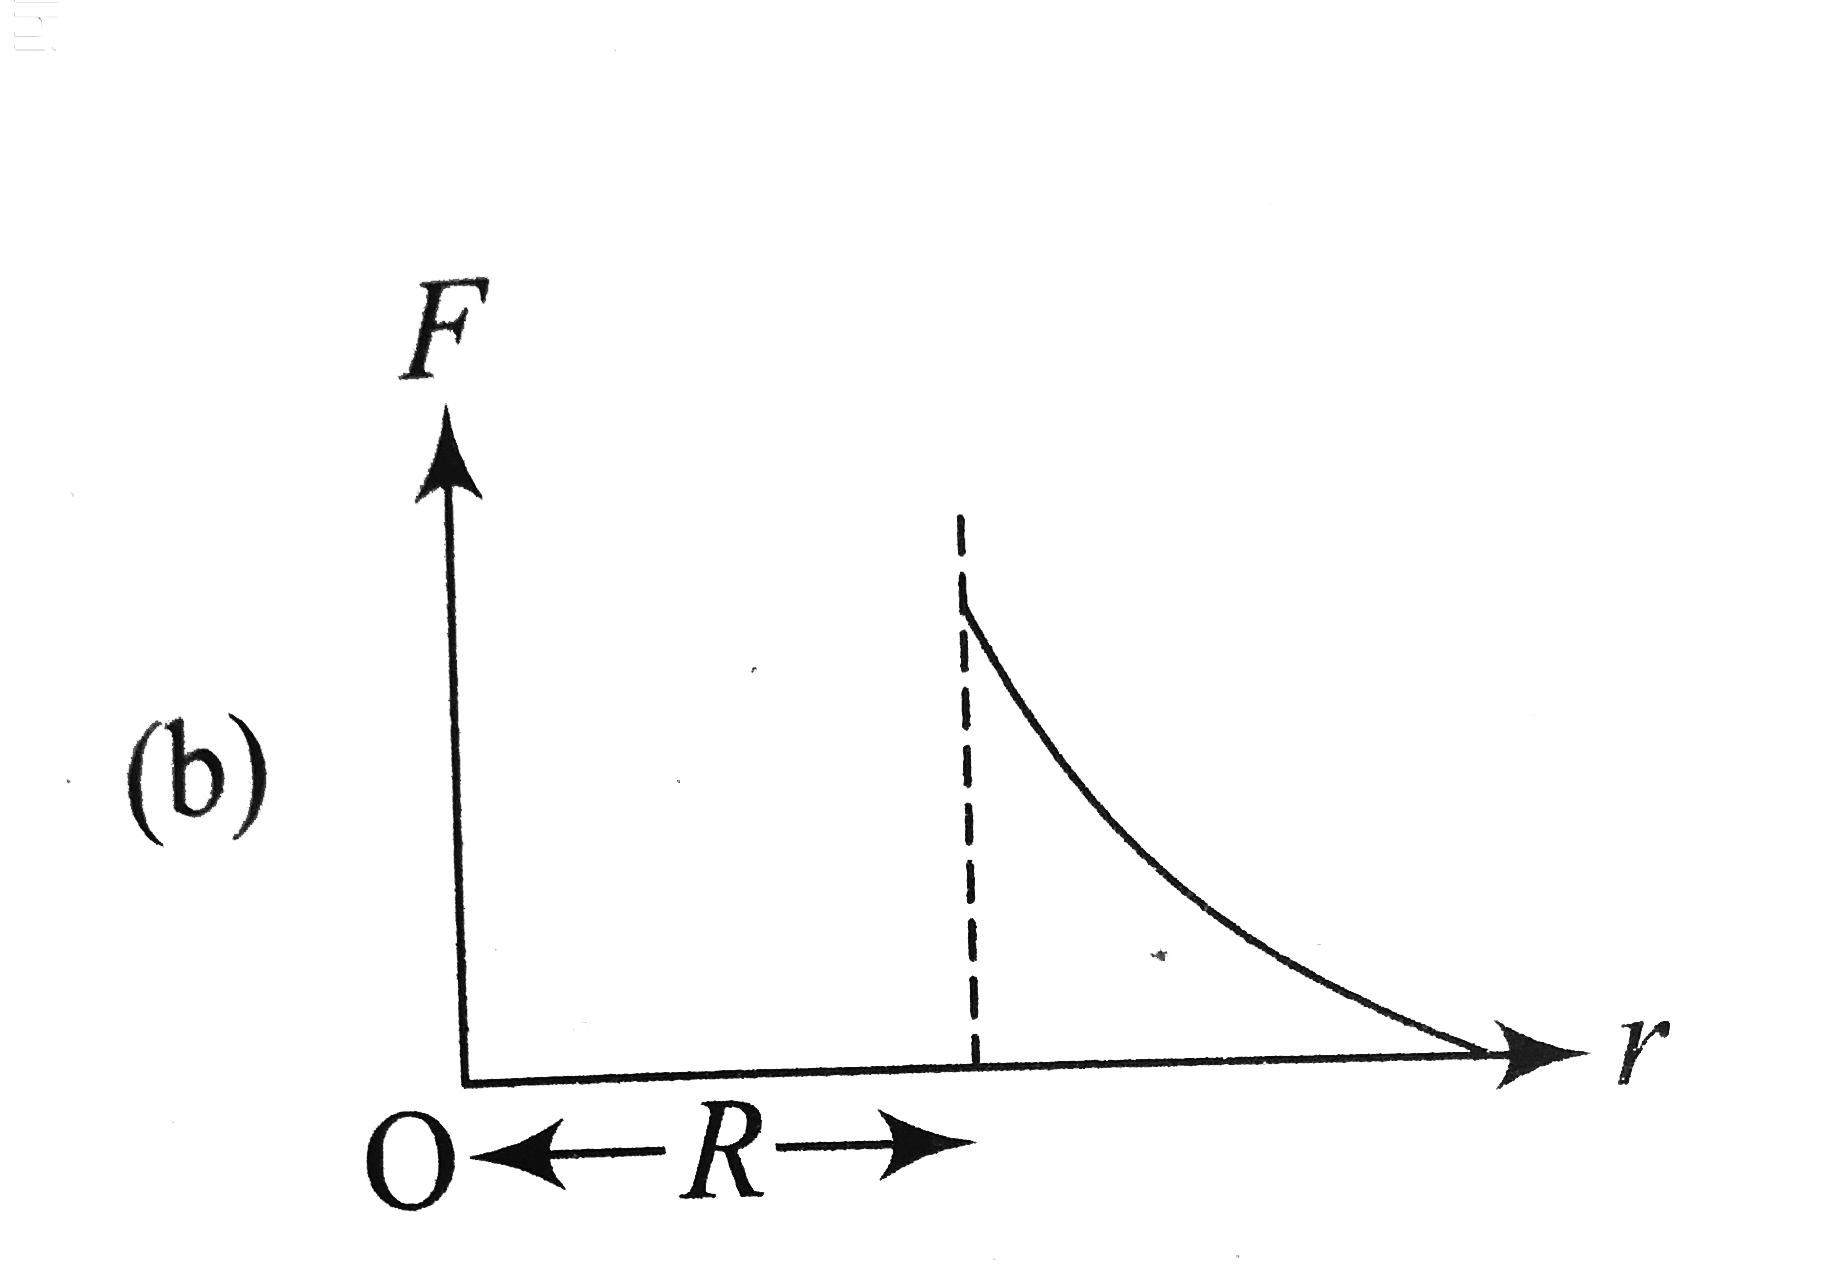 C
C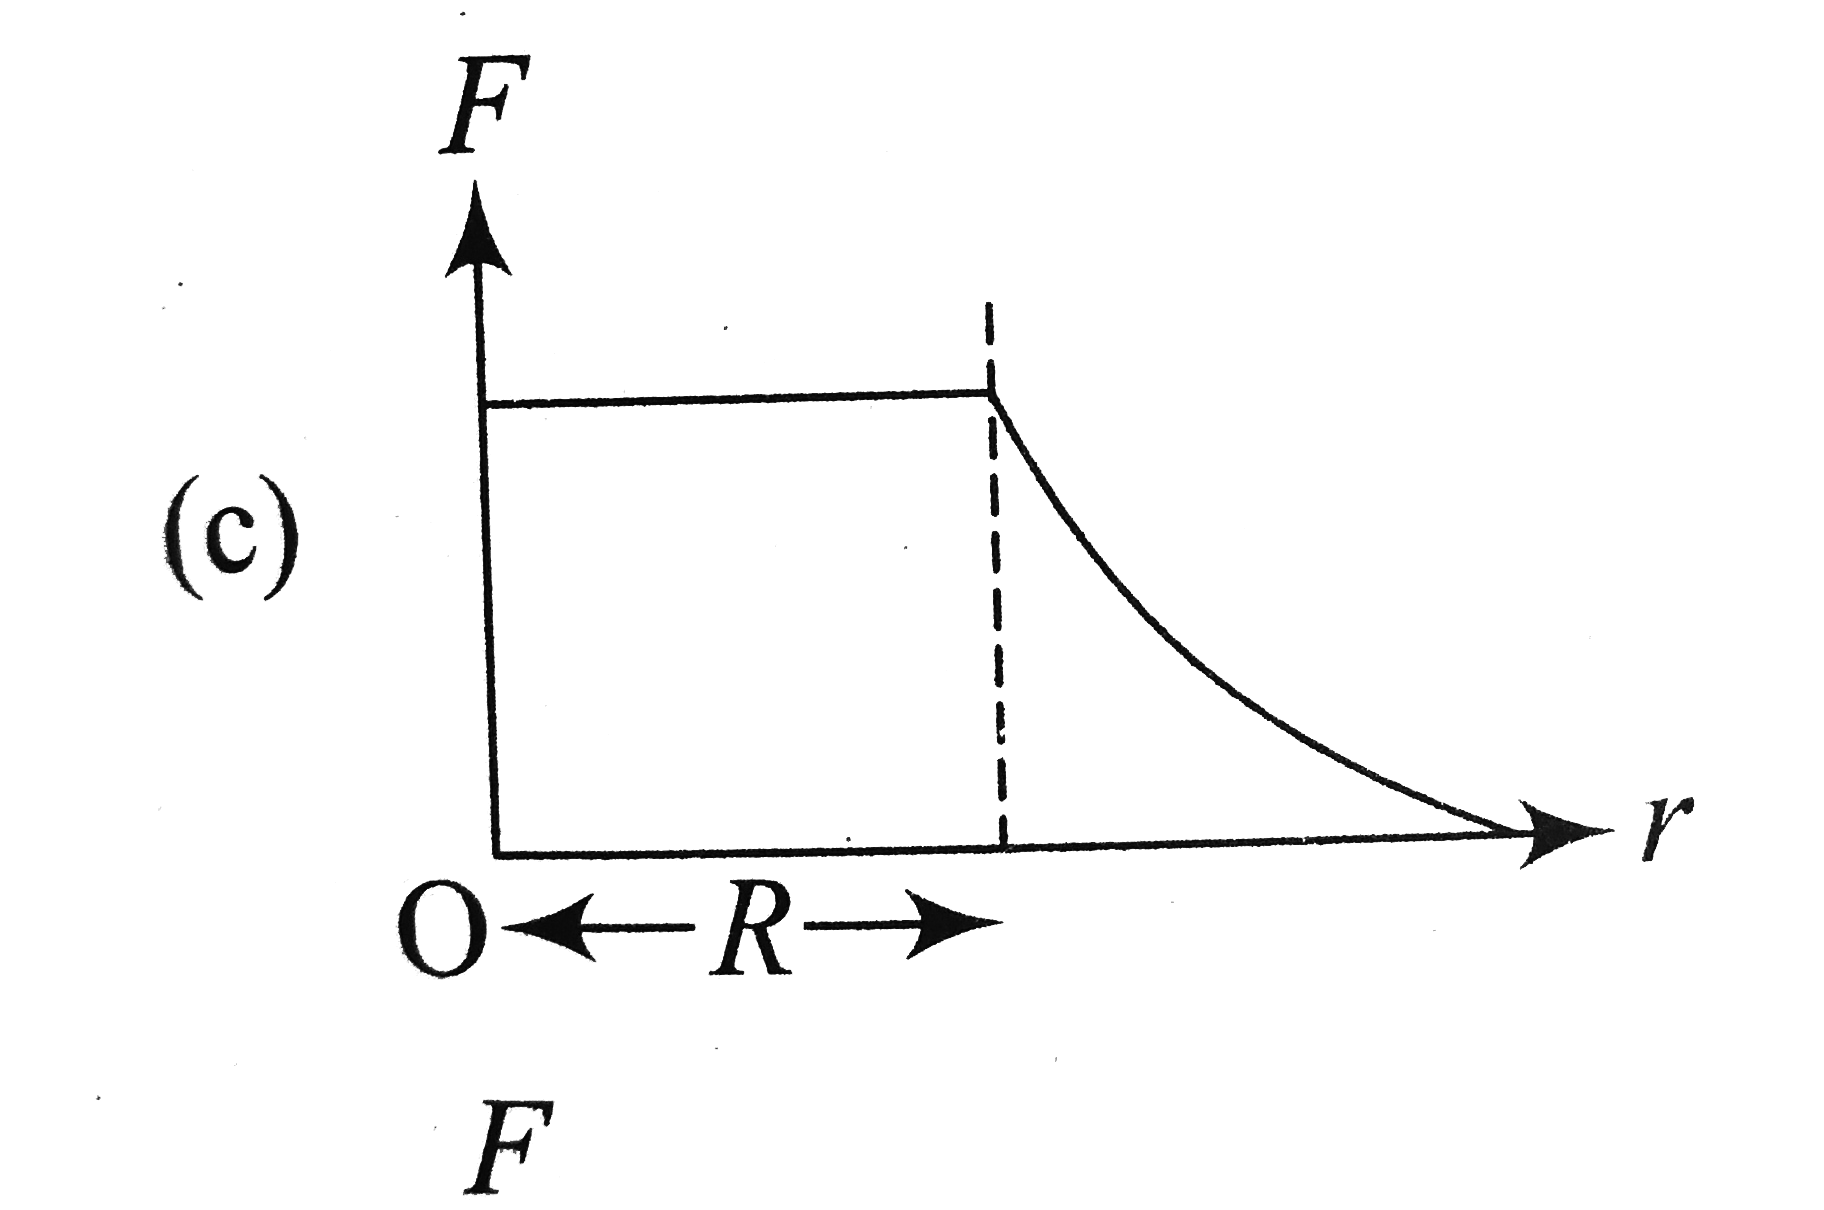 D
D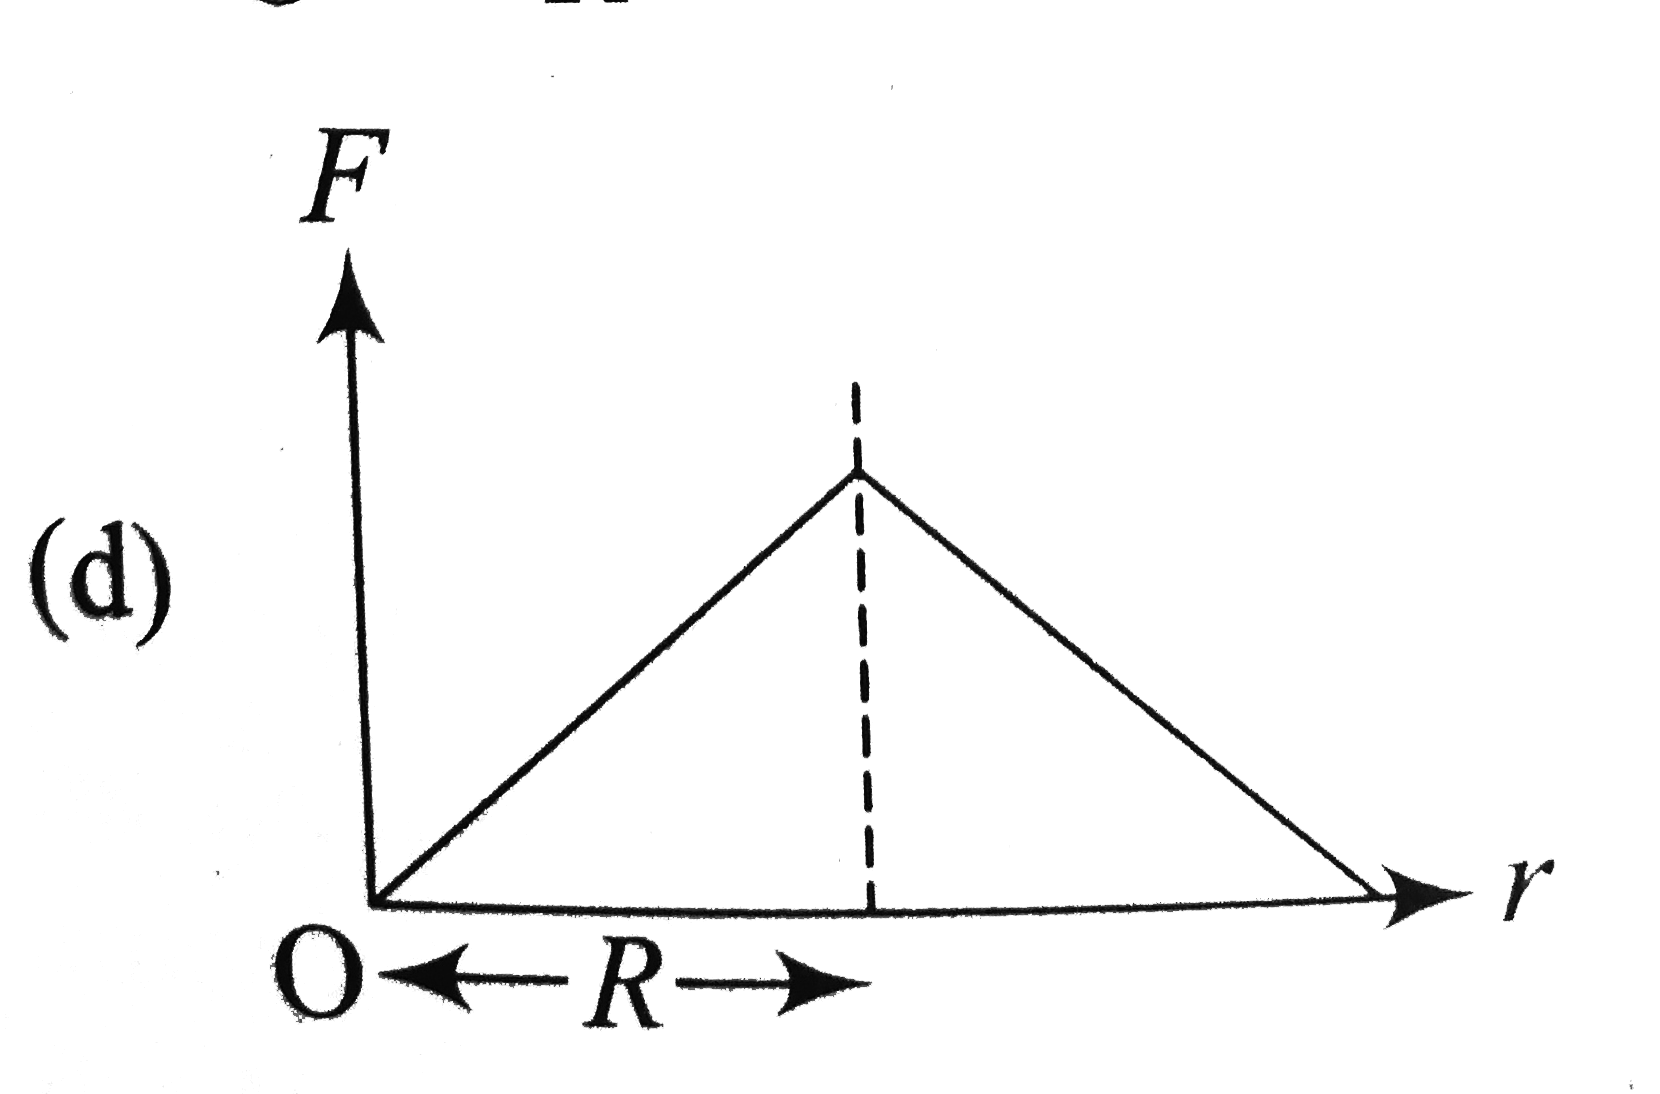
Which one of t he following plots represents the variation of gravitational field of a particle with distance r due to thin spherical shell of radius R ?
A B
B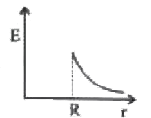 C
C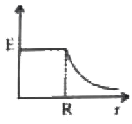 D
D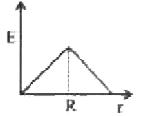
Consider a uniform spherical volume charge distribution of radius R. Which of the following graphs correctly represents the magnitude of the electric field E as a distance r from the center of the sphere ?
A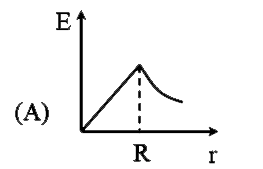 B
B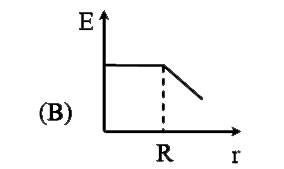 C
C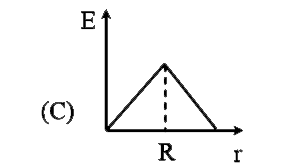 D
D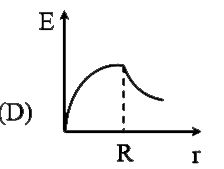
Draw a graph of electric field E(r) with distance r from the centre of the shell for 0≤r≤0 .
View SolutionFollowing curve shows the variation of intesity of gravitational field (→I) with distance from the centre of solid sphere(r) :
View SolutionA metallic spherical shell of radius R has a charge -Q on it. A point charge +Q is placed at the centre of the shell. Which of the graphs shown below may correctly represent the variation of electric field E with distance r from the centre of shell ?
View SolutionAn isolated non-conducting solid sphere of radius R is given an electric charge. The charge is uniformly distributed in the volume of sphere. The graph which shows the correct variation of magnitude of electric field with distance from the centre of the sphere is
View SolutionThe correct variation of gravitational potential V with radius r measured from the centre of earth of radius R is given by
View Solution

