A projectile is projected with a velocity u at an angle θ with the horizontal. For a fixed θ, which of the graphs shown in the following figure shows the variation of range R versus u?
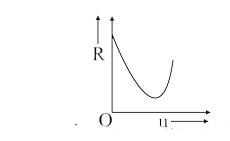
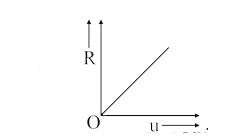
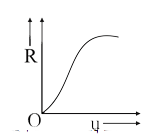
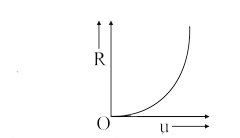
The correct Answer is:D
To solve the problem of determining the variation of range R versus initial velocity u for a projectile launched at a fixed angle θ, we can follow these steps:
Step 1: Understand the Range Formula
The range R of a projectile launched with an initial velocity u at an angle θ is given by the formula:
R=u2sin(2θ)g
where g is the acceleration due to gravity.
Step 2: Identify Constants
Since the angle θ is fixed, sin(2θ) becomes a constant. Therefore, we can denote:
k=sin(2θ)g
This allows us to rewrite the range formula as:
R=ku2
Step 3: Analyze the Relationship
From the equation R=ku2, we can see that the range R is directly proportional to the square of the initial velocity u. This indicates that as u increases, R will increase quadratically.
Step 4: Graphical Representation
The equation R=ku2 represents a parabolic relationship, where R is plotted on the y-axis and u on the x-axis. Since k is a positive constant (as both sin(2θ) and g are positive), the graph will be an upward-opening parabola.
Step 5: Conclusion
Thus, the correct graph that represents the variation of range R versus initial velocity u is an upward parabola. Among the options provided, we select the graph that shows this upward parabolic shape.
Final Answer
The correct option is D, which shows an upward parabola.
---
The range R of a projectile launched with an initial velocity u at an angle θ is given by the formula:
R=u2sin(2θ)g
where g is the acceleration due to gravity.
Since the angle θ is fixed, sin(2θ) becomes a constant. Therefore, we can denote:
k=sin(2θ)g
This allows us to rewrite the range formula as:
R=ku2
From the equation R=ku2, we can see that the range R is directly proportional to the square of the initial velocity u. This indicates that as u increases, R will increase quadratically.
The equation R=ku2 represents a parabolic relationship, where R is plotted on the y-axis and u on the x-axis. Since k is a positive constant (as both sin(2θ) and g are positive), the graph will be an upward-opening parabola.
Thus, the correct graph that represents the variation of range R versus initial velocity u is an upward parabola. Among the options provided, we select the graph that shows this upward parabolic shape.
The correct option is D, which shows an upward parabola.
Topper's Solved these Questions
- Motion in Two DimensionsBook:VMC MODULES ENGLISHChapter:Motion in Two DimensionsExercise:MCQ
Explore 2 Videos
- Motion in Two DimensionsBook:VMC MODULES ENGLISHChapter:Motion in Two DimensionsExercise:JEE Main (Archive)
Explore 19 Videos
- Motion in Straight Line Book:VMC MODULES ENGLISHChapter:Motion in Straight Line Exercise:IN-CHAPTER EXERCISE-J
Explore 10 Videos
- MOVING CHARGES & MAGNETISM Book:VMC MODULES ENGLISHChapter:MOVING CHARGES & MAGNETISM Exercise:IN-CHAPTER EXERCISE-K
Explore 10 Videos
Similar Questions
A particle is projected with a velocity u making an angle θ with the horizontal. The instantaneous power of the gravitational force
View SolutionA particle is projected from the ground with velocity u making an angle θ with the horizontal. At half of its maximum heights,
View SolutionA particle is fired with velocity u making angle θ with the horizontal.What is the change in velocity when it is at the highest point?
View SolutionA projectile is projected with speed u at an angle θ with the horizontal . The average velocity of the projectile between the instants it crosses the same level is
View SolutionA particle is projected with velocity u at angle θ with horizontal. Find the time when velocity vector is perpendicular to initial velocity vector.
View SolutionA particle is projected with velocity u at angle θ with horizontal. Find the time when velocity vector is perpendicular to initial velocity vector.
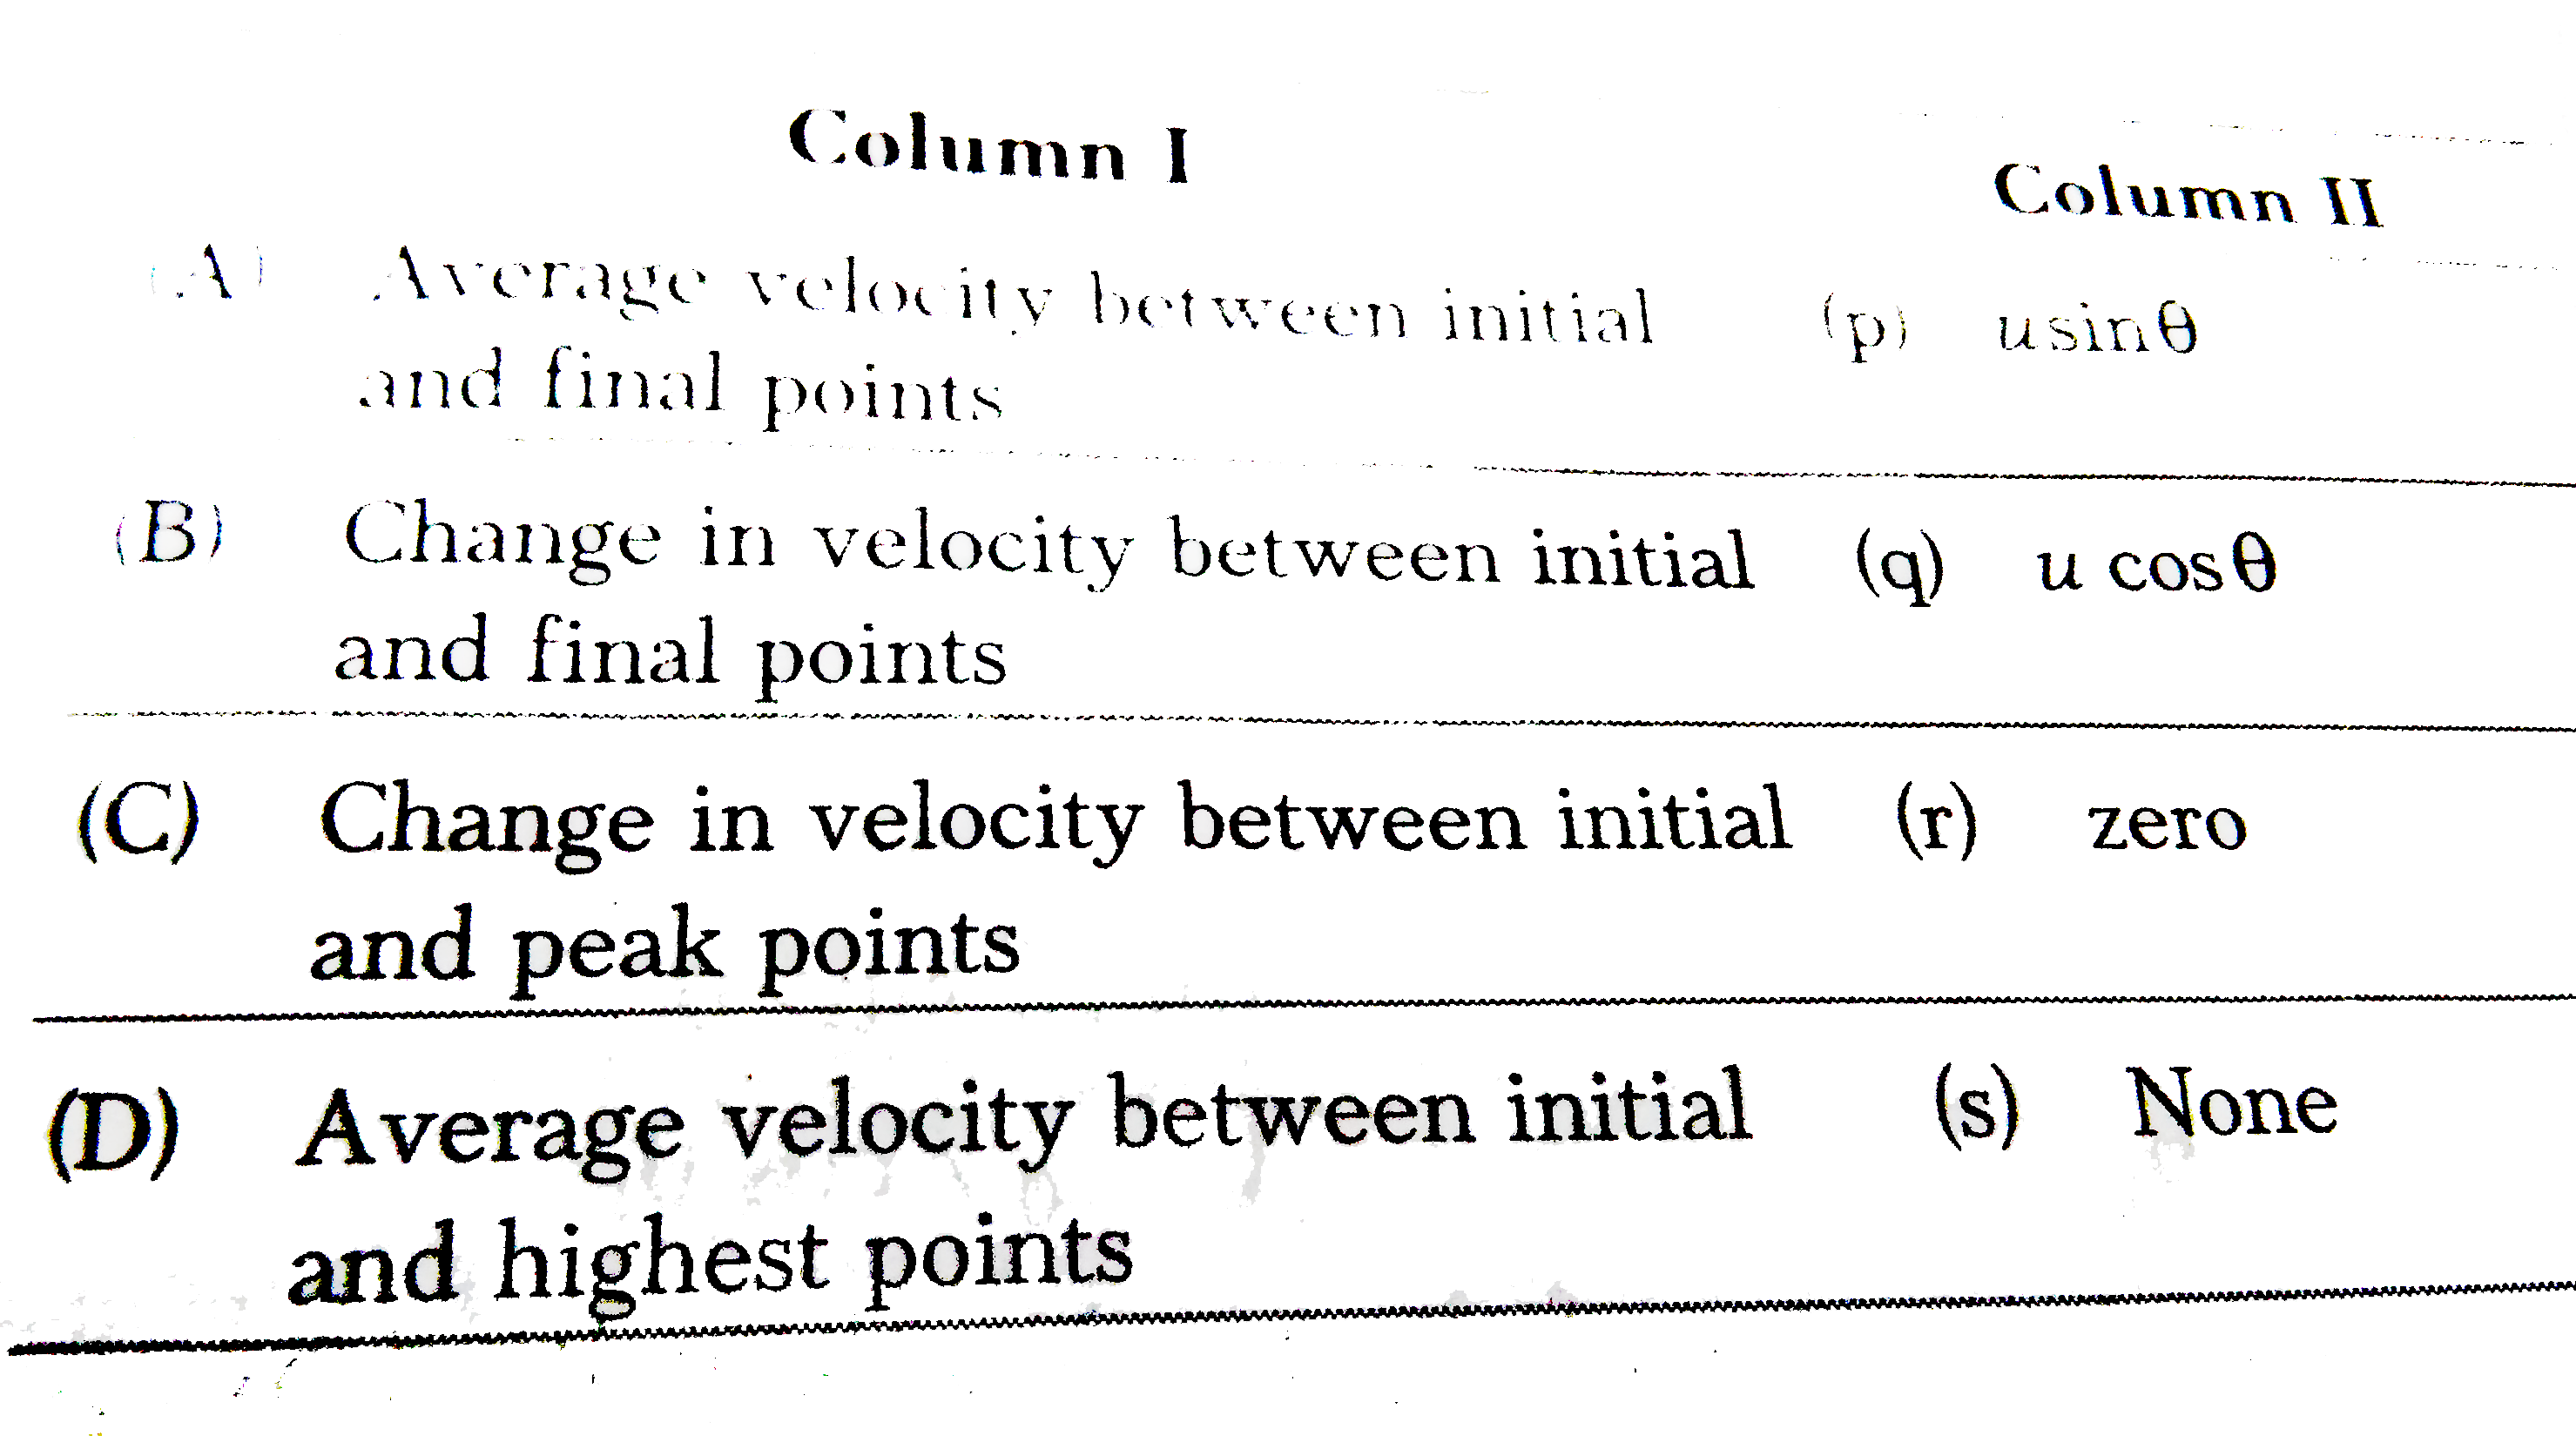
View SolutionA particle is projected form ground with velocity u ar angle θ from horizontal. Match the following two columns.
View SolutionA particle is projected with speed u at angle θ to the horizontal. Find the radius of curvature at highest point of its trajectory
View SolutionA particle is projected at t=0 with velocity u at angle θ with the horizontal. Then the ratio of the tangential acceleration and the radius of curvature at the point of projection is :
View SolutionA projectile is fired with a speed u at an angle θ with the horizontal. Find its speed when its direction of motion makes an angle α with the horizontal.
View Solution

