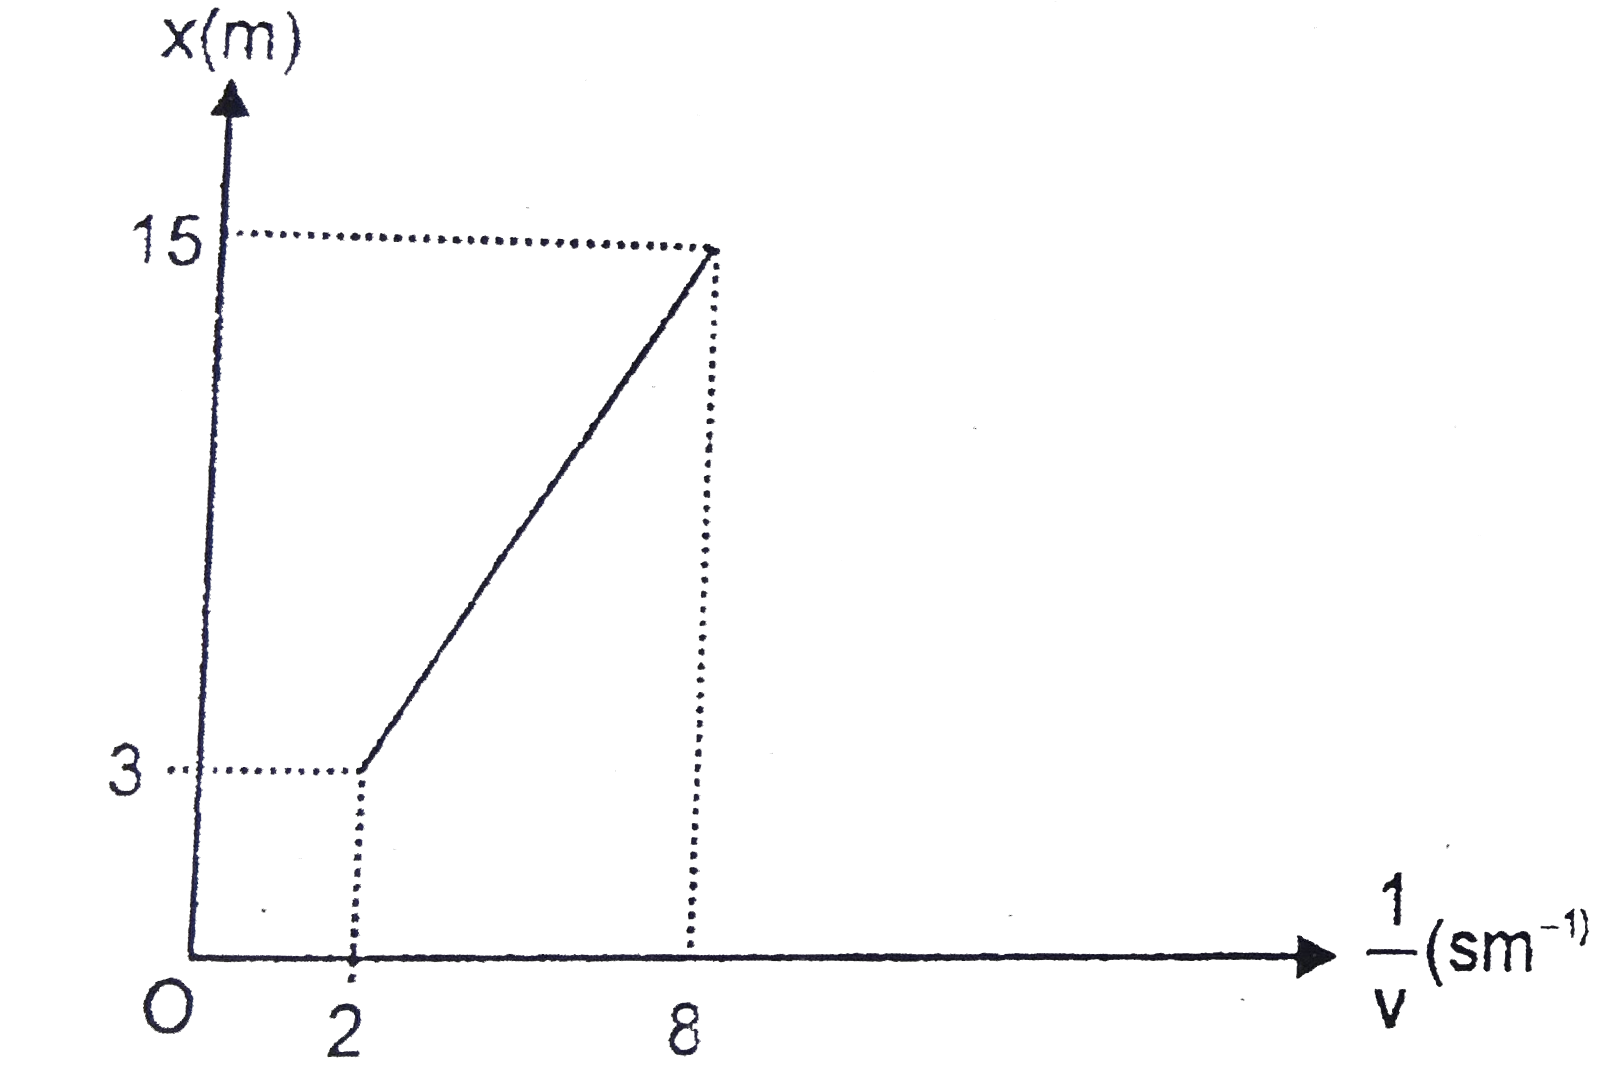
Graph of position (x) vs inverse of velocity (1v) for a particle moving on a straight line is as shown. The time taken by the particle to move from x=3m to x=15 is :
40 sec.
80 sec.
60 sec.
100 sec.
The correct Answer is:C
the equation of the straight line shown in the graph is
x=2v=−1
But v=dxdt
∴x=2dtdx−1
⇒xdx=2dt−dx
⇒15∫3xdx=21∫0dt−15∫3dx
⇒12[225−9]=2t−[15−3]
⇒108+12=2t,t=60s
Topper's Solved these Questions
- TEST PAPERSBook:RESONANCE ENGLISHChapter:TEST PAPERSExercise:PART - II PHYSICS
Explore 106 Videos
- SIMPLE HARMONIC MOTION Book:RESONANCE ENGLISHChapter:SIMPLE HARMONIC MOTION Exercise:Advanced Level Problems
Explore 13 Videos
- TEST SERIESBook:RESONANCE ENGLISHChapter:TEST SERIESExercise:PHYSICS
Explore 130 Videos
Similar Questions
The velocity time plot for a particle moving on straight line is shown in the figure.

View SolutionThe velocity time plot for a particle moving on straight line is shown in the figure.

View SolutionThe variation of velocity of a particle moving along a straight line is shown in . is
 .
.
View SolutionVelocity displacement graph of a particle moving in a straight line is as shown in figure.

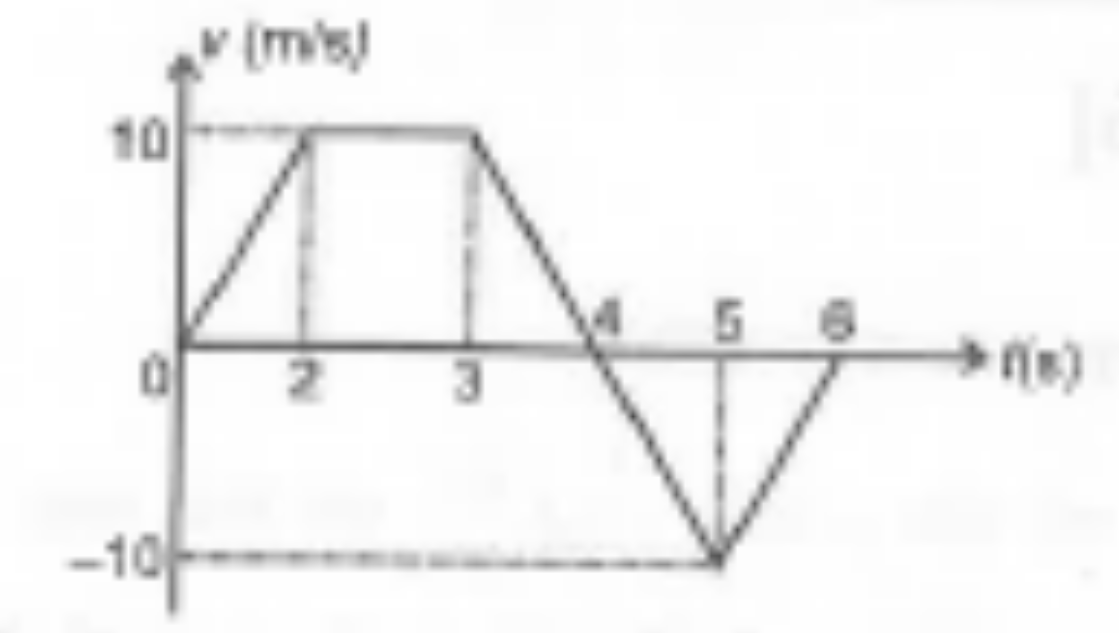
View SolutionThe velocity (v)-time (t) graph of a partide moving along a straight line is as shown in the figure. The displacement of the particle from t = 0 to t = 4 is
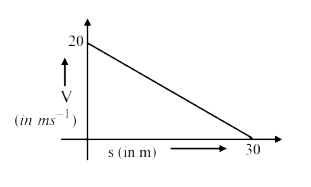
View SolutionThe velocity –position graph of a particle moving along a straight line is shown. Then acceleration of the particle at s = 15 m is :
View SolutionDisplacement time graph of a particle moving in a straight line is a shown in figure.

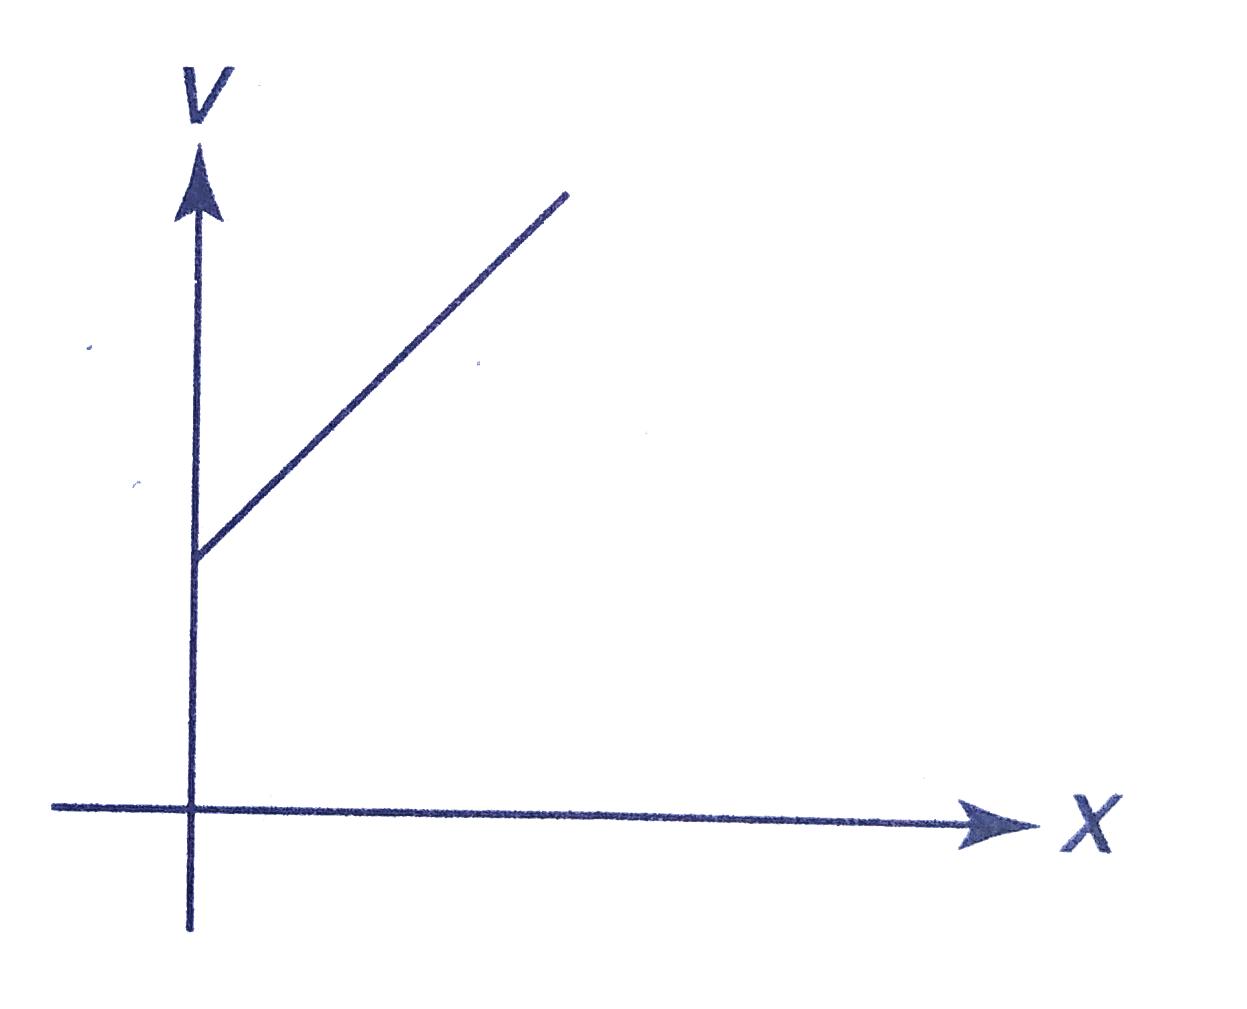
View SolutionGraph of velocity versus displacement of a particle moving in a straight line is as shown in figure.
The acceleration of the particle is.
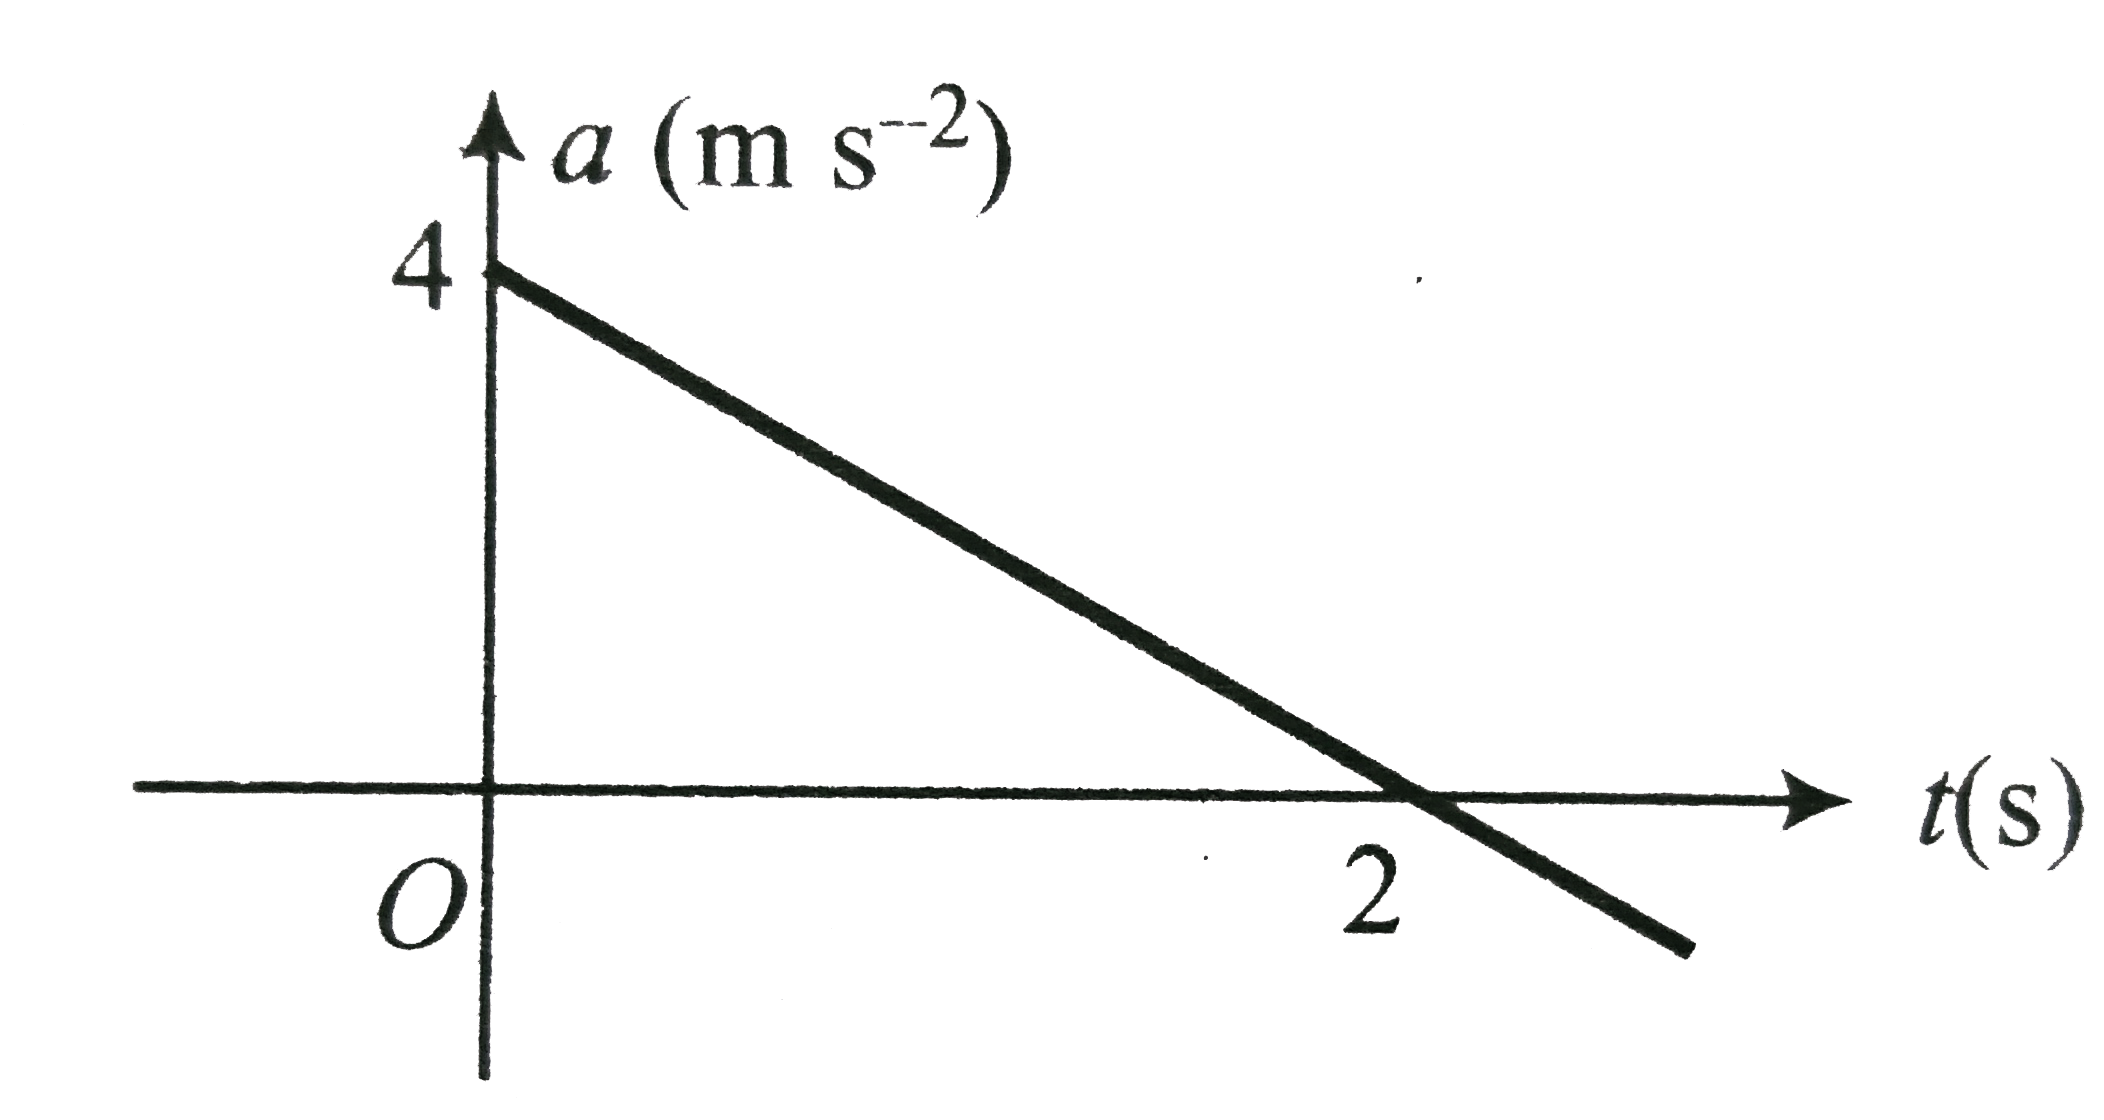
View SolutionThe acceleration versus time graph of a particle moving in a straight line is show in. The velocity-time graph of the particle would be
 .
.
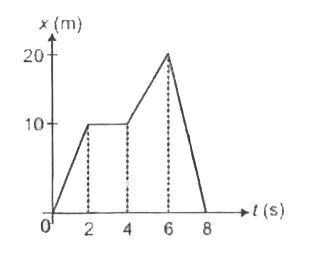
View SolutionThe position (x) - time (t) graph for a particle moving along a straight line is shown in figure. The average speed of particle in time interval t = 0 to t = 8 s is
View Solution