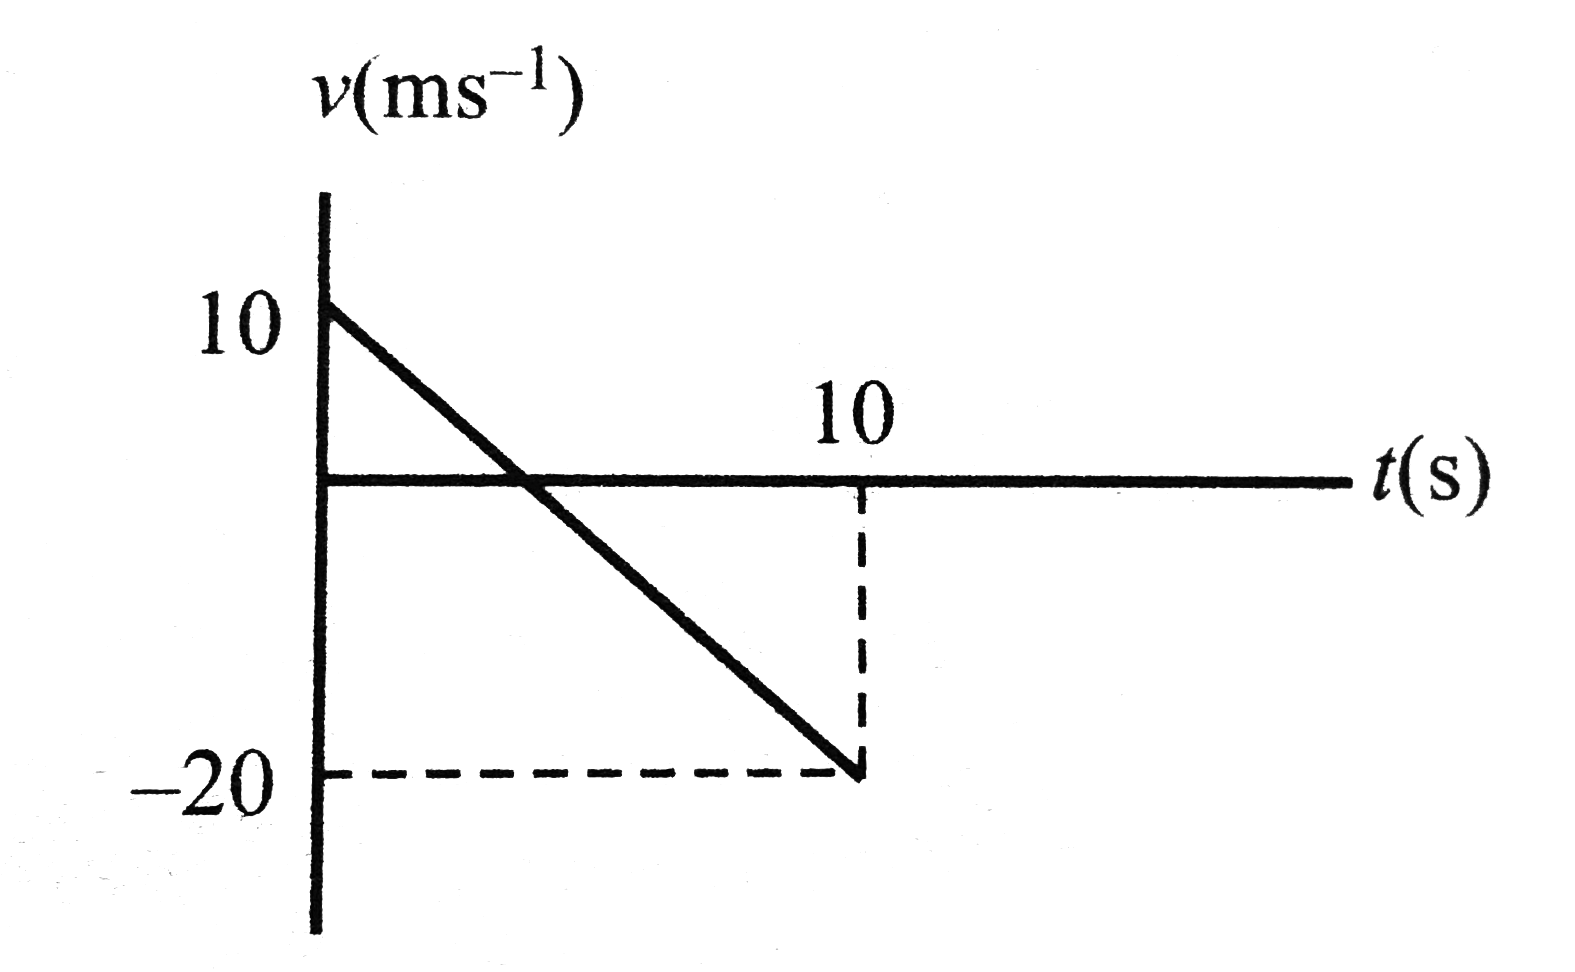
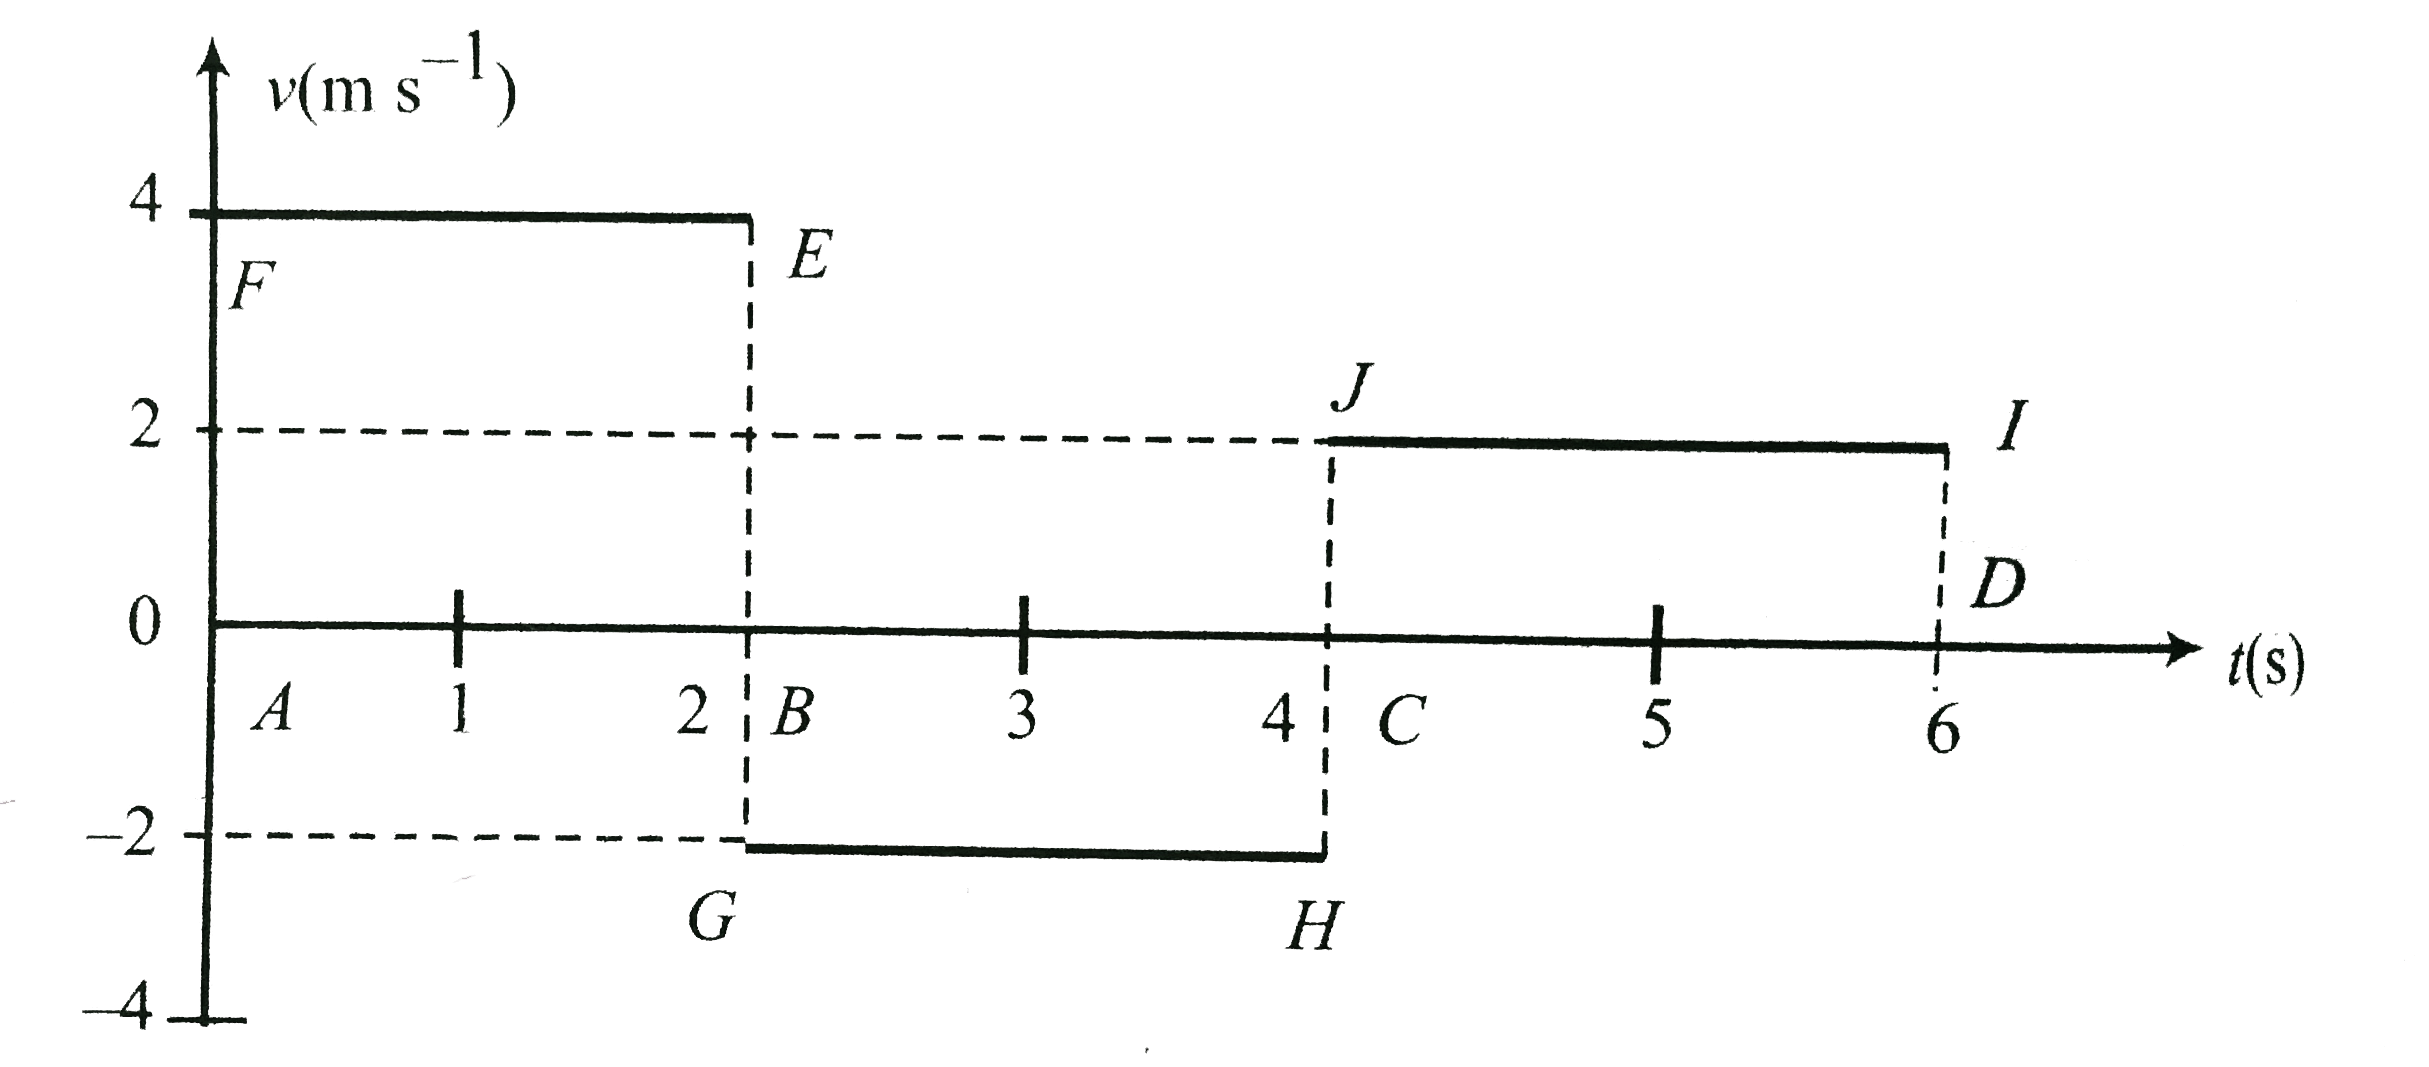
The velocity time plot for a particle moving on straight line is shown in the figure.
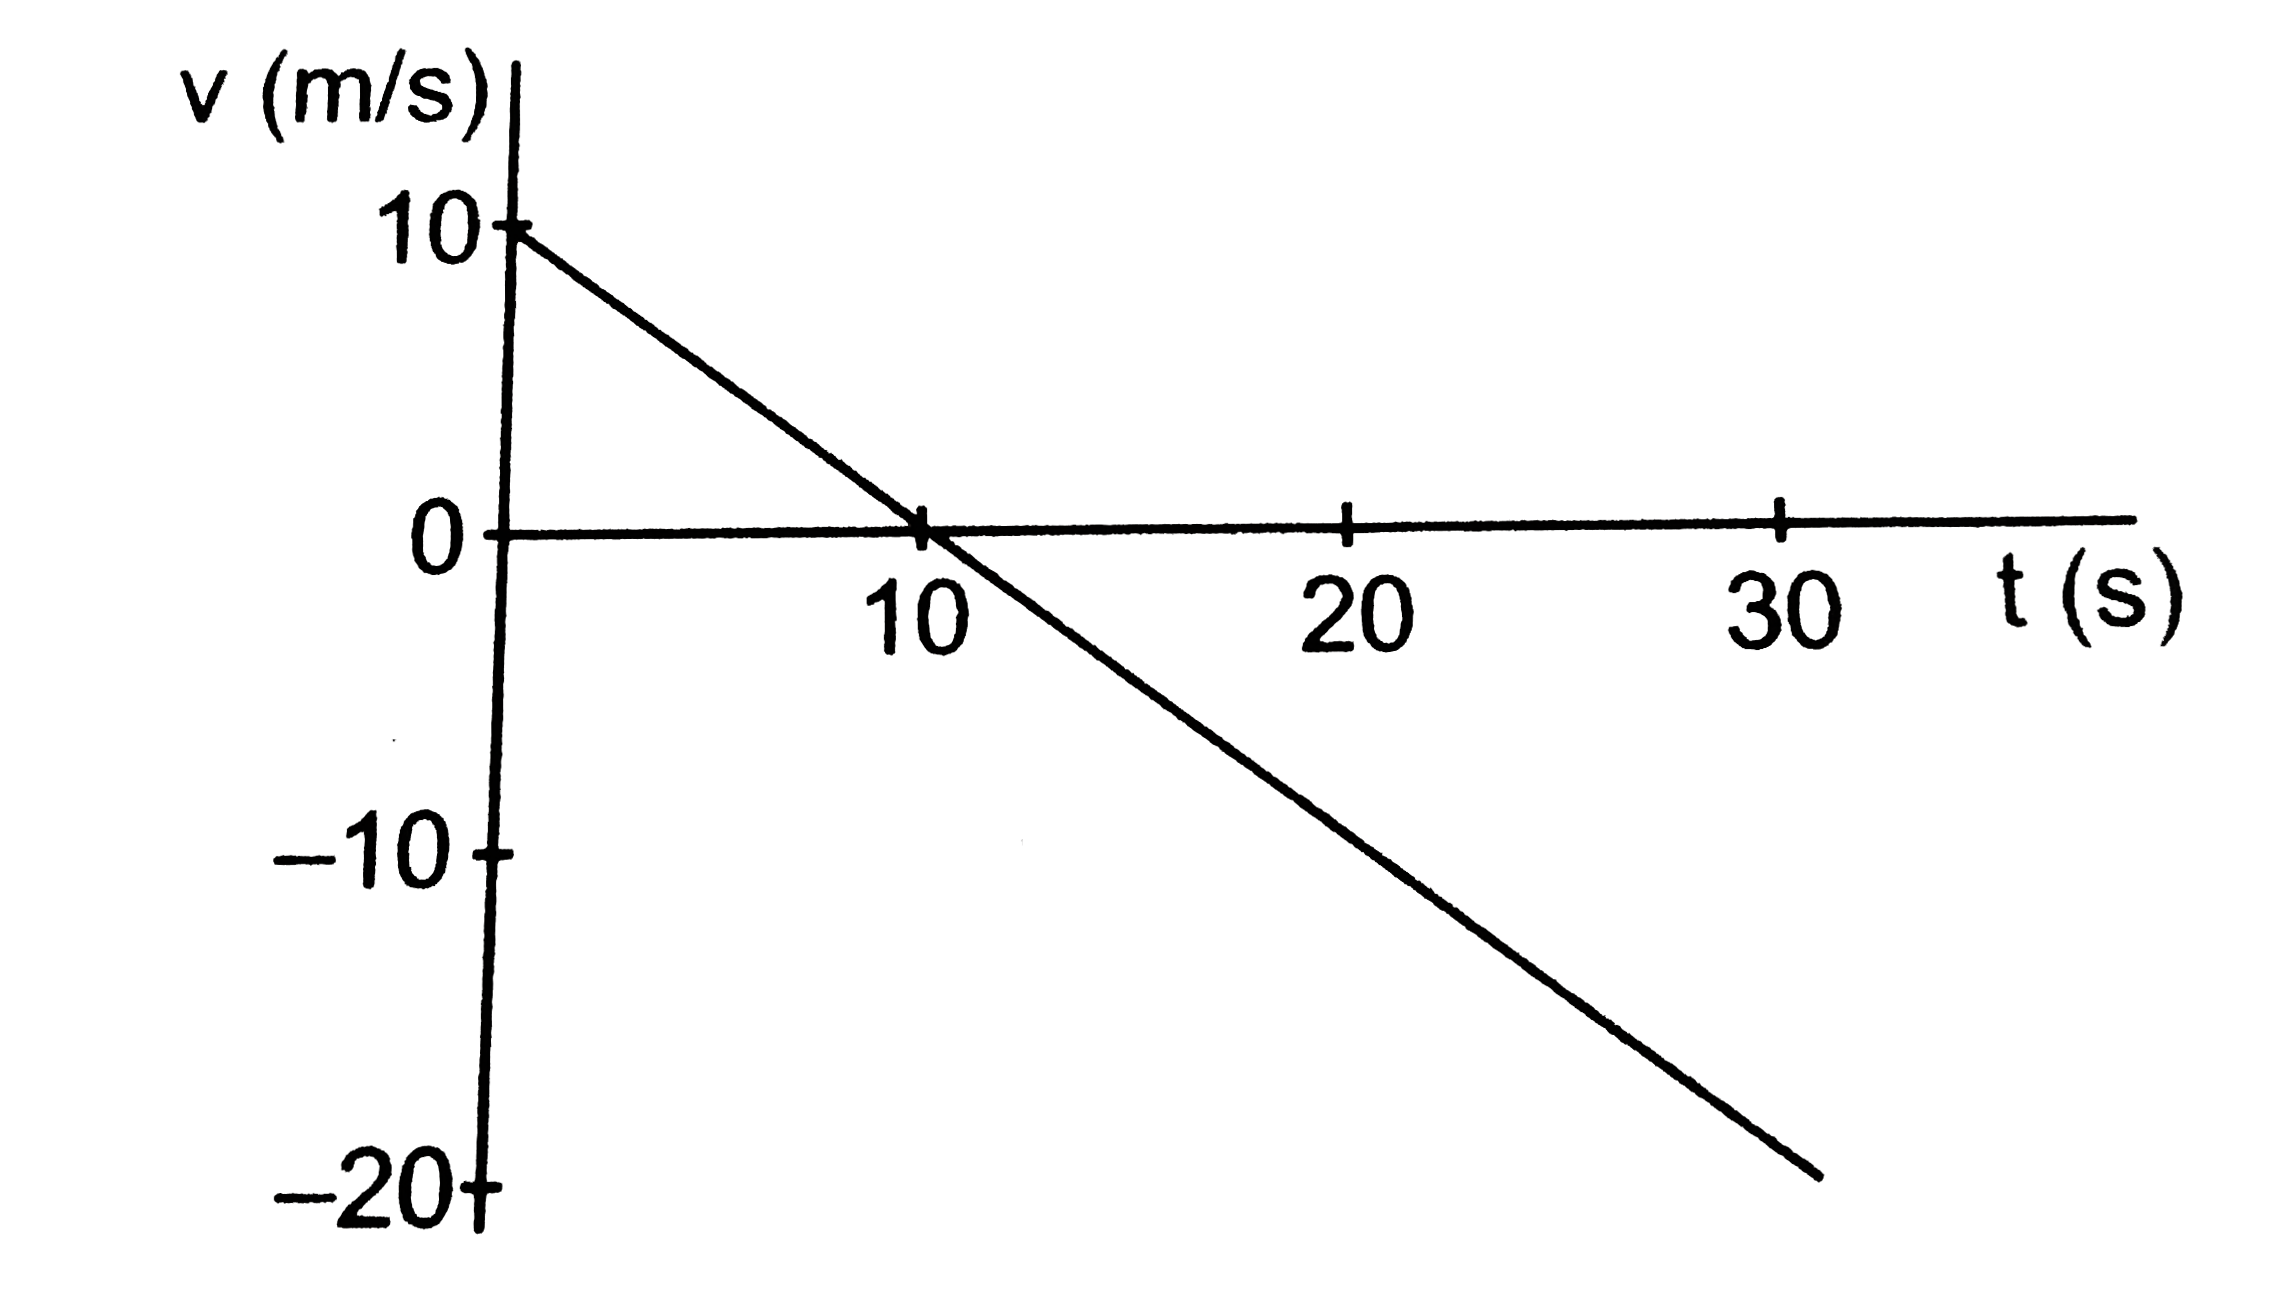
The particle has a constant acceleration..
Theparticle has vever turned around.
The particle has zero displacement .
The average speed in the interval 0to 10s is the same as the average speed in the interval 10s→20s.
The correct Answer is:A, D
Since the graph is a straight line, its slope is constant. Means acceleration of the particle is constant. Veloctity of the particles changes from positive to negative at t=10s. So particle changes derticle at this time. The particle has zero displacement up to 20s, but not for the entire motion. The average speed in the interval of 10s to 20s because distance covered in both in the intervals is same.
Topper's Solved these Questions
- KINEMATICS-1Book:CENGAGE PHYSICS ENGLISHChapter:KINEMATICS-1Exercise:Assertion-reasoning
Explore 5 Videos
- KINEMATICS-1Book:CENGAGE PHYSICS ENGLISHChapter:KINEMATICS-1Exercise:Linked Comprehension
Explore 30 Videos
- KINEMATICS-1Book:CENGAGE PHYSICS ENGLISHChapter:KINEMATICS-1Exercise:Graphical cancept
Explore 1 Video
- GRAVITATIONBook:CENGAGE PHYSICS ENGLISHChapter:GRAVITATIONExercise:INTEGER_TYPE
Explore 1 Video
- KINEMATICS-2Book:CENGAGE PHYSICS ENGLISHChapter:KINEMATICS-2Exercise:Exercise Integer
Explore 9 Videos
Similar Questions
The velocity-time plot for a particle moving on a straight line is shown in figure. Choose correct options .
View SolutionThe velocity time graph of a particle moving along a straight line is shown in the figure. In the time interval from t=0 to t=8 second, answer the following three question.
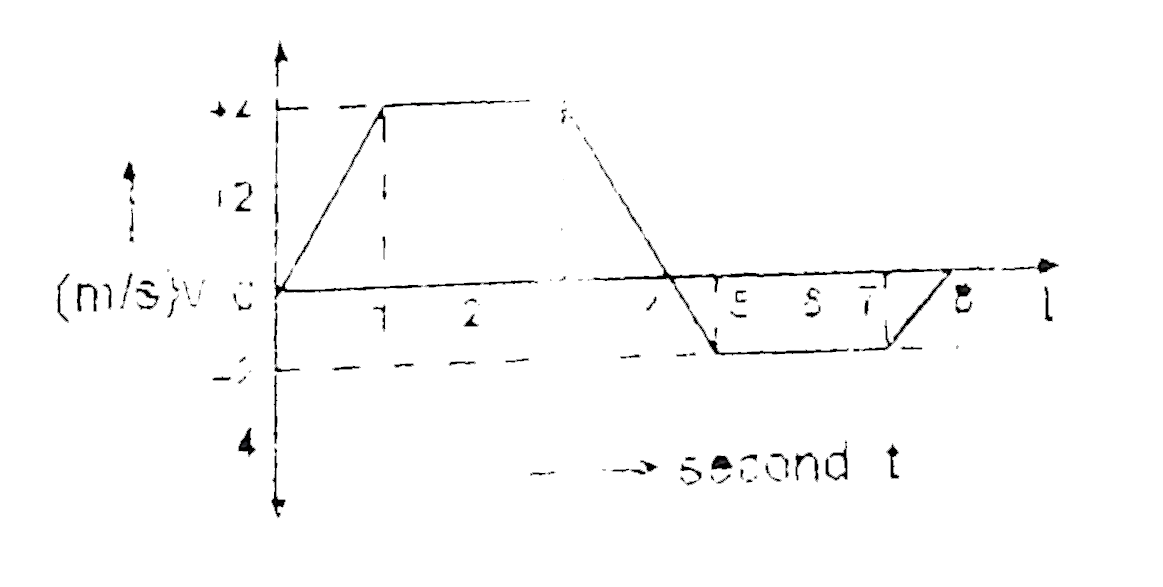
The distance travelled by the particle is :
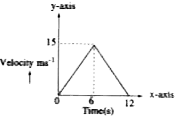
View SolutionThe velocity and time graph for a particle moving in a straight line s shown in the figure. Then, the average velocity between t=4 s and t=6 s is _____
View SolutionThe velocity-time graph of a particle moving along a straight line is shown in the figure-given below
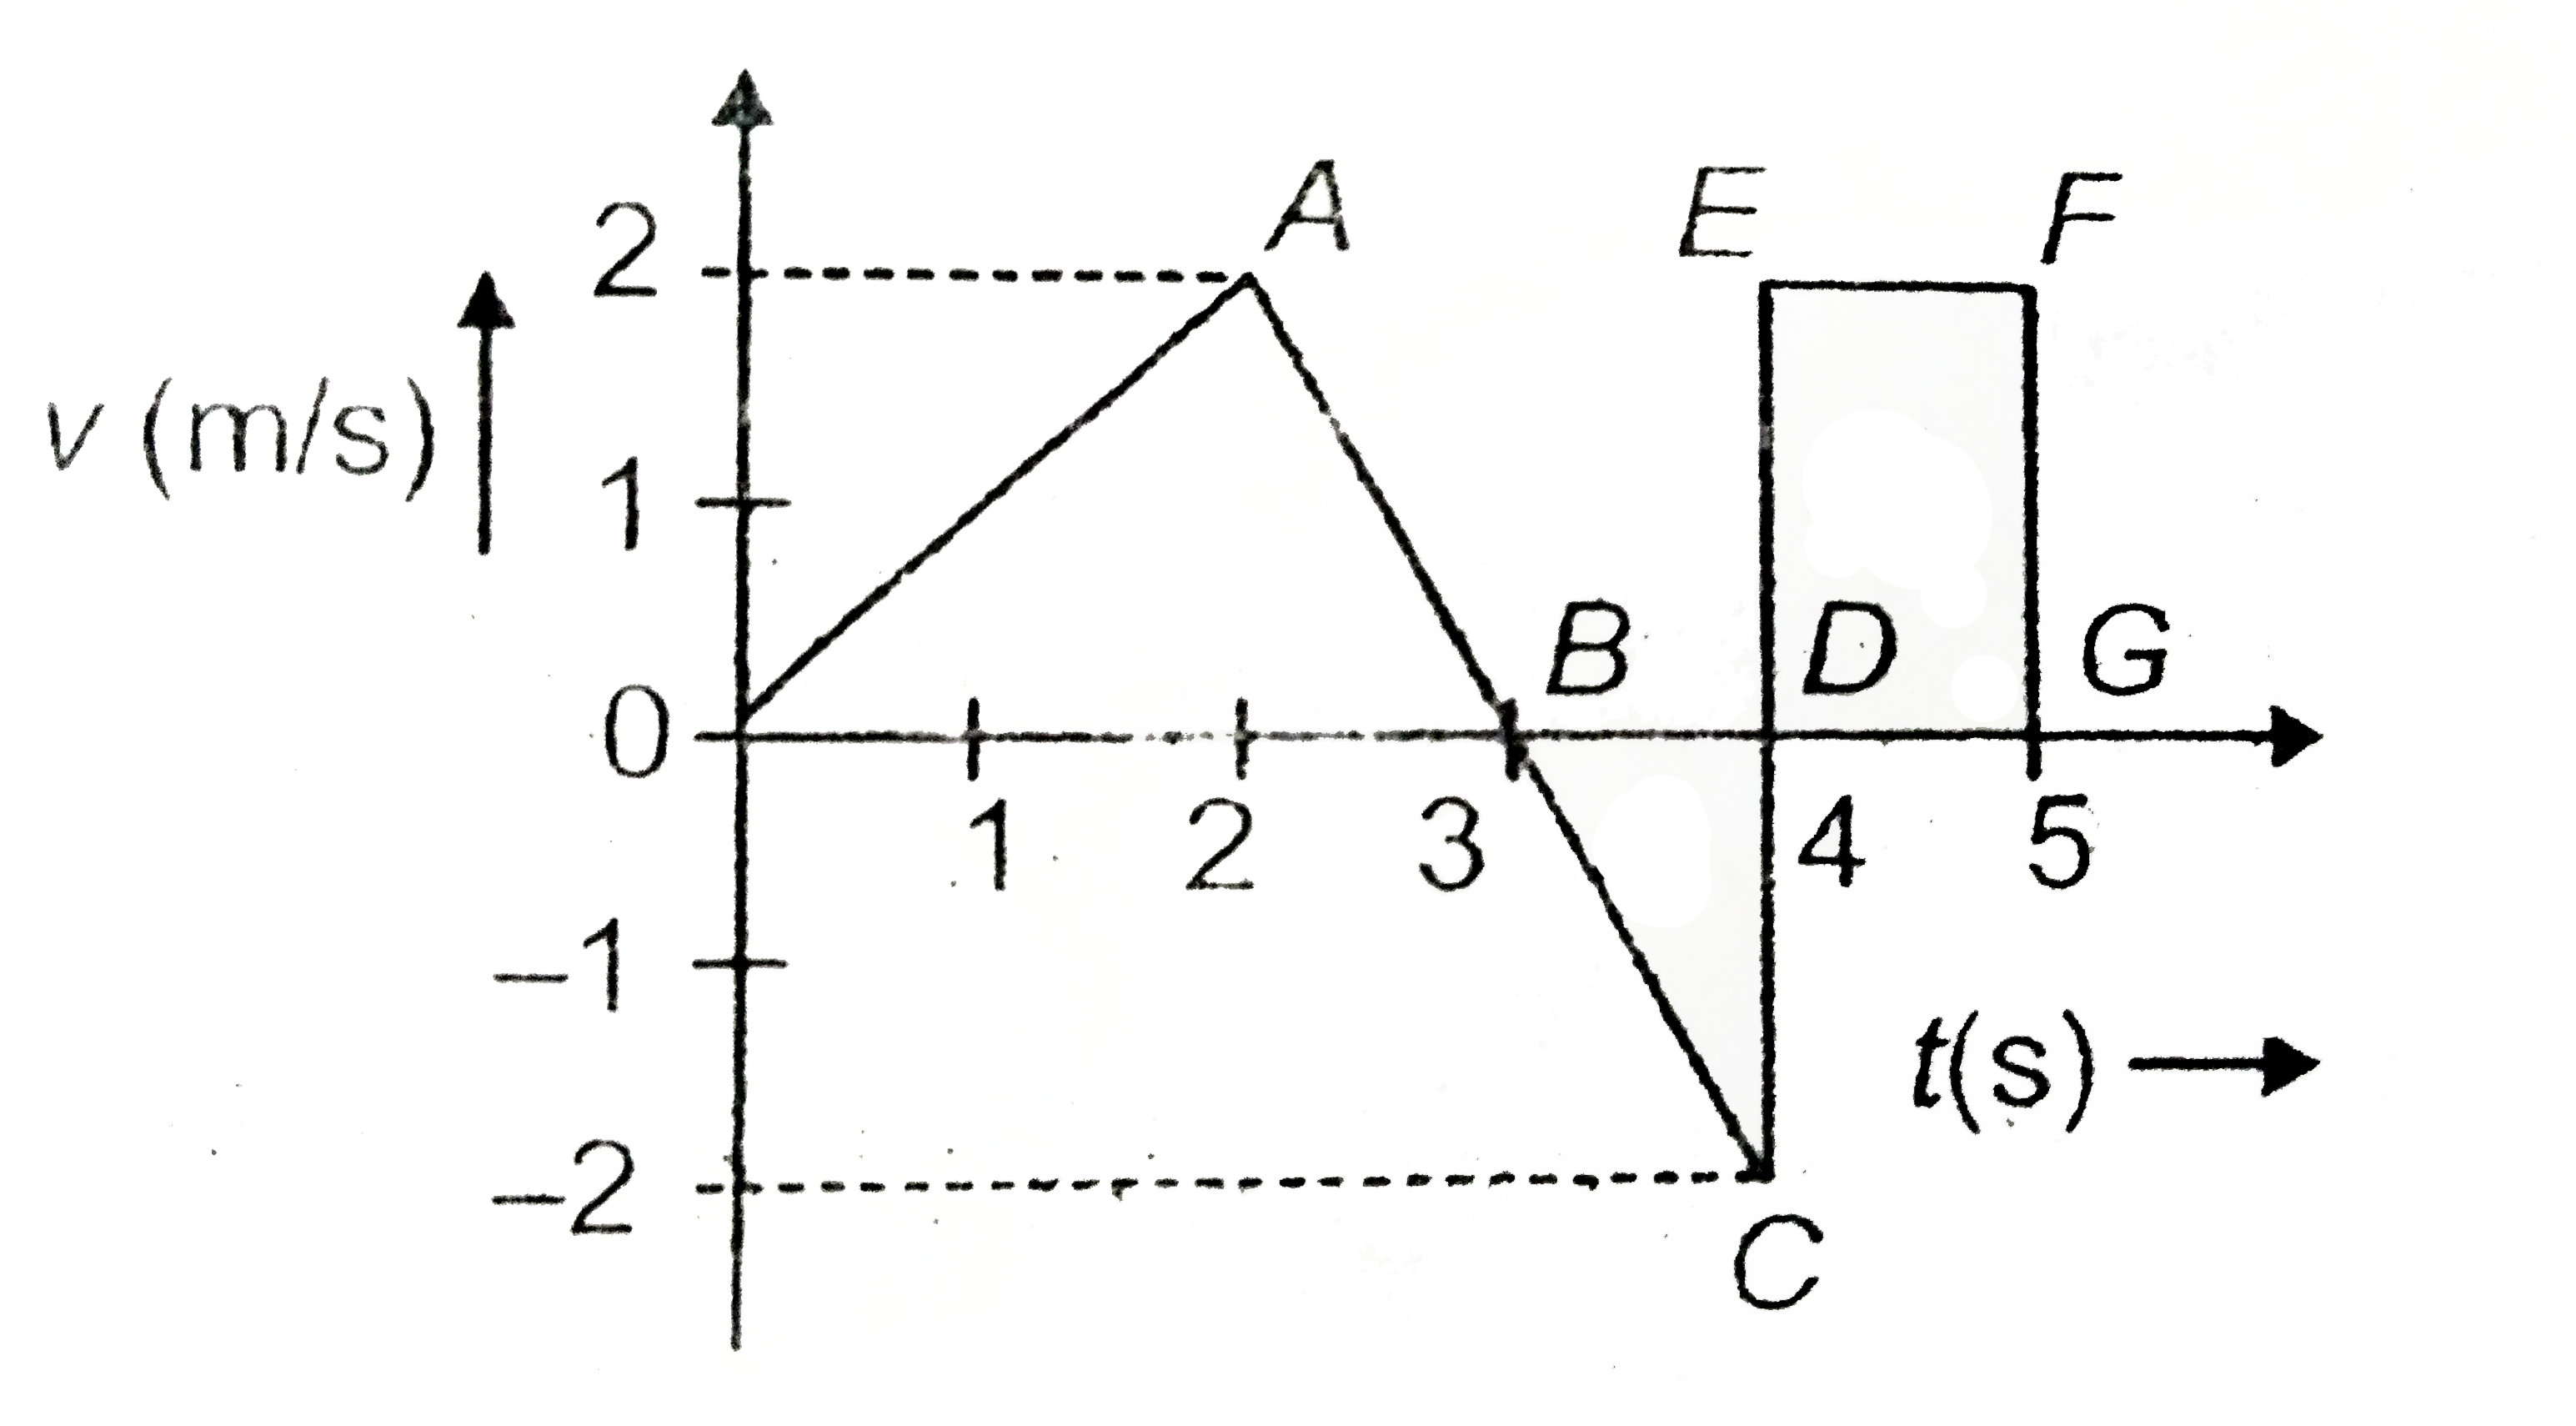
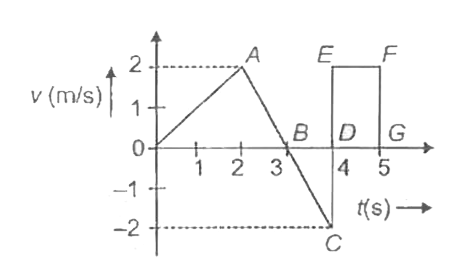
The displacement of the particle in 5 second is
0.5 m
1 m
2 m
4 m
View SolutionThe velocity - time graph of a particle moving along a straight line is shown in the figure given below
The displacement of the particle in 5 second is
View SolutionThe velocity-time graph of a particle moving in a straight line is shown in figure. The mass of the particle is 2kg. Work done by all the forces acting on the particle in time interval between t=0 to t=10s is
View SolutionThe variation of velocity of a particle moving along a straight line is shown in the figure. The distance travelled by the particle in 4s is

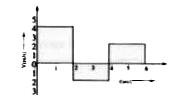
View SolutionThe velocity time graph of a body moving in a straight line is shown in the figure. The displacement and distance travelled by the body in 6 sec are respectively.
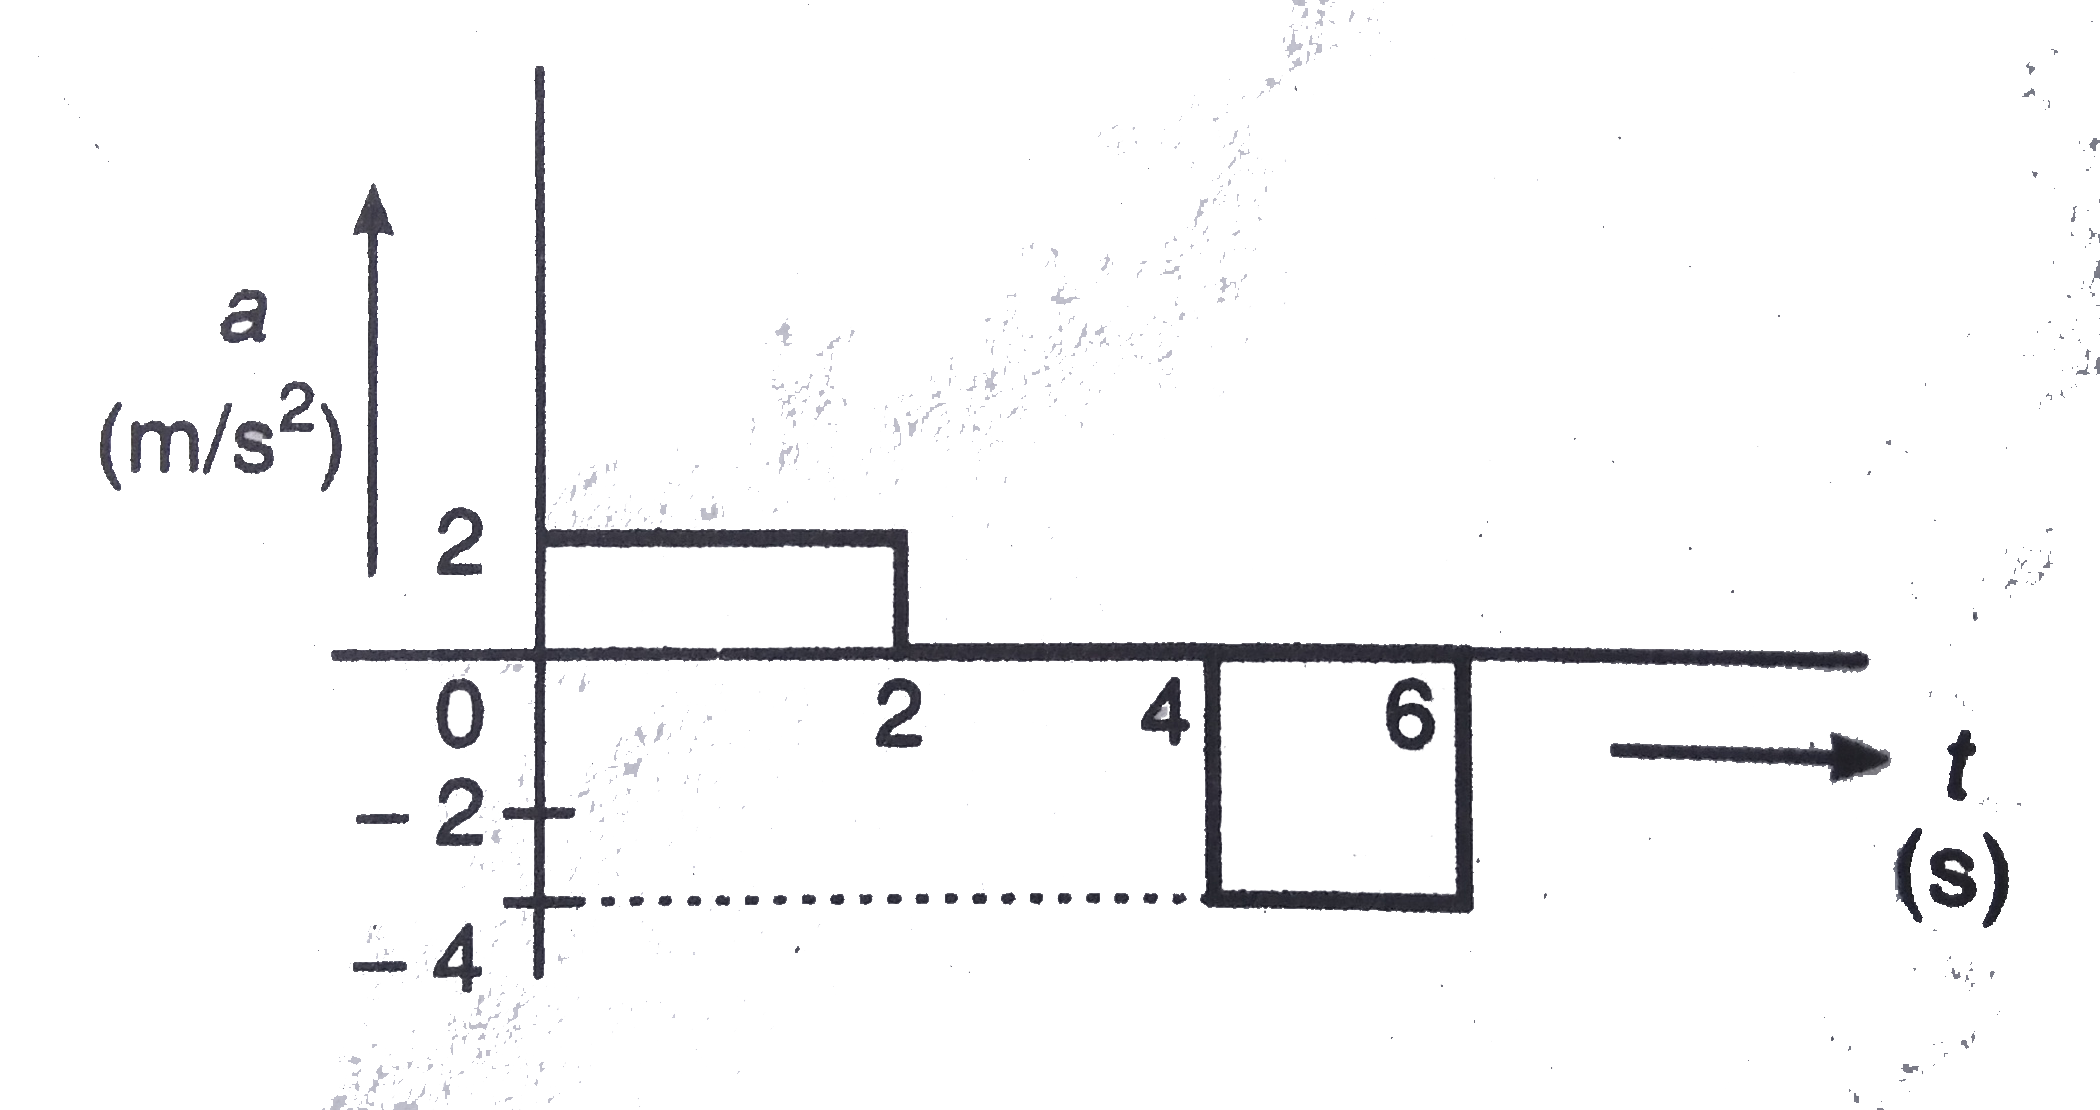
View SolutionThe acceleration versus time graph of a particle moving along a straight line is shown in the figure. Draw the respective velocity-time graph Given v=0 at t=0.
View SolutionThe velocity-time graph of a particle moving in a staight line is shown in the . Find the displacement and the distance trav elled by the particle in 6s.
 .
.
View Solution