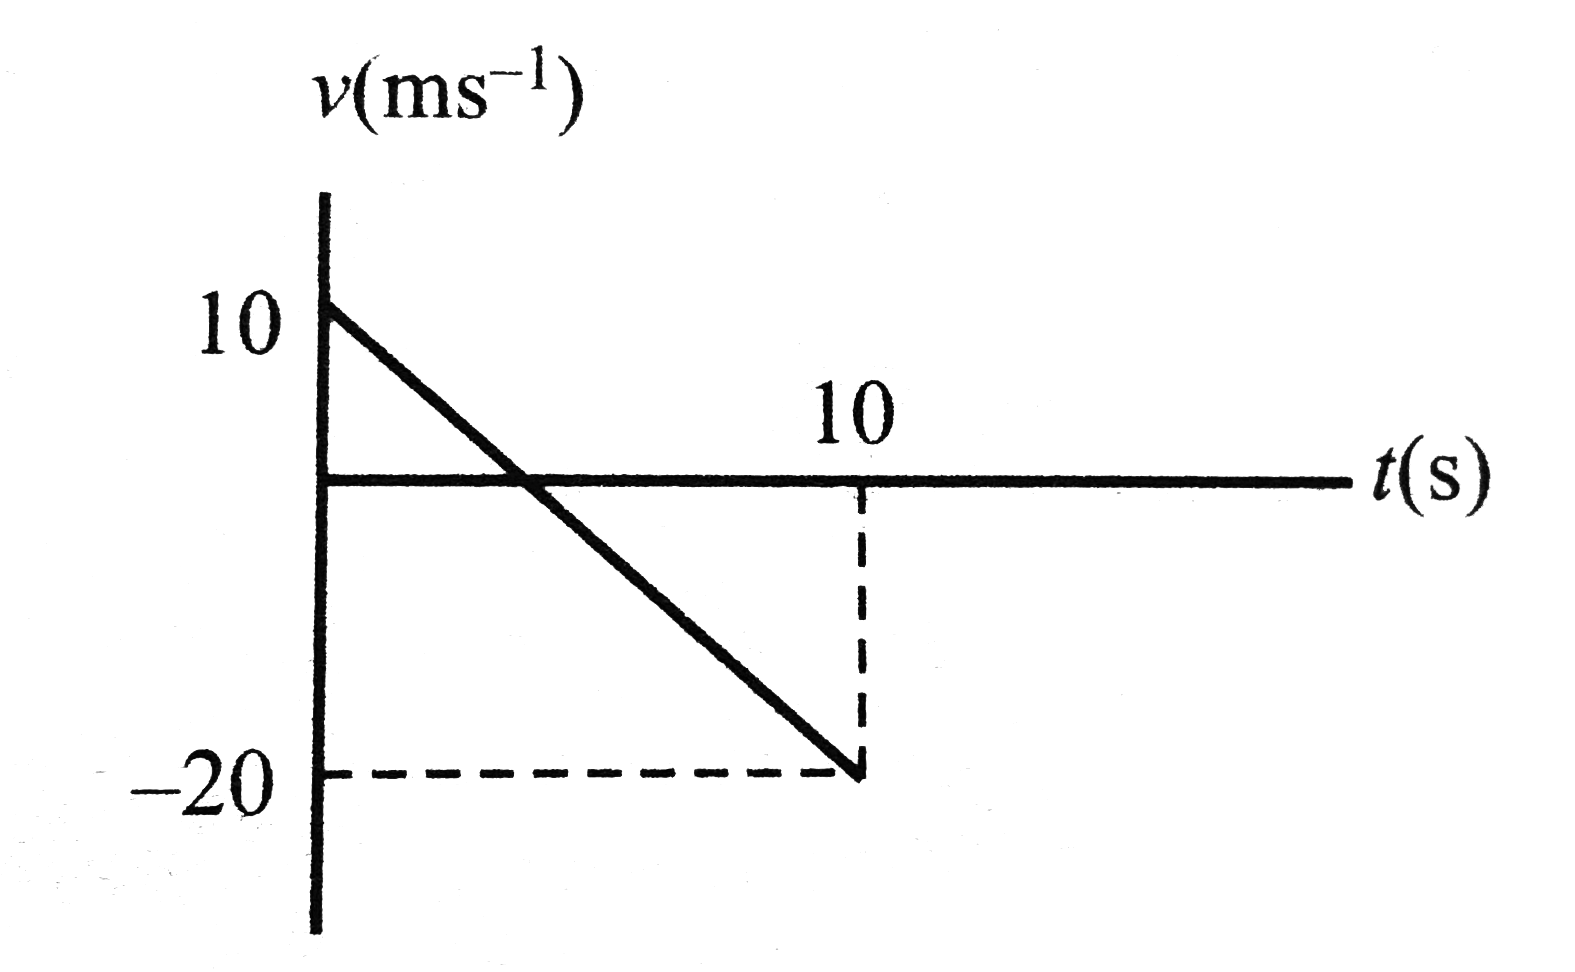
The velocity-time plot for a particle moving on a straight line is shown in figure. Choose correct options .
The particle has a constant acceleration
The particle has never turned around
The particle has zero displacement
The average speed in the interval 0 to 10 s is same as the average speed in the interval 10 s to 20 s
The correct Answer is:A, D
Since the graph is a straight line, its slope is constant. It means acceleration of the particle is constant.Velocity of the particle changes from positive to negative at t = 10 s, so particle changes direction at this timeThe particle has zero displacement up to 20 s, but not for the entire motion.The average speed in the interval of 0 to 10 s is the same as the average speed in the interval of 10 s to 20 s because distance covered in both time intervals is same.
Topper's Solved these Questions
- KINEMATICS OF A PARTICLE BOOK - VMC MODULES ENGLISHCHAPTER - KINEMATICS OF A PARTICLE EXERCISE - JEE MAIN (archive)
19 Videos
- KINEMATICS OF A PARTICLE BOOK - VMC MODULES ENGLISHCHAPTER - KINEMATICS OF A PARTICLE EXERCISE - JEE Advanced (archive)
14 Videos
- KINEMATICS OF A PARTICLE BOOK - VMC MODULES ENGLISHCHAPTER - KINEMATICS OF A PARTICLE EXERCISE - LEVEL 1
75 Videos
- JEE MAIN REVISON TEST-23BOOK - VMC MODULES ENGLISHCHAPTER - JEE MAIN REVISON TEST-23EXERCISE - PHYSICS (SECTION 2)
1 Videos
- LAWS OF MOTION BOOK - VMC MODULES ENGLISHCHAPTER - LAWS OF MOTION EXERCISE - IMPECCABLE
53 Videos
Similar Questions
The velocity time plot for a particle moving on straight line is shown in the figure.

View SolutionThe velocity time plot for a particle moving on straight line is shown in the figure.

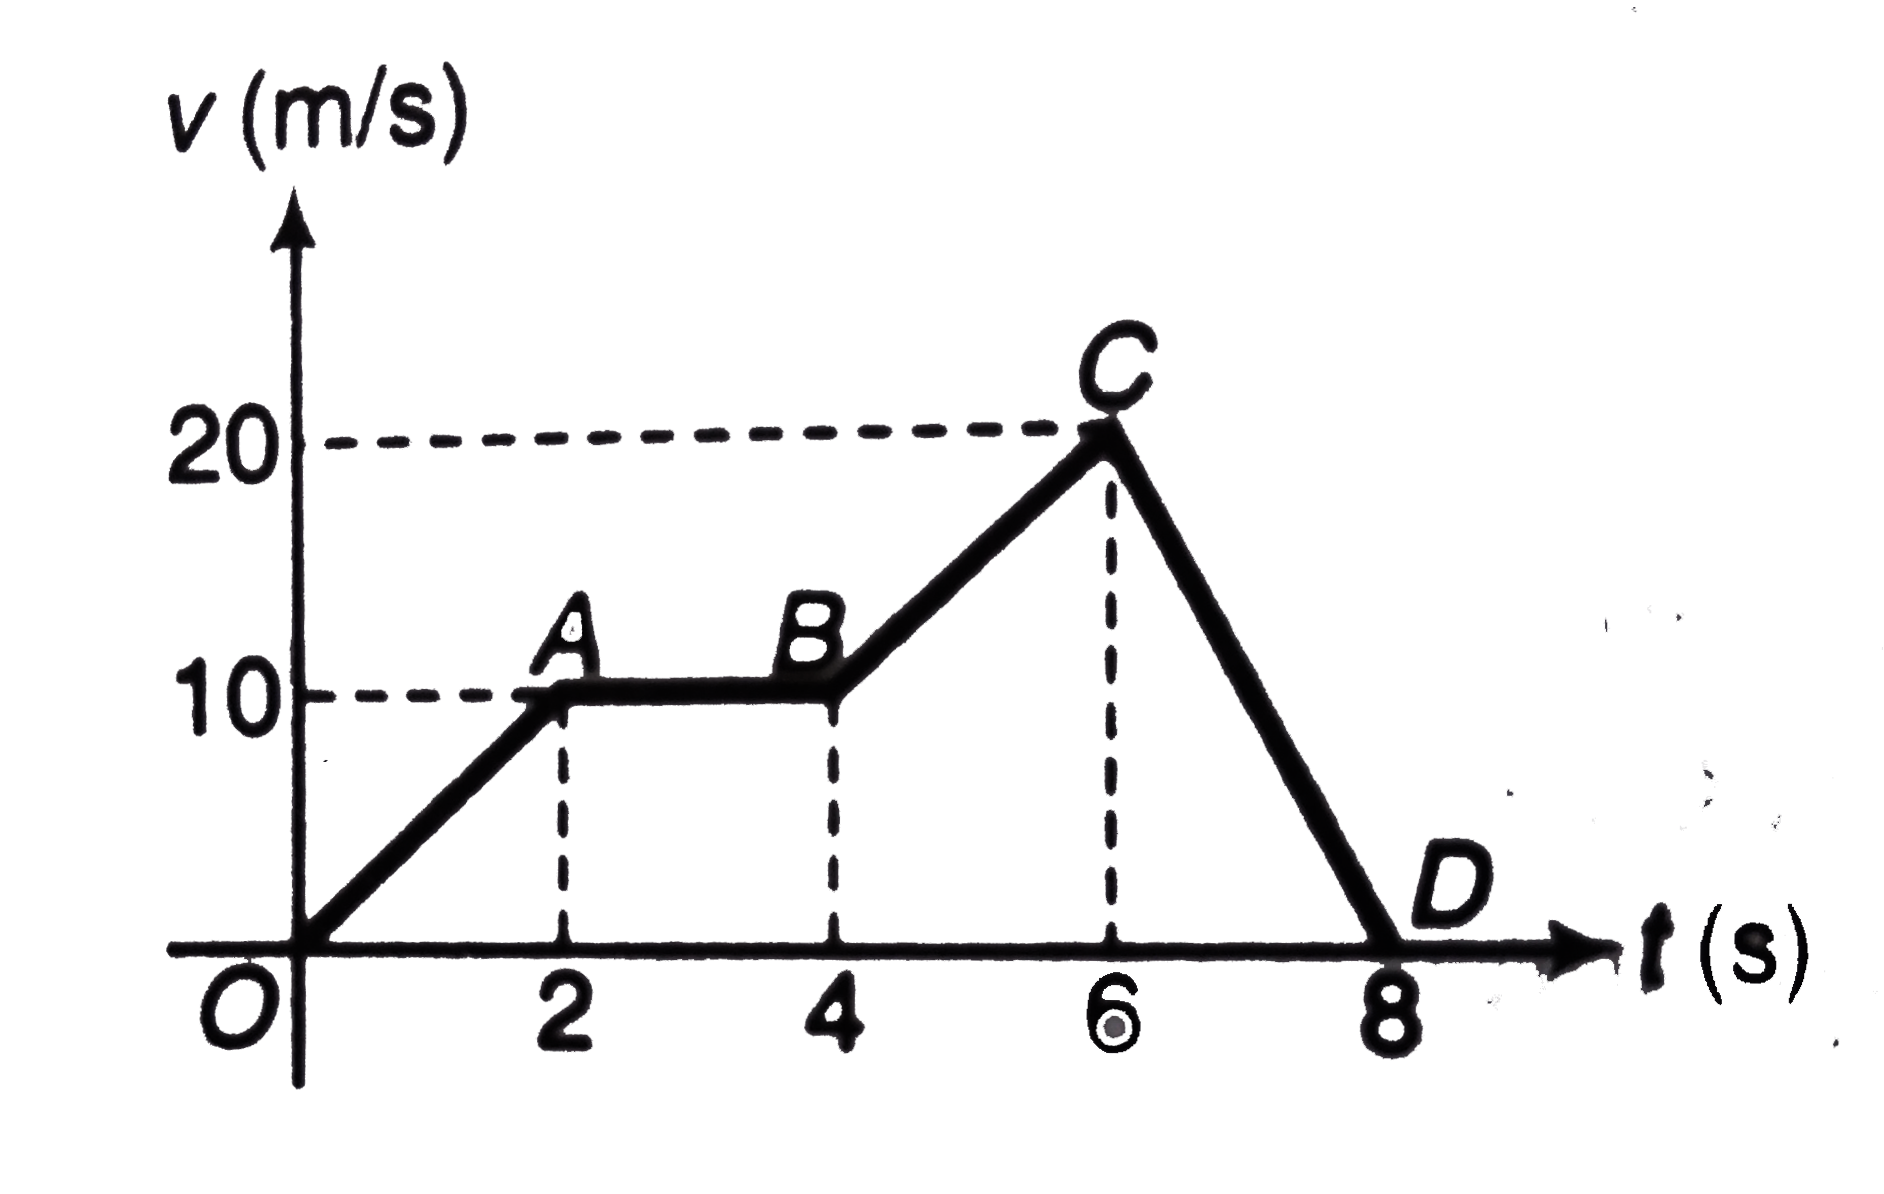
View SolutionThe velocity-time graph of a particle moving in a straight line is shown in figure. The mass of the particle is 2kg. Work done by all the forces acting on the particle in time interval between t=0 to t=10s is

View SolutionDisplacement time graph of a particle moving in a straight line is a shown in figure.

View SolutionVelocity displacement graph of a particle moving in a straight line is as shown in figure.

View SolutionVelocity-time graph of a particle moving in a straight line is shown in figure. Plot the corresponding displacement-time graph of the particle if at time t=0, displacement s=0.

View SolutionVelocity-time graph of a particle moving in a straight line is shown in figure. Plot the corresponding displacement-time graph of the particle if at time t=0, displacement s=0.

View SolutionThe variation of velocity of a particle moving along a straight line is shown in . is
 .
.
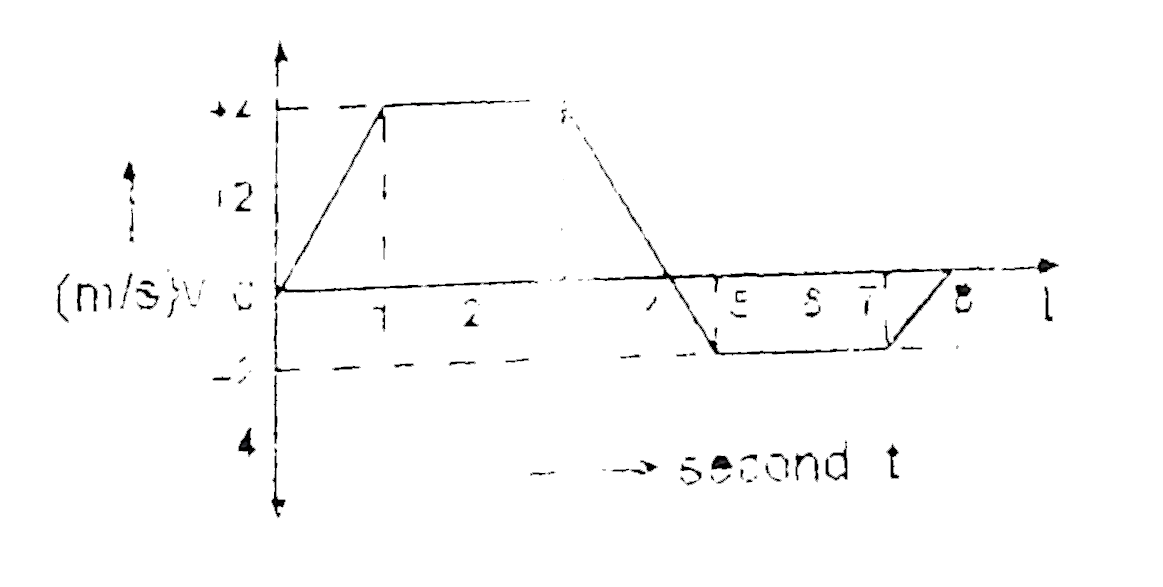
View SolutionThe velocity time graph of a particle moving along a straight line is shown in the figure. In the time interval from t=0 to t=8 second, answer the following three question.

The distance travelled by the particle is :
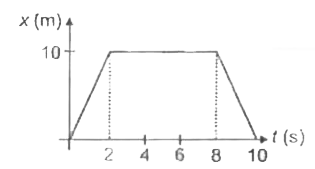
View SolutionThe position - time graph for a particle moving along a straight line is shown in figure. The total distance travelled by it in time t = 0 to t = 10 s is

View Solution
