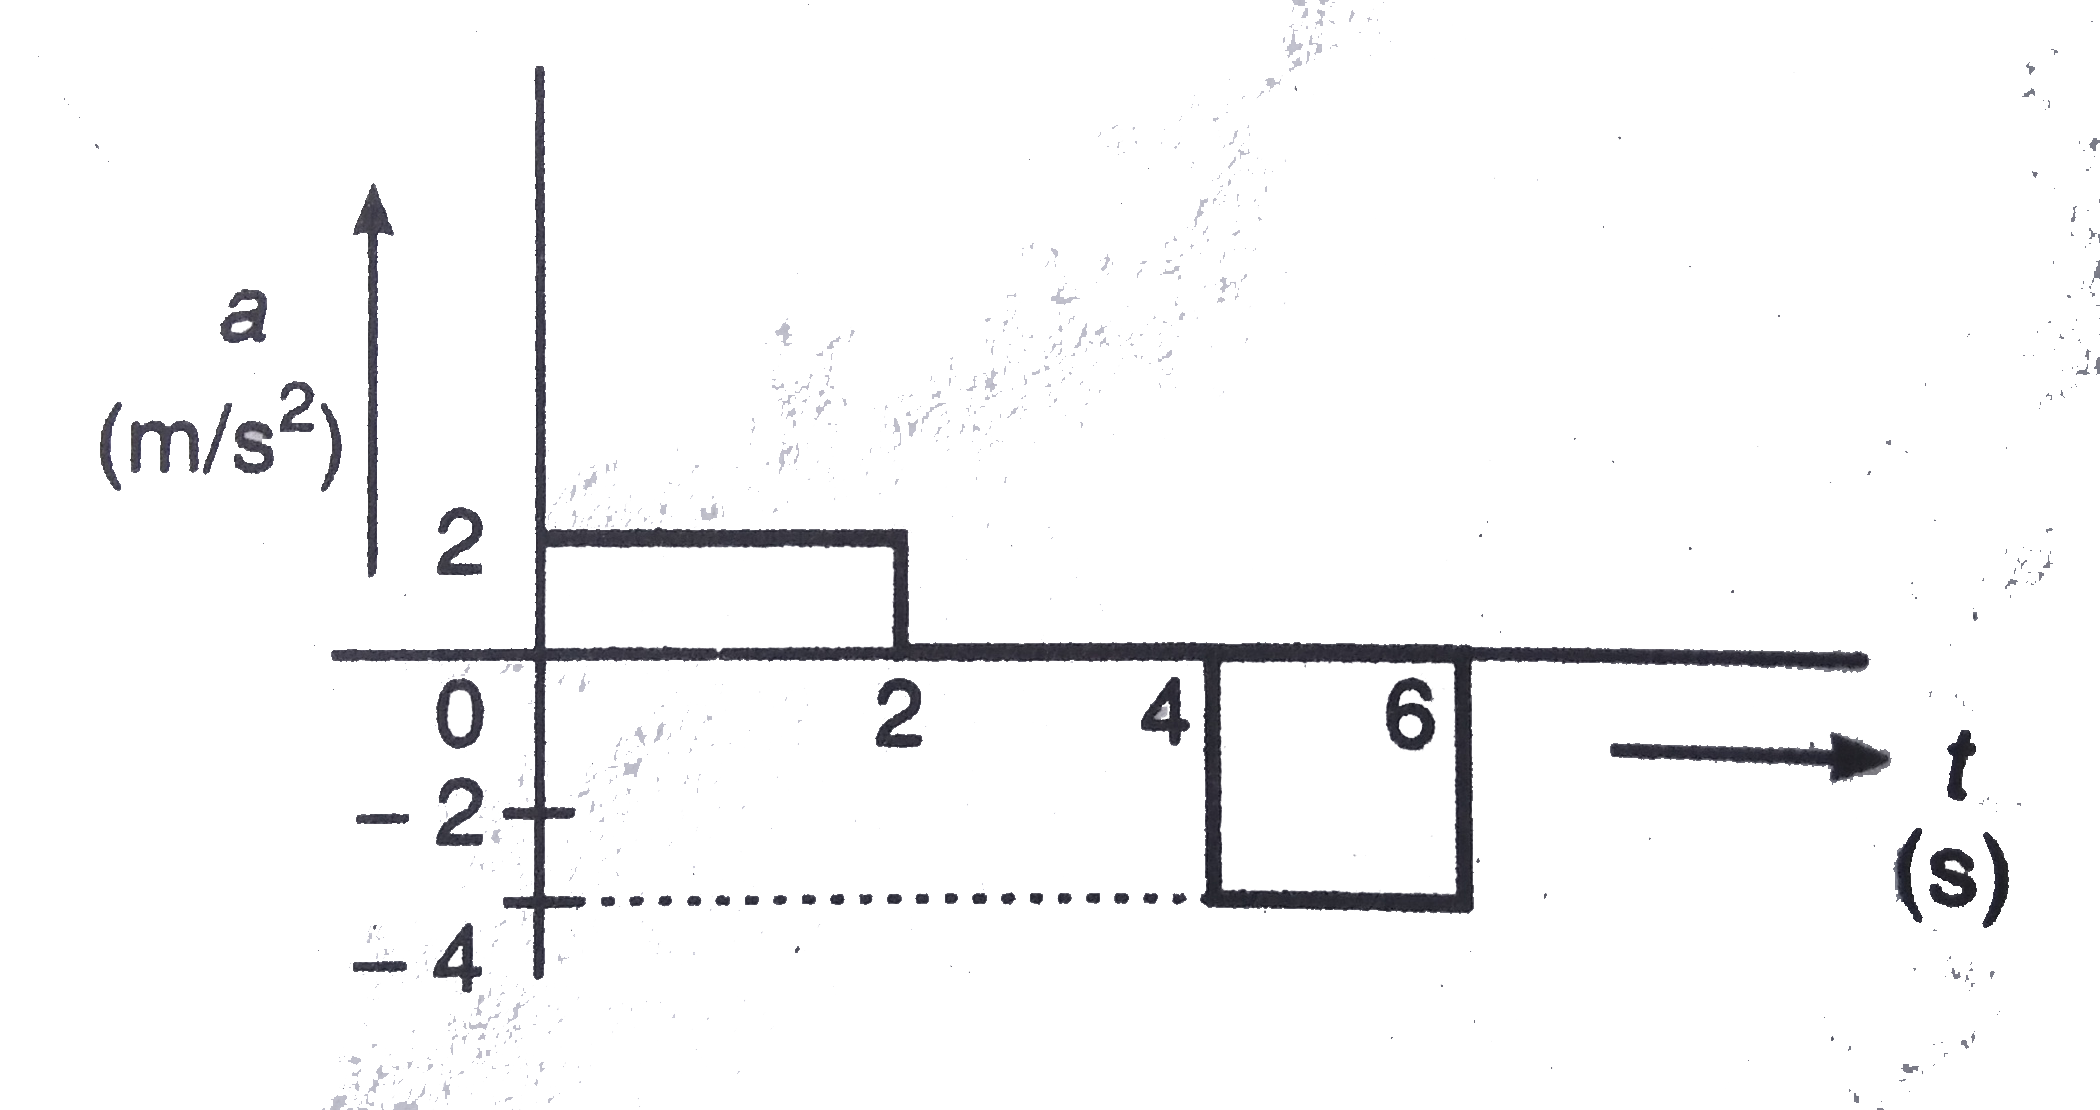
The acceleration versus time graph of a particle moving along a straight line is shown in the figure. Draw the respective velocity-time graph Given v=0 at t=0.
The correct Answer is:A
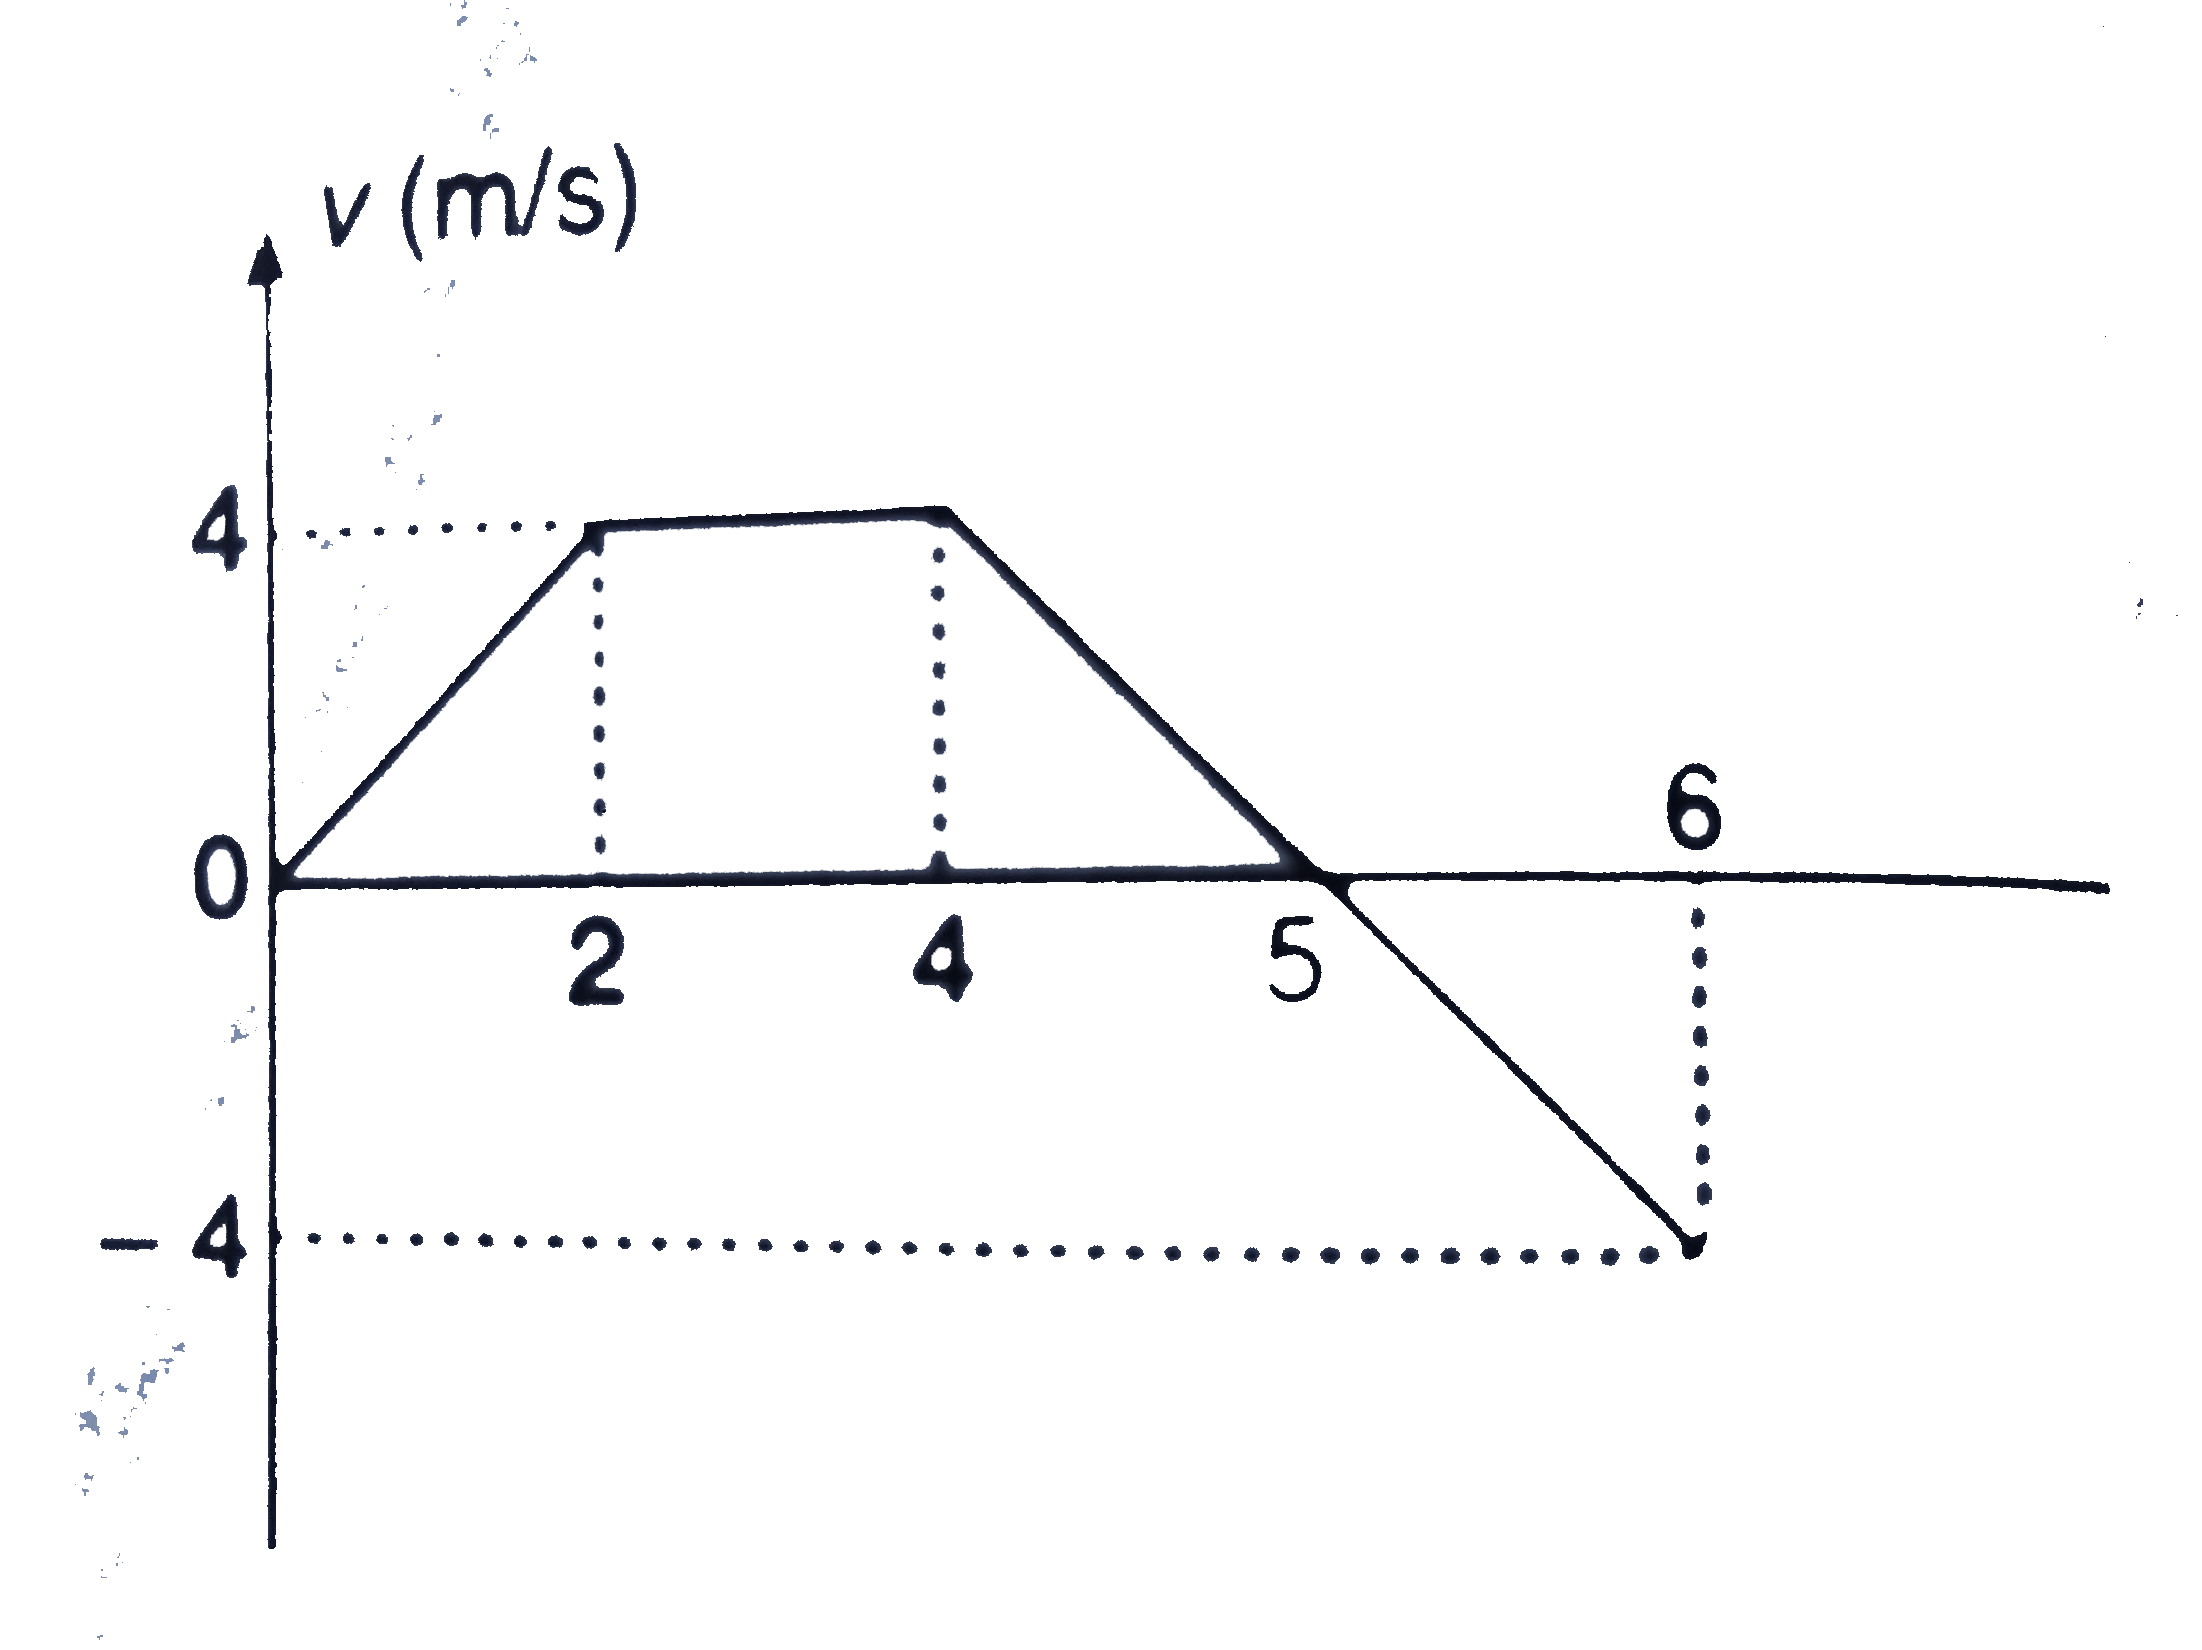
From t=0 to t=2s,a=+2m/s2
∴v=at=2t
or v-t graph is a straight line passing through origin
with slope 2m/s2.
At the end of 2s,
v=2×2=4m/s
from t=2→4s,a=0.
Hence, v=4m/s will remain constant.
From t=4 to 6s,a=−4ms2.
Hence, v=u−at=4−4t (with t=0 at4s.)
v=0 at t=1s or at 5s from origin.
At the end of 6s( ort=2s)v=−4m/s.
Corresponding v-t graph is as shown in fig
Topper's Solved these Questions
- BOOK - DC PANDEY ENGLISHCHAPTER - KINEMATICSEXERCISE - Example Type 11videos
KINEMATICS
- BOOK - DC PANDEY ENGLISHCHAPTER - KINEMATICSEXERCISE - Example Type 21videos
KINEMATICS
- BOOK - DC PANDEY ENGLISHCHAPTER - GRAVITATIONEXERCISE - (C) Chapter Exercises45videos
GRAVITATION
- BOOK - DC PANDEY ENGLISHCHAPTER - KINEMATICS 1EXERCISE - INTEGER_TYPE15videos
KINEMATICS 1
Similar Questions
Displacement time graph of a particle moving in a straight line is a shown in figure.
 View Solution
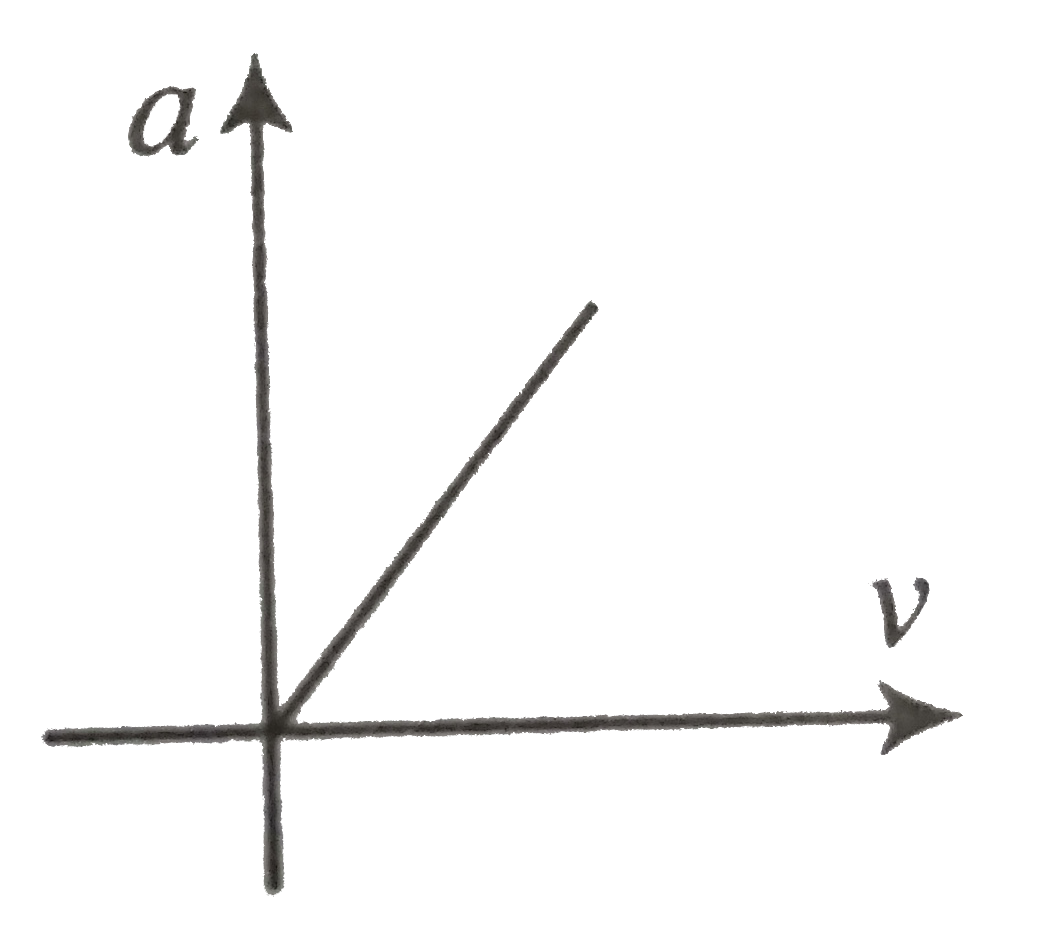
The acceleration - velocity graph of a particle moving in a straight line is shown in figure. Then the slope of the velocity- displacement graph
 View Solution
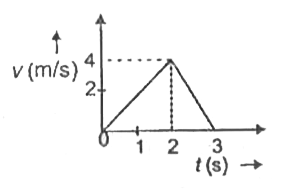
The velocity versus time graph of a body moving in a straight line is as shown in the figure below
 View Solution
Velocity displacement graph of a particle moving in a straight line is as shown in figure.
 View Solution
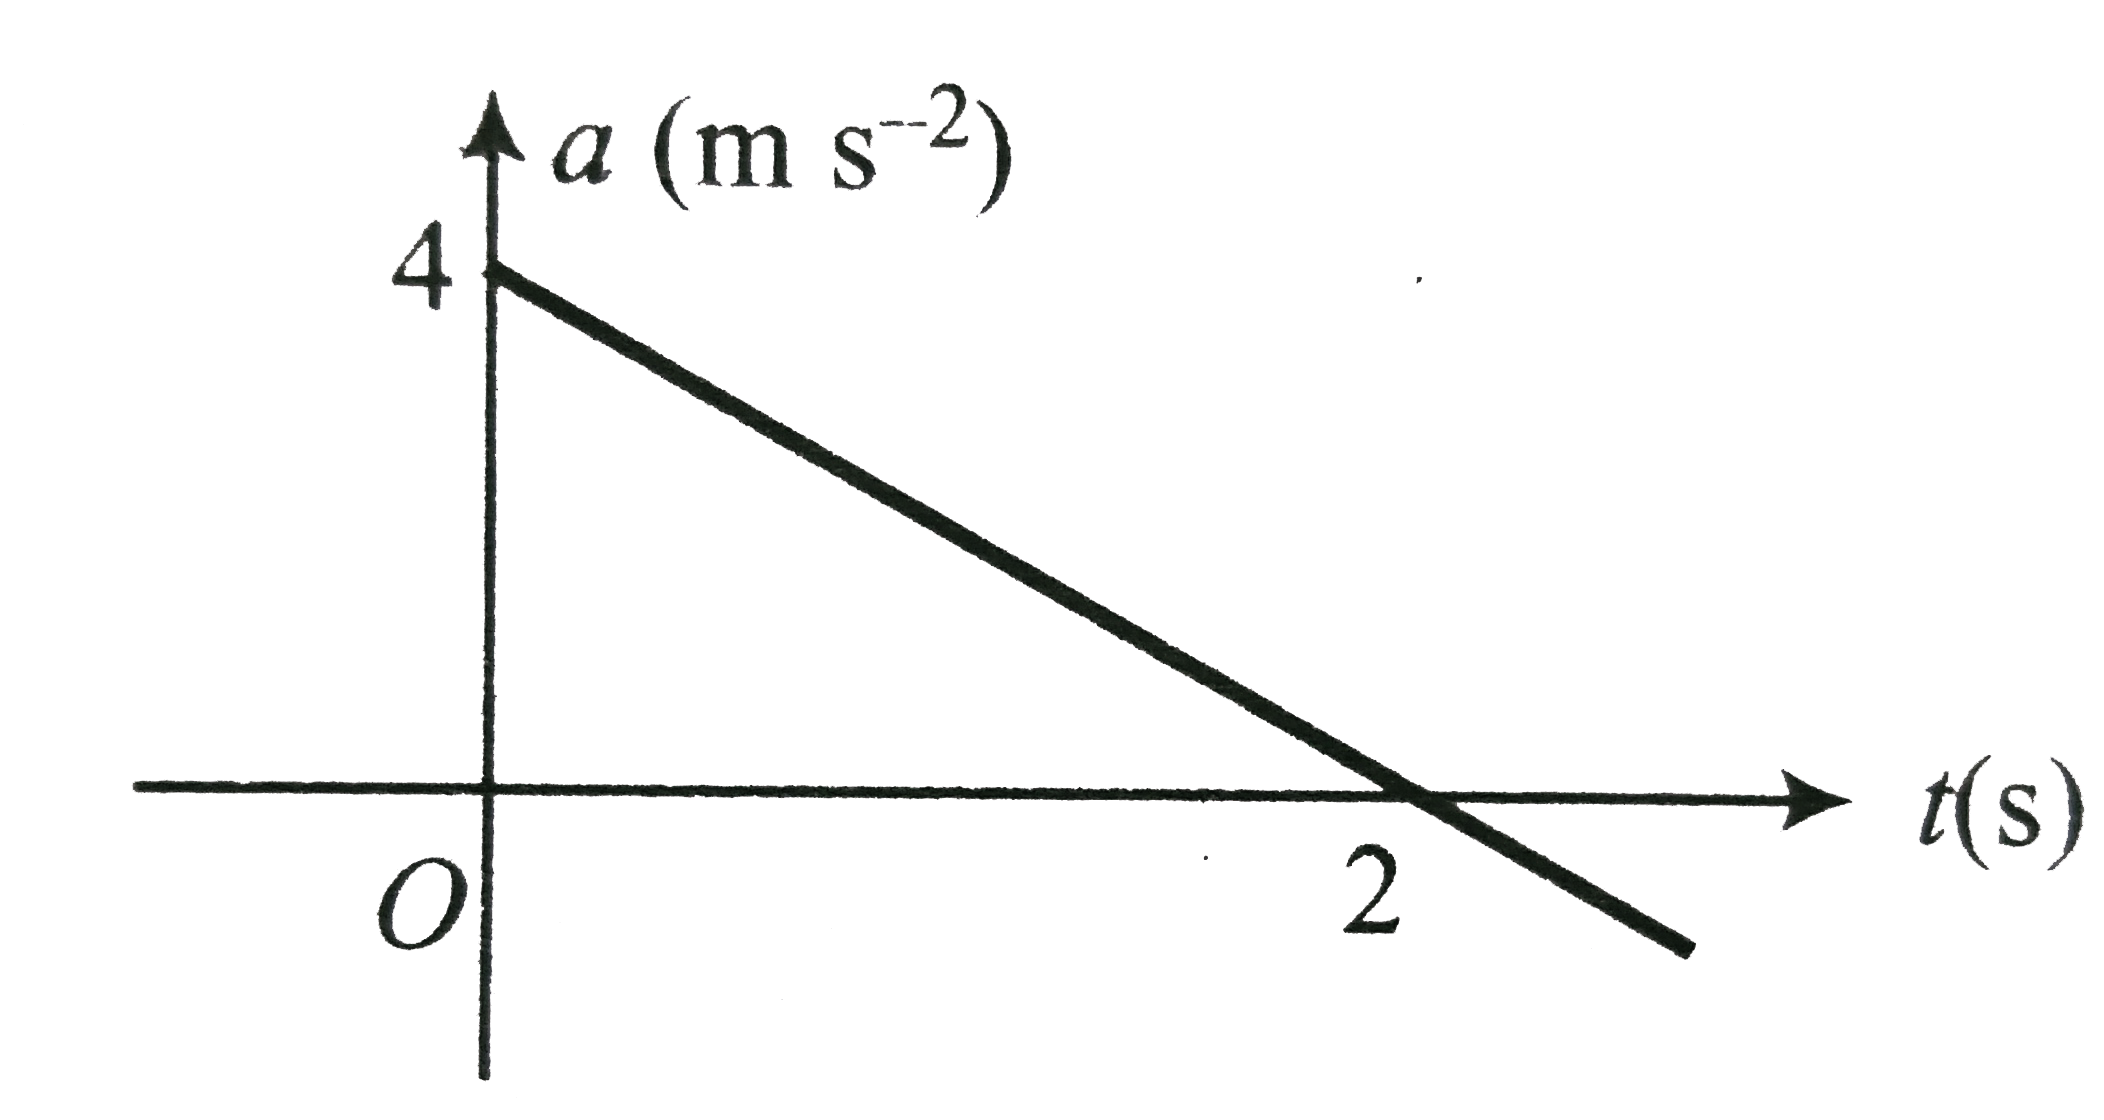
The acceleration versus time graph of a particle moving in a straight line is show in. The velocity-time graph of the particle would be
 .View Solution
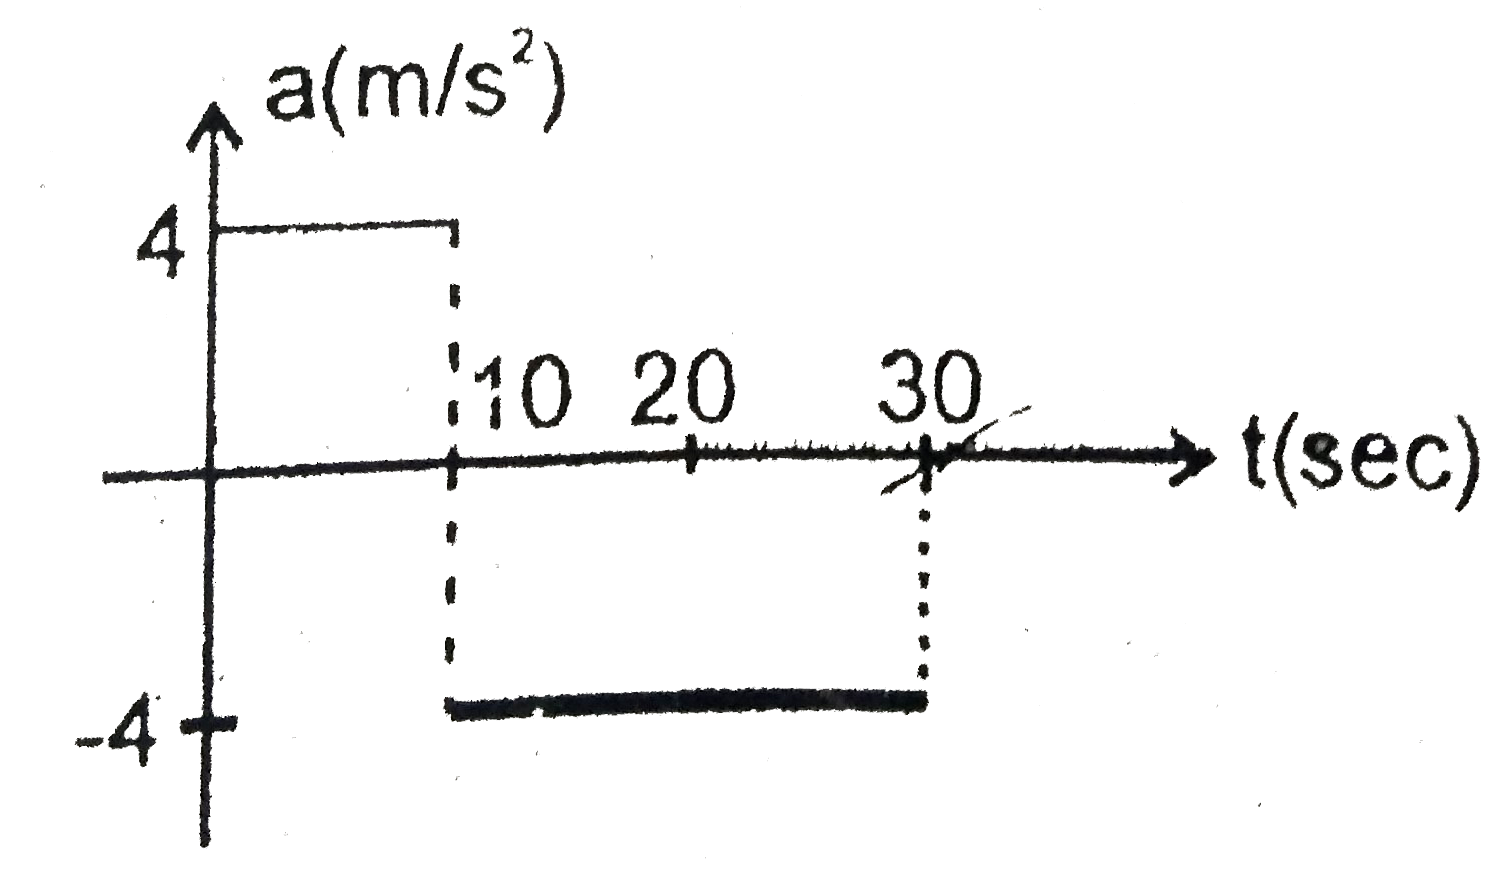
The acceleration versus time graph for a particle moving along a straight line is shown in the figure. If the particle starts from rest at t = 0, then its speed at t = 30 sec will be :
 View Solution
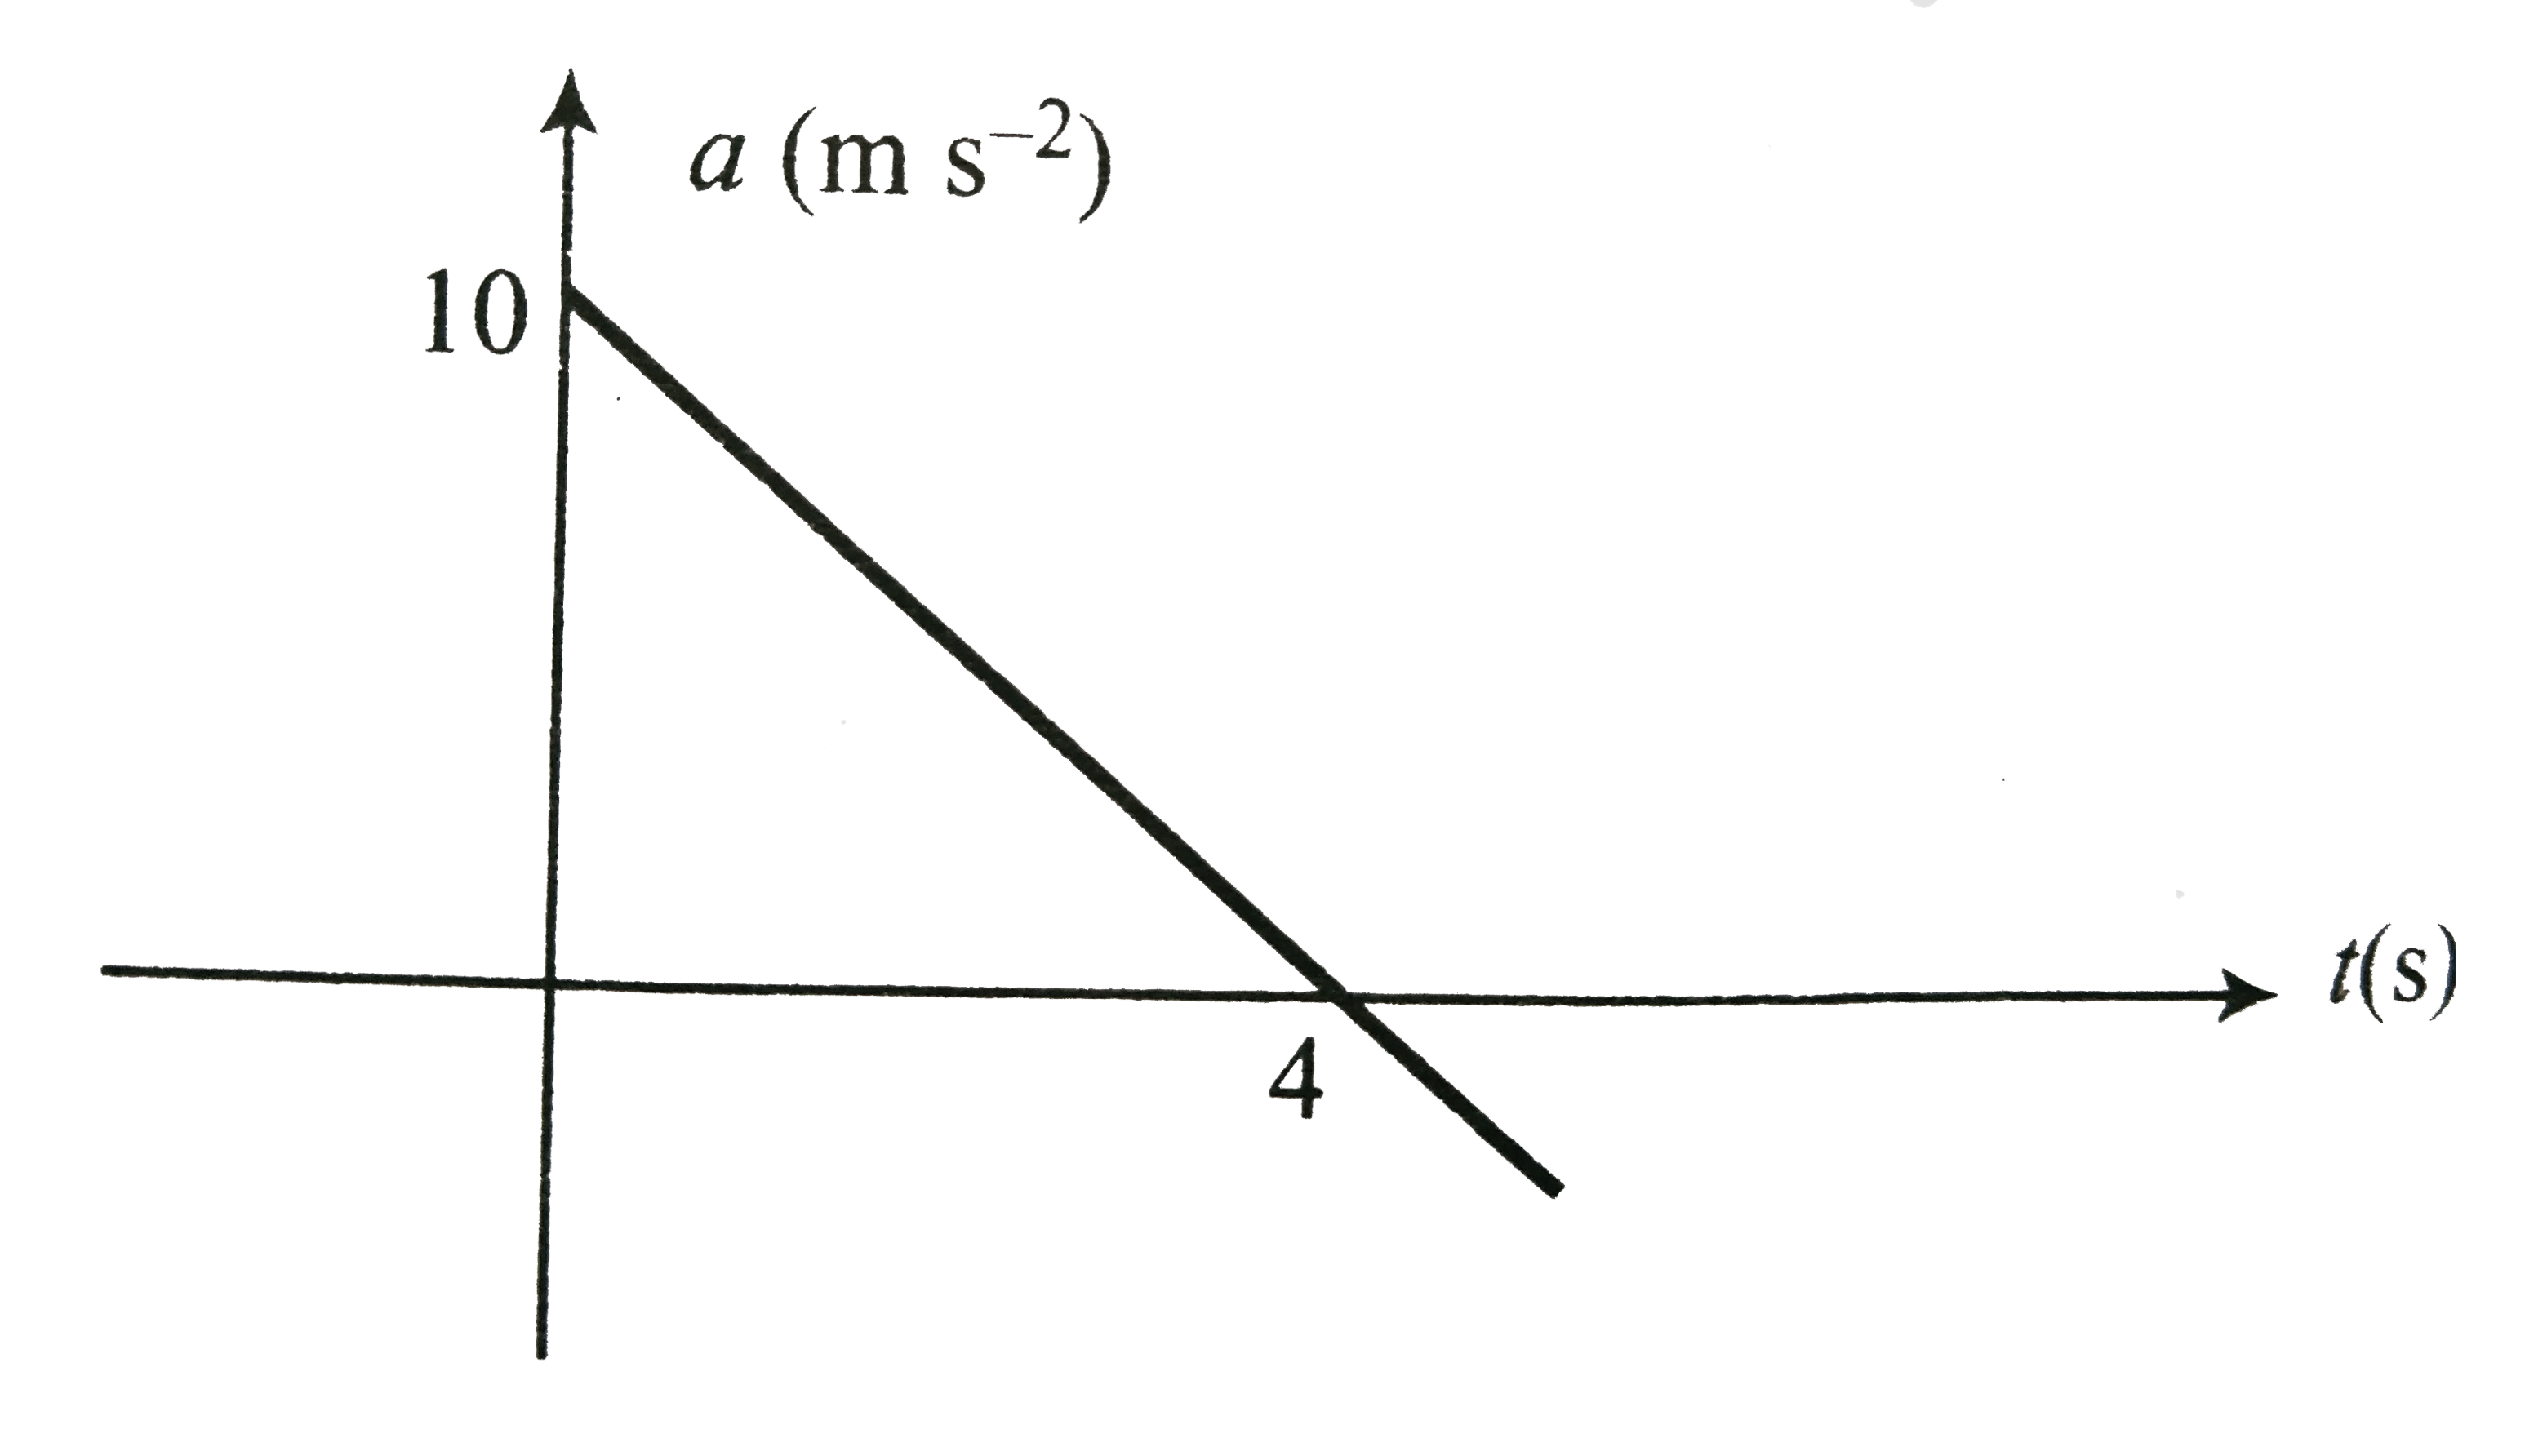
The acceleration-time graph of a particle moving along a straight line is as shown in. At what time the particle acquires its initial velocity?
 .View Solution
The acceleration-time graph of a particle moving along a straight line is as shown in. At what time the particle acquires its initial velocity?
 .View Solution
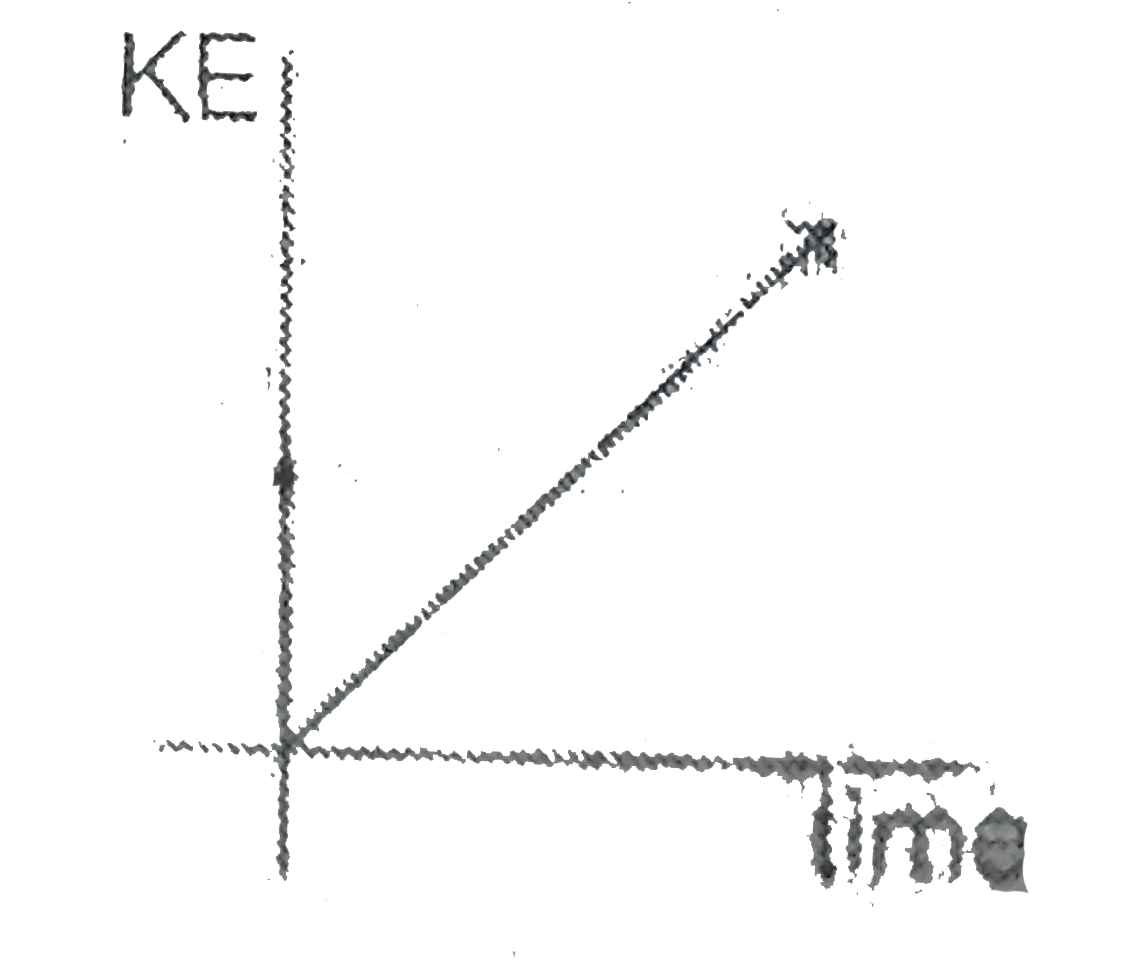
The kinetic energy (KE) versus time graph for a particle moving along a straight line is as shown in the figure. The force versus time graph for the particle may be
 View Solution
The x-t graph of a particle moving along a straight line is shown in figure

The v-t graph of the particle is correctly shown byView Solution
