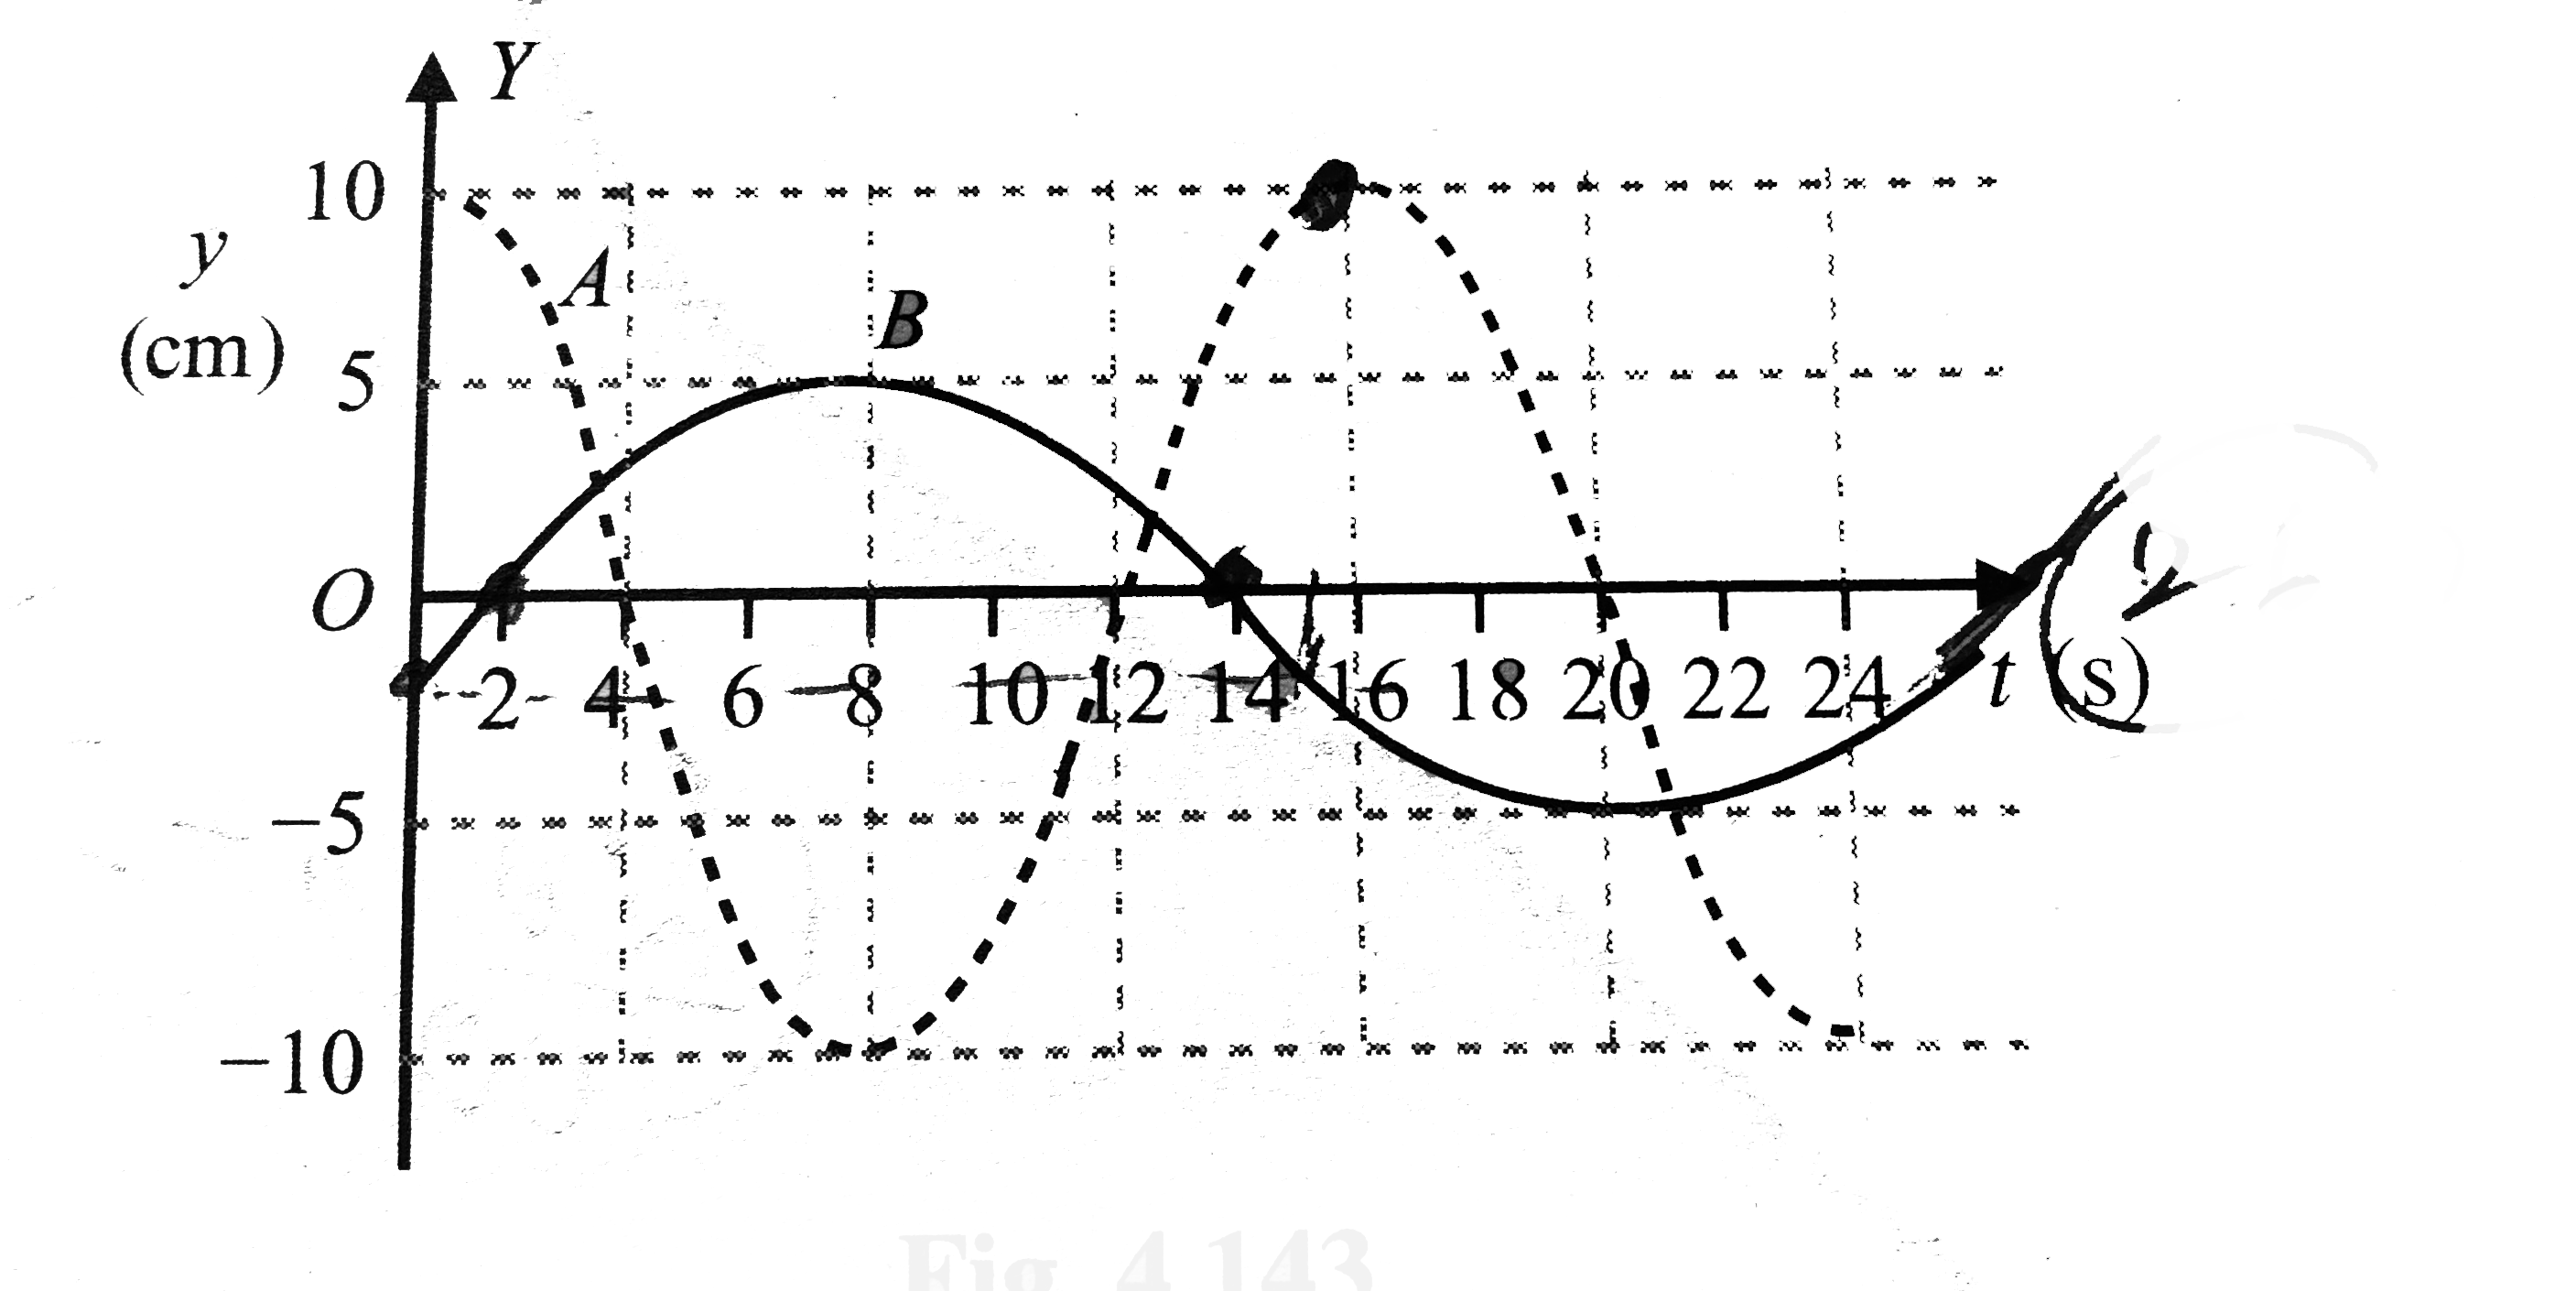
The following figure shows the displacement versus time graph for two particles A and B executing simple harmonic motions. The ratio of their maximum velocities is
3:1
1:3
1:9
9:1
The correct Answer is:A
For, A time period TA=16s (distance between two adjacent crest)
For B, time period TB=2(20−8)=24s (length between the creast and trough shown=20s−8s=12s)
Also, amplitudes aA=10cm,aB=5cm
Now, (Vmax)A(Vmin)B=ωAaAωBaB
=(2πTA)aA(2πTB)aB=TBaATAaB=24×1016×5=31
Topper's Solved these Questions
- LINEAR AND ANGULAR SIMPLE HARMONIC MOTIONBook:CENGAGE PHYSICS ENGLISHChapter:LINEAR AND ANGULAR SIMPLE HARMONIC MOTIONExercise:Multiple Correct
Explore 35 Videos
- LINEAR AND ANGULAR SIMPLE HARMONIC MOTIONBook:CENGAGE PHYSICS ENGLISHChapter:LINEAR AND ANGULAR SIMPLE HARMONIC MOTIONExercise:Assertion Reasoning
Explore 6 Videos
- LINEAR AND ANGULAR SIMPLE HARMONIC MOTIONBook:CENGAGE PHYSICS ENGLISHChapter:LINEAR AND ANGULAR SIMPLE HARMONIC MOTIONExercise:Subjective
Explore 21 Videos
- KINETIC THEORY OF GASES AND FIRST LAW OF THERMODYNAMICSBook:CENGAGE PHYSICS ENGLISHChapter:KINETIC THEORY OF GASES AND FIRST LAW OF THERMODYNAMICSExercise:Interger
Explore 11 Videos
- MISCELLANEOUS KINEMATICSBook:CENGAGE PHYSICS ENGLISHChapter:MISCELLANEOUS KINEMATICSExercise:Interger type
Explore 3 Videos
Similar Questions
Knowledge Check
A particle is executing simple harmonic motion. Its total energy is proportional to its
Adisplacement from equilibrium positionBfrequency of oscillationCsquare of amplitude of motionDvelocity at equilibrium position
For a particle executing simple harmonic motion, the acceleration is proportional to
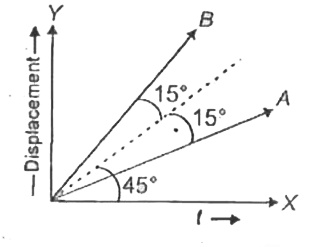
View SolutionThe displacement - time graph for two particles A and B is as follows. The ratio vAvB is

View SolutionThe displacement-time graphs of two particles P and Q are as shown in the figure. The ratio of their velocities VP and VQ will be

View Solution
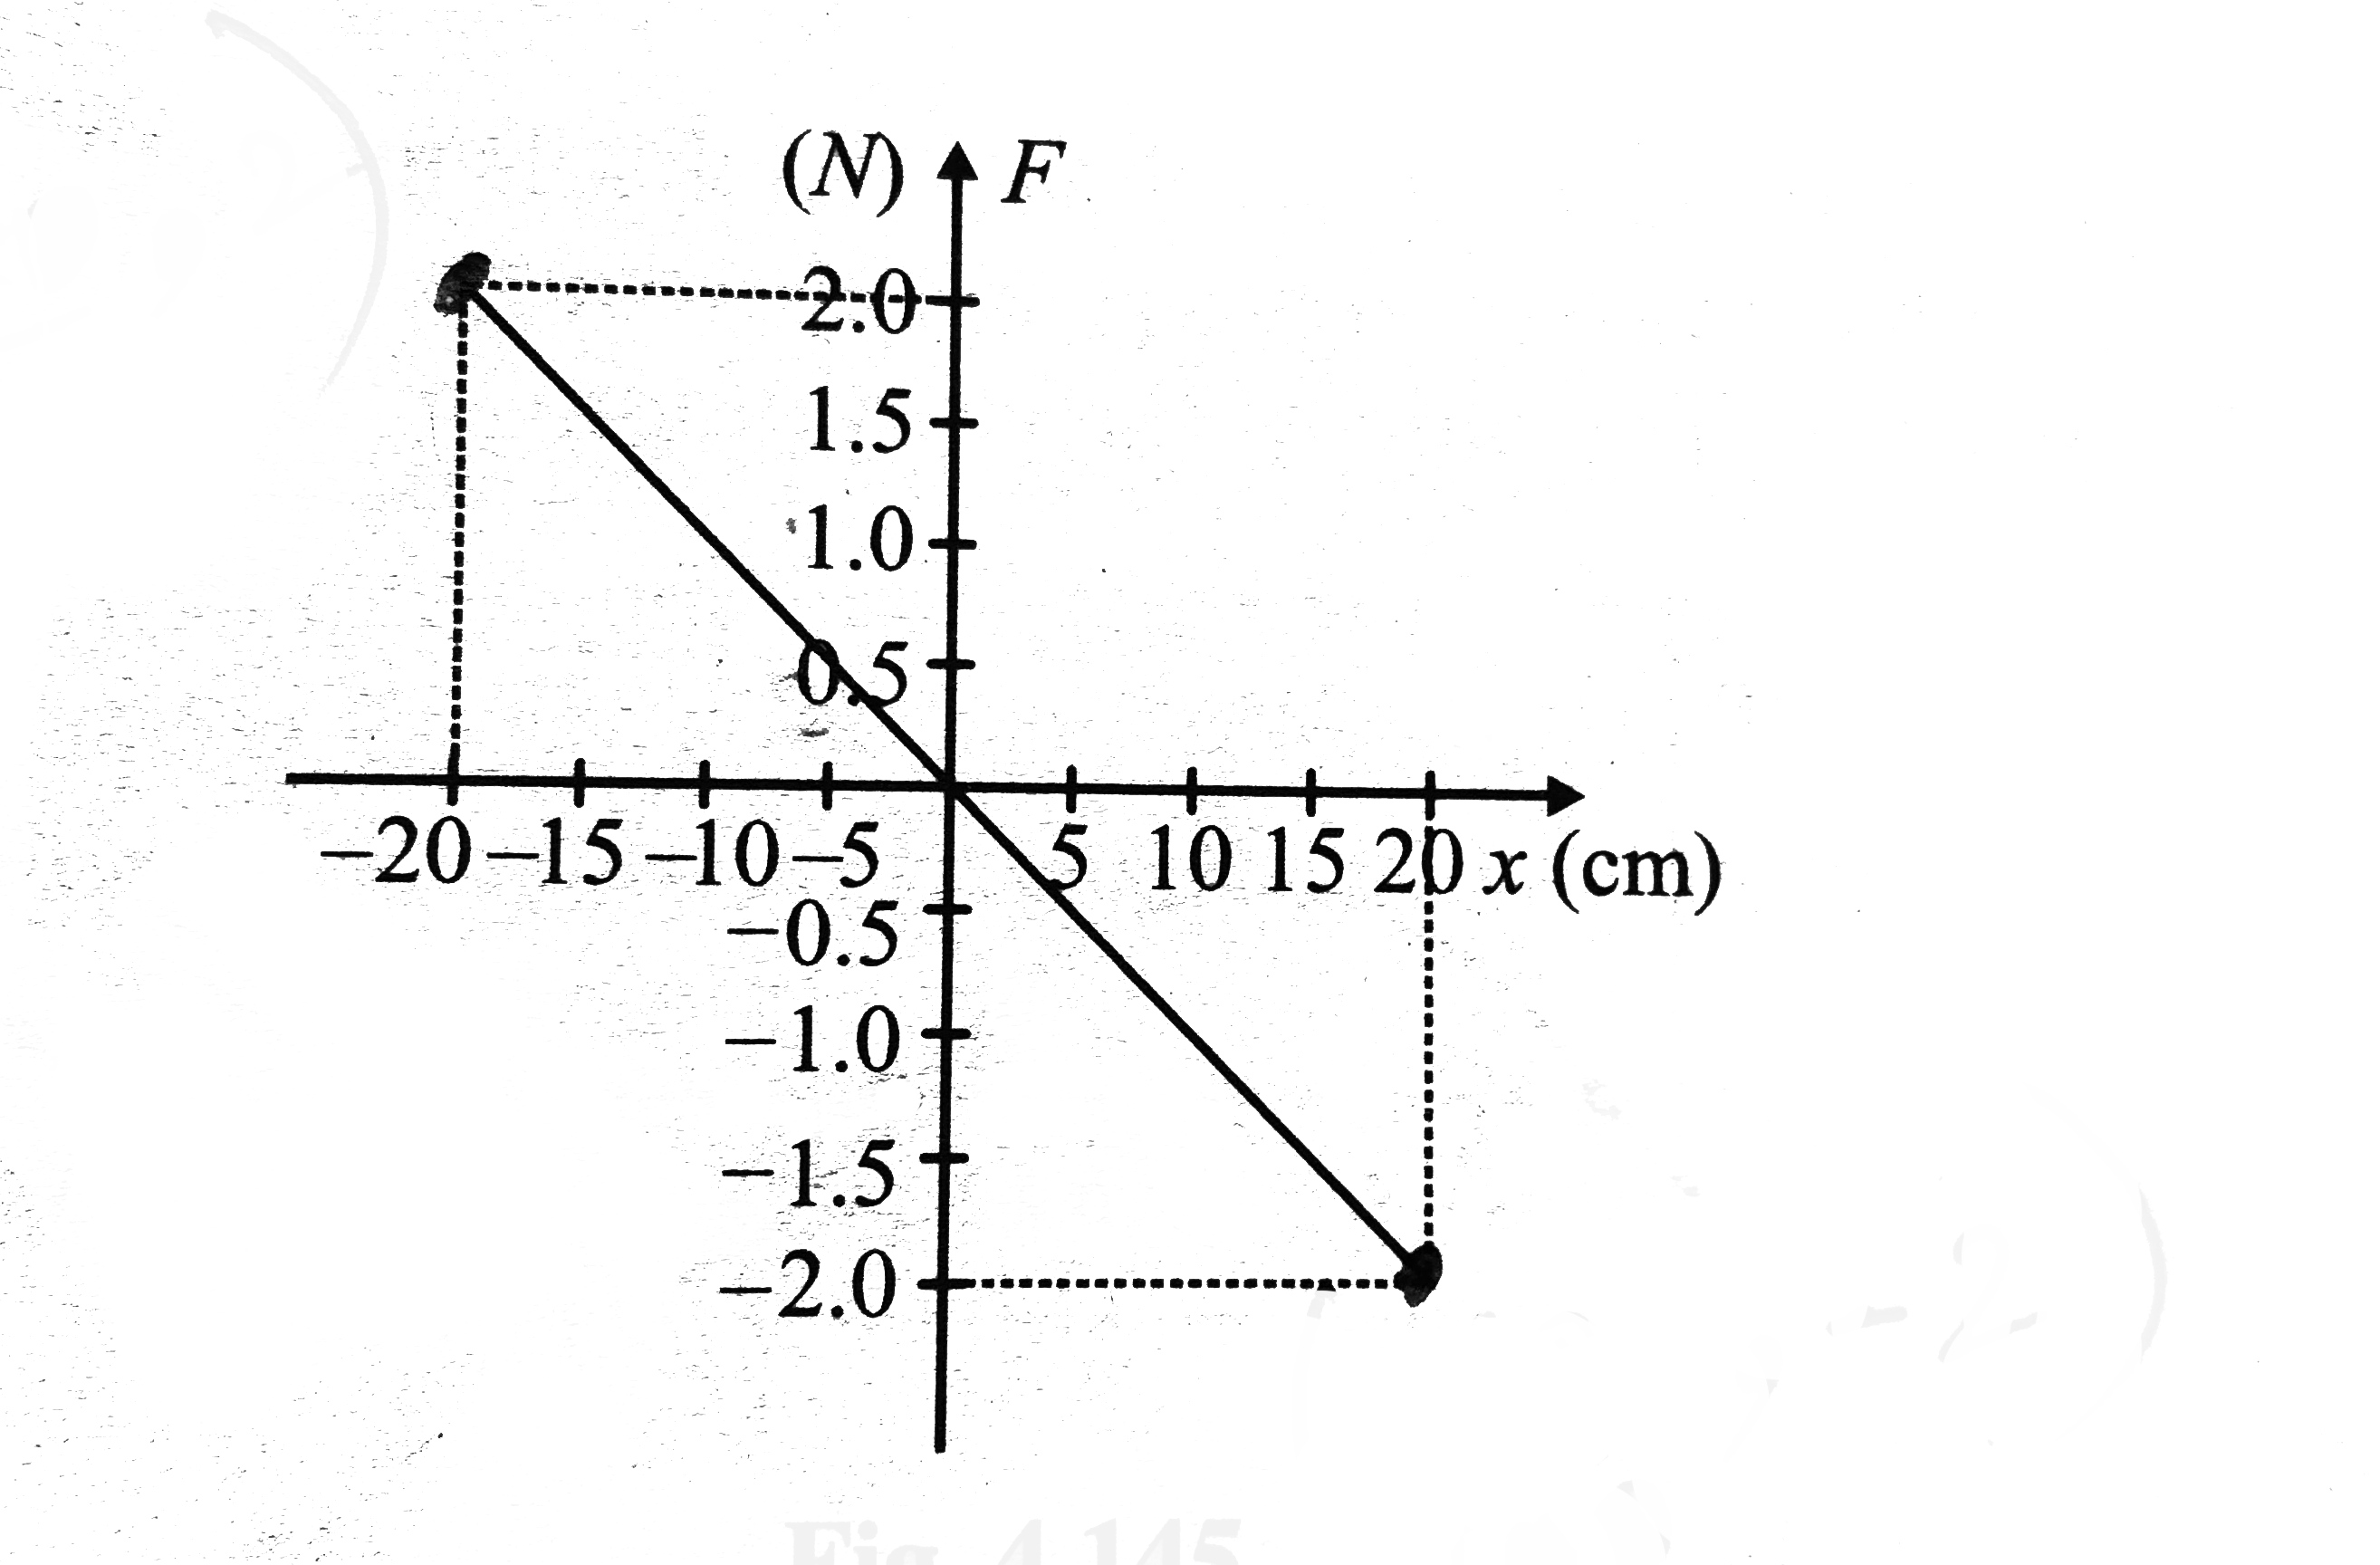
Figure. Shows the variation of force acting on a particle of mass 400 g executing simple harmonic motion. The frequency of oscillation of the particle is
View Solution
Figure. Shows the variation of force acting on a particle of mass 400 g executing simple harmonic motion. The frequency of oscillation of the particle is
View SolutionFor a particle executing simple harmonic motion, which of the following statements is not correct
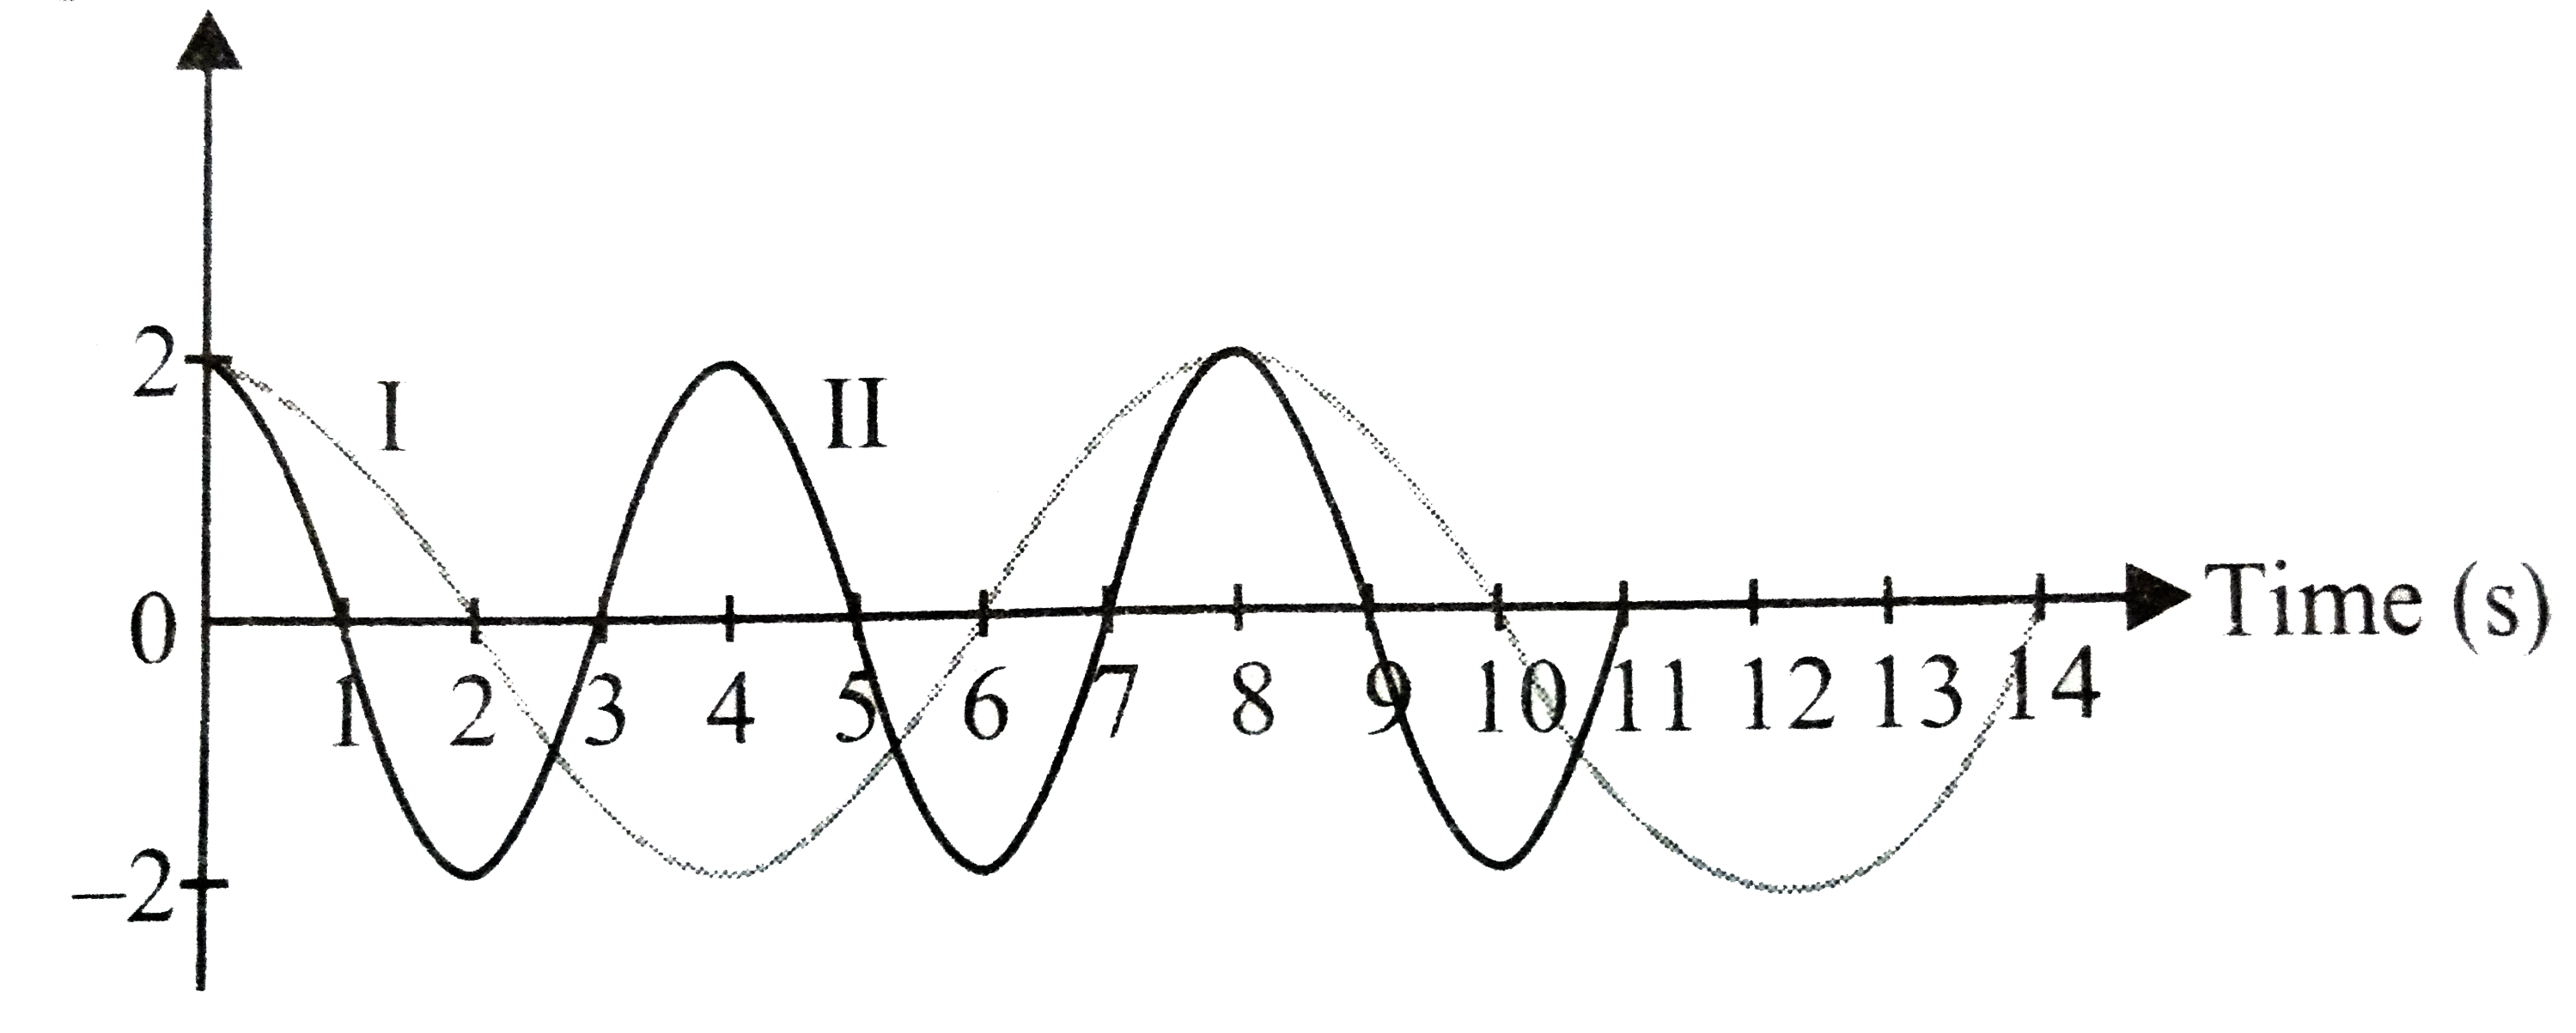
View SolutionFigure shows the displacement-time graphs of two simple harmonic motions I and II. From the graph it follows that

View Solution
