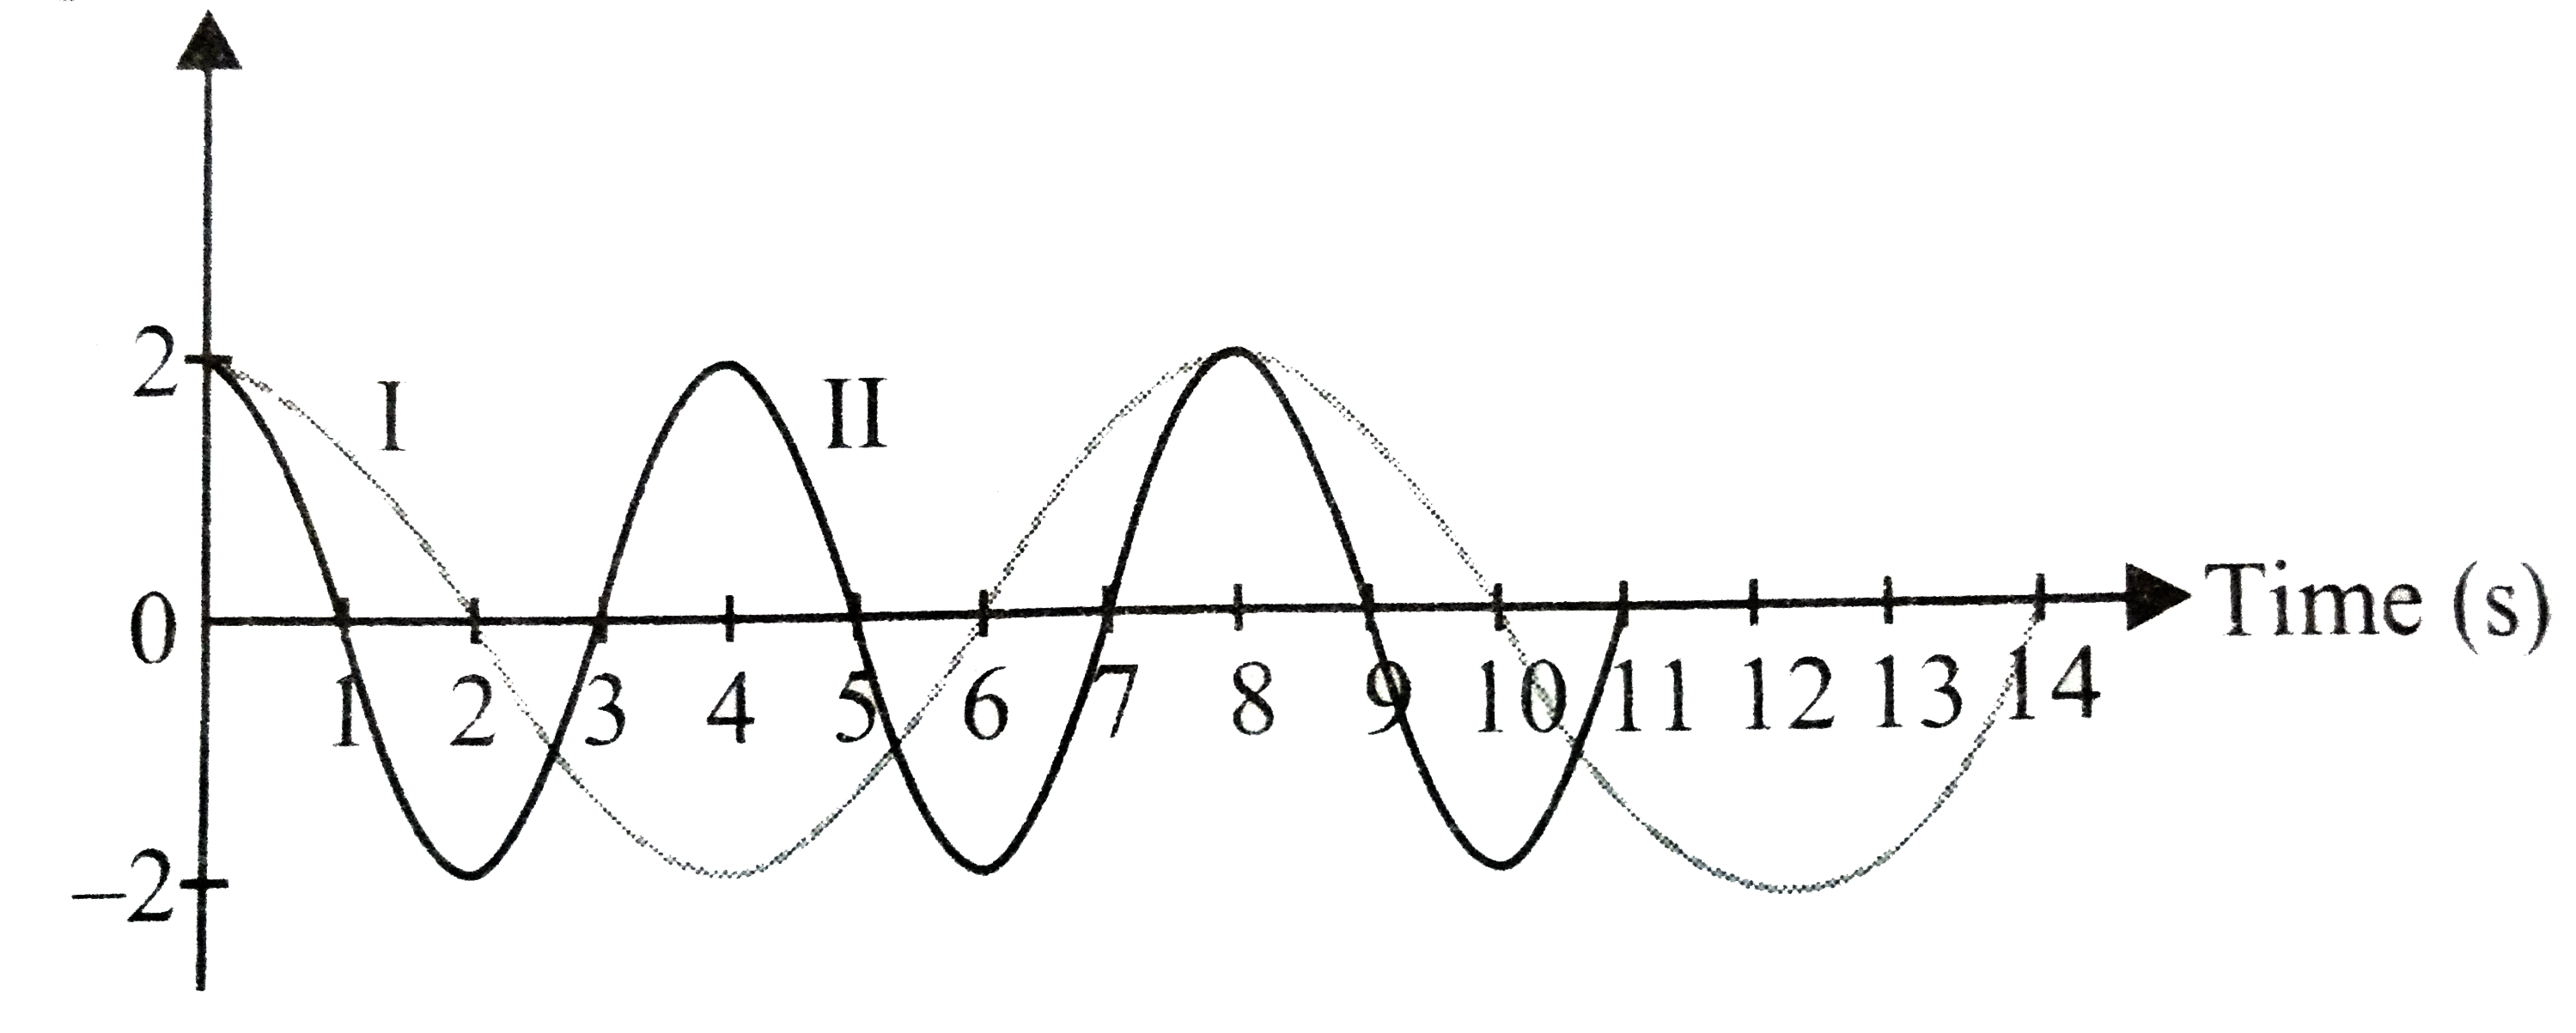
Figure shows the displacement-time graphs of two simple harmonic motions I and II. From the graph it follows that
curve I has samme frequency as that of curve II.
curve I has frequency twice that of curve II.
curve I has frequency half that of curve II
curve I has frequency four times that of curve II.
The correct Answer is:C

From the graph
for curve I,
time period, T1=8s, frequency υ1=1T1=18Hz
For curve II,
Time period, T2=4s, frequency, υ2=1T2=14Hz
Their corresponding ratio
υ1υ2=12 or υ1=12υ2.
Topper's Solved these Questions
- OSCILLATIONS Book:NCERT FINGERTPS ENGLISHChapter:OSCILLATIONS Exercise:Higher Order Thinking Skills
Explore 8 Videos
- OSCILLATIONS Book:NCERT FINGERTPS ENGLISHChapter:OSCILLATIONS Exercise:Exemplar Problems
Explore 9 Videos
- MOTION IN A STRAIGHT LINEBook:NCERT FINGERTPS ENGLISHChapter:MOTION IN A STRAIGHT LINEExercise:NCERT Exemplar
Explore 6 Videos
- PHYSICAL WORLDBook:NCERT FINGERTPS ENGLISHChapter:PHYSICAL WORLDExercise:Assertion And Reason
Explore 10 Videos
Similar Questions
Knowledge Check
The time period of simple harmonic motion depends upon
AamplitudeBenergyCphase constantDmass
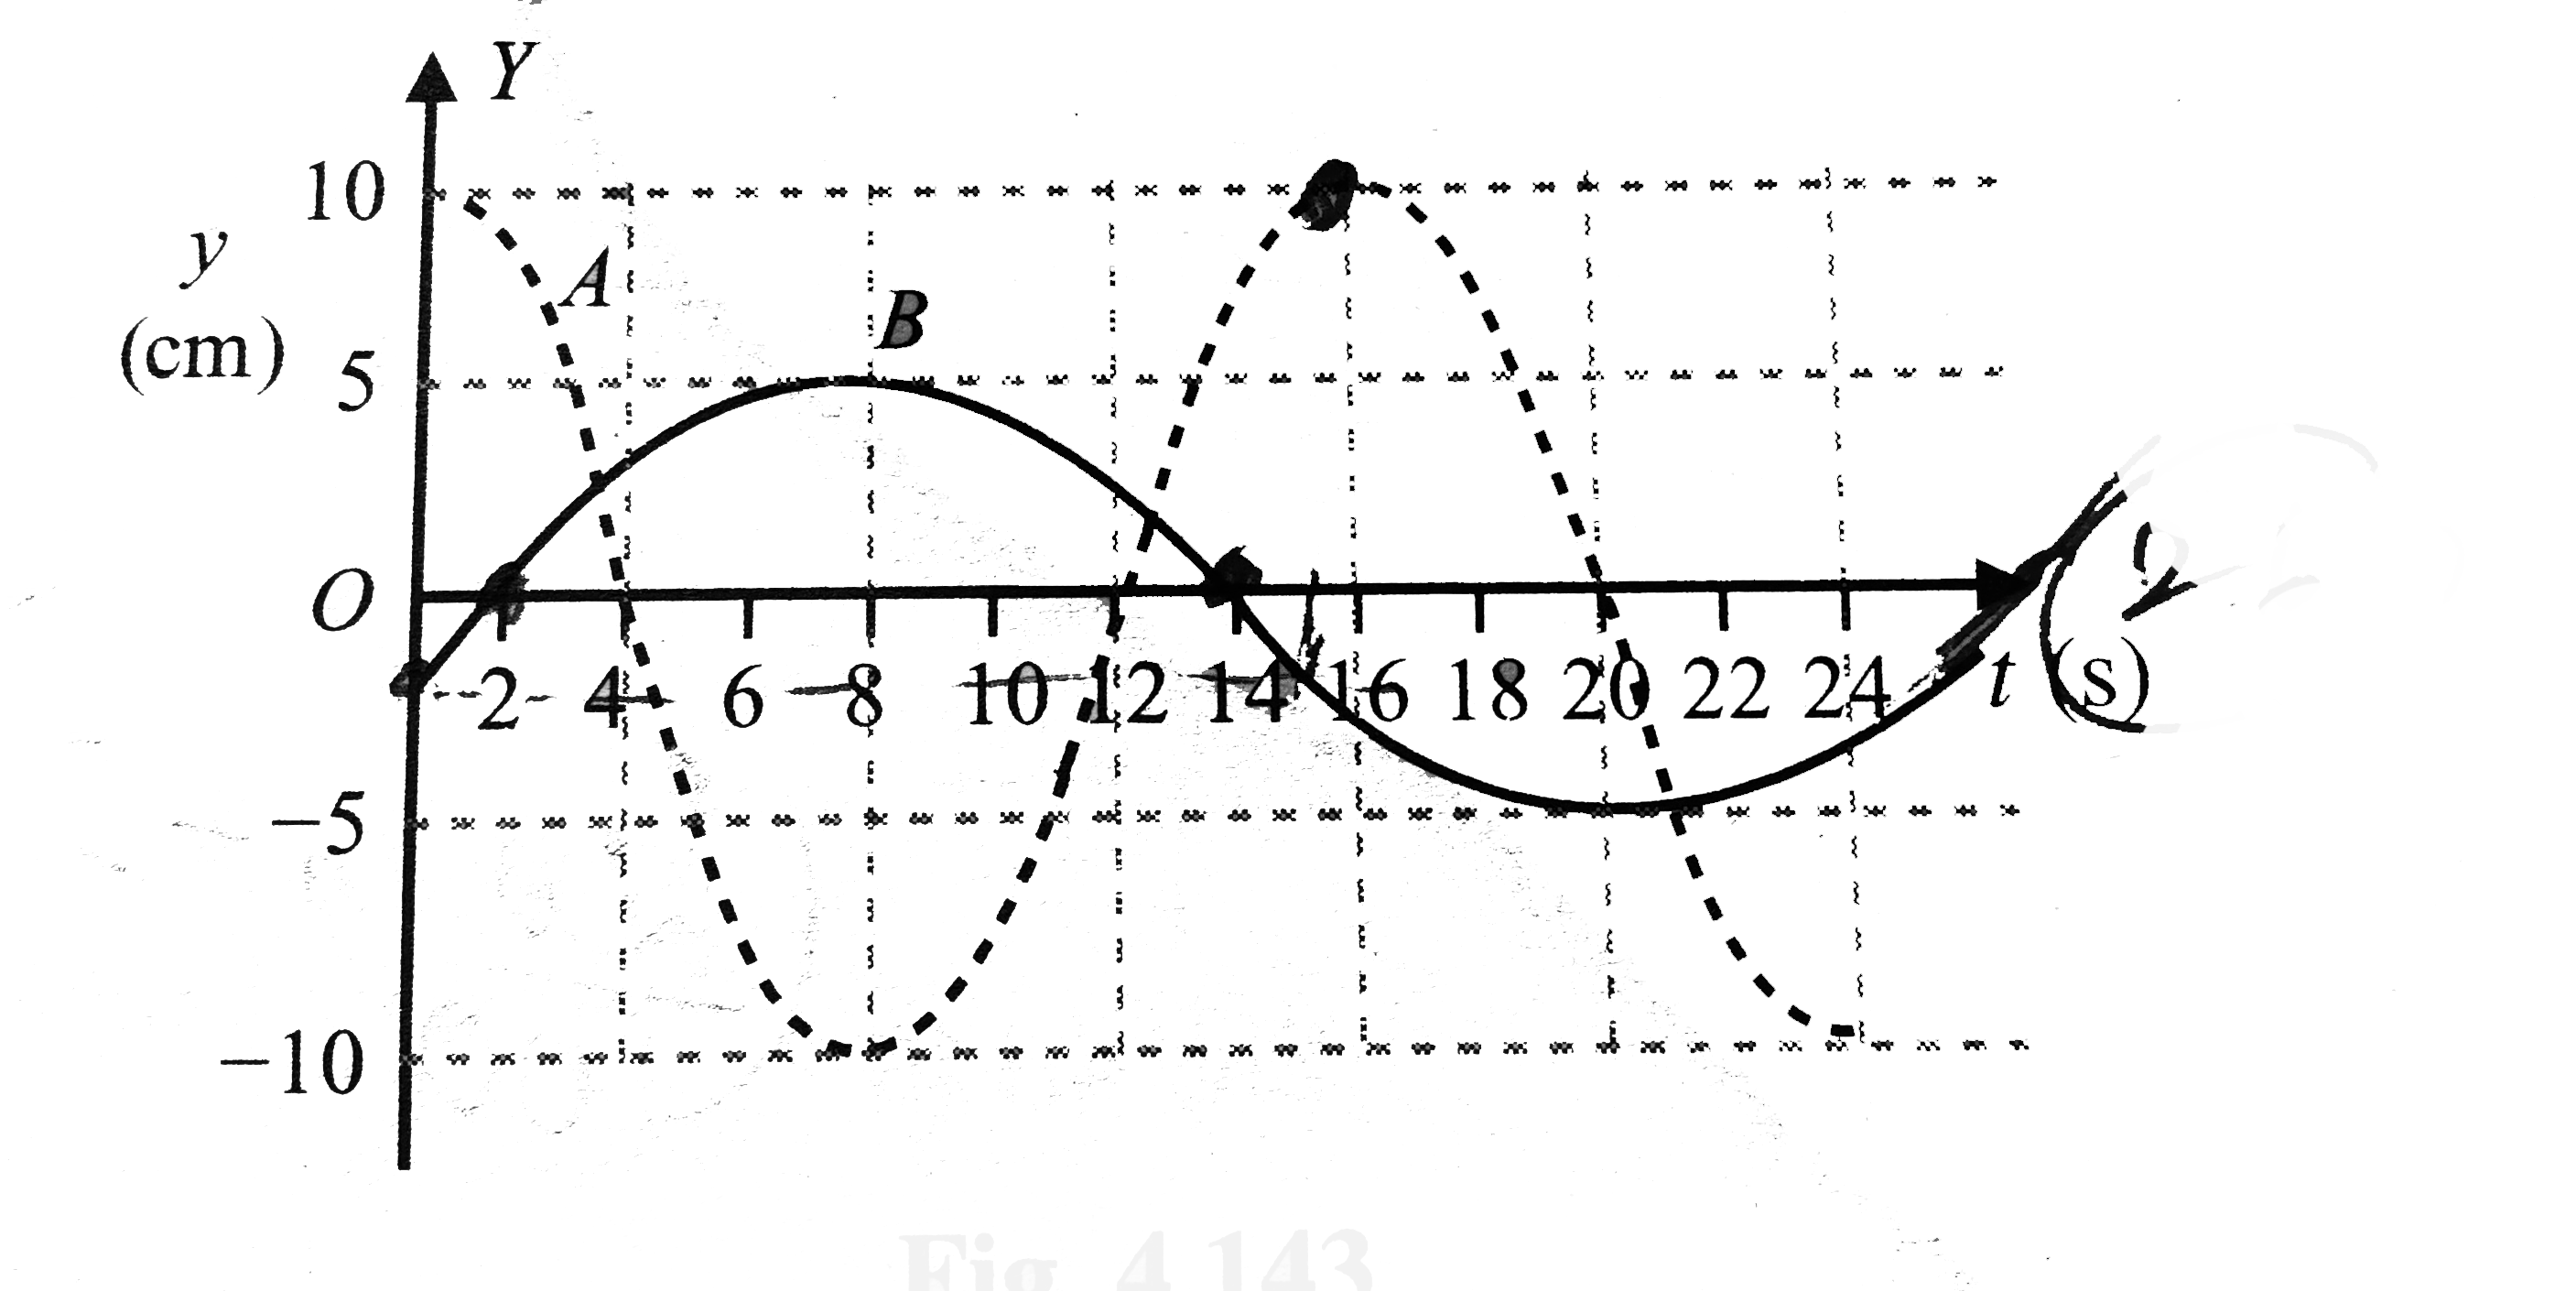
The following figure shows the displacement versus time graph for two particles A and B executing simple harmonic motions. The ratio of their maximum velocities is
View SolutionFigures (i) and (ii) below show the displacement - time graphs of two particles moving along the x-axis. We can say that

View SolutionThe displacement of a particle in simple harmonic motion in one time period is
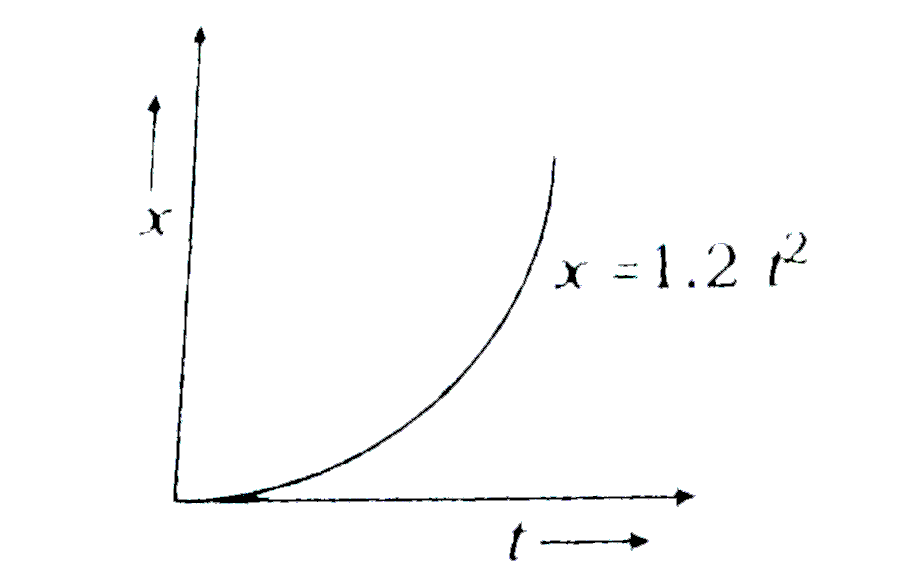
View SolutionFigure given shows the distance - time graph of the motion of a car. It follows from the graph that the car is
View SolutionThe figure shows the displacement-time graph of a particle executing SHM. If the time period of oscillation is 2s, then the equation of motion is given by
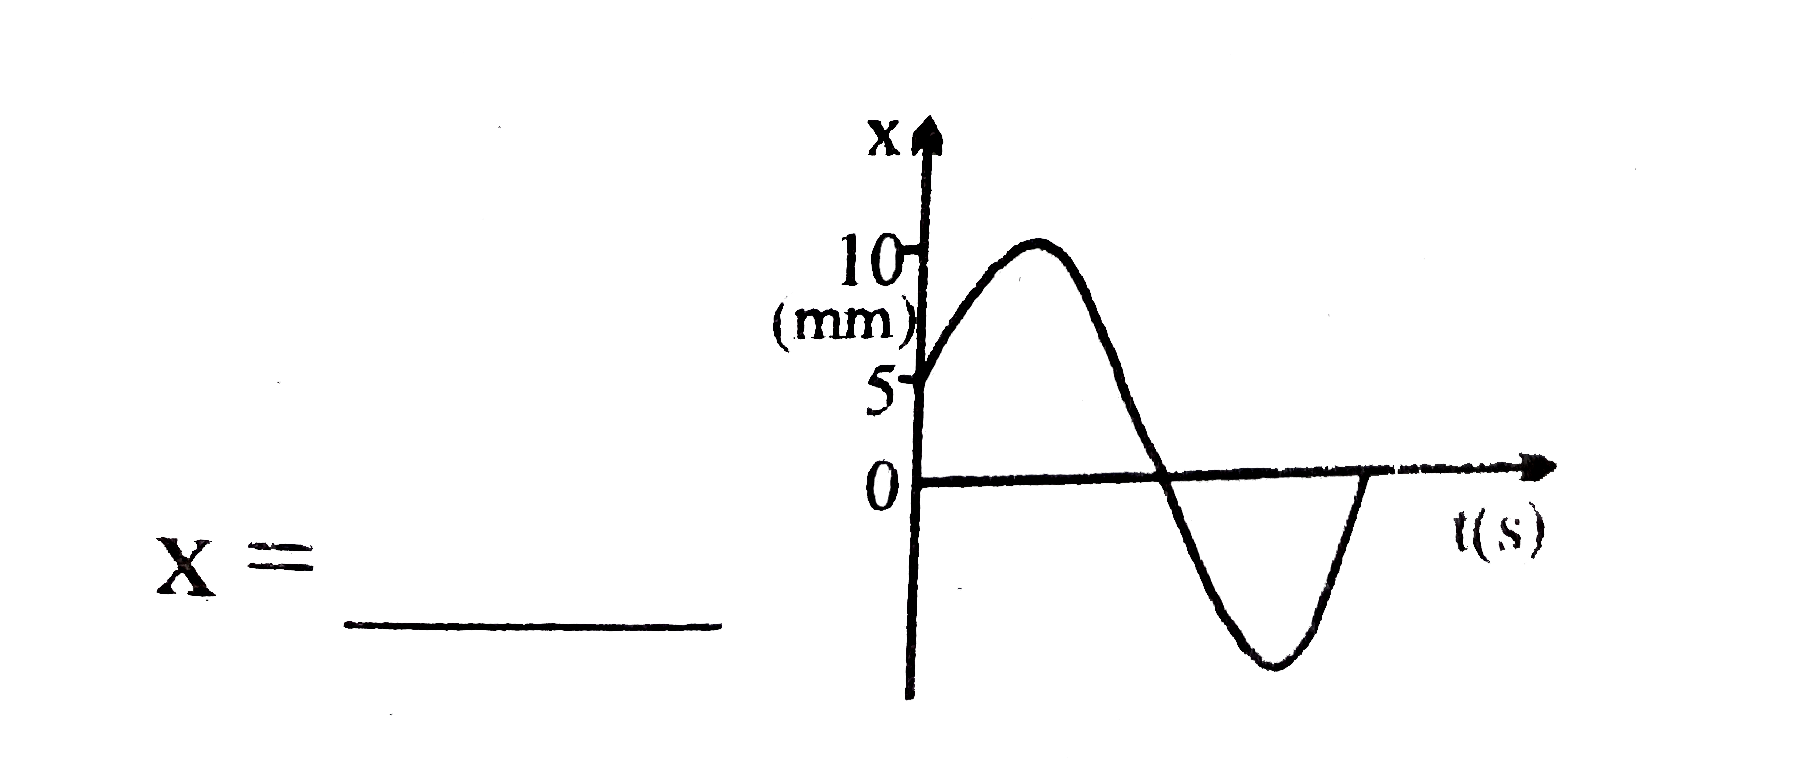
View SolutionThe figure shows the displacement-time graph of a particle executing SHM. If the time period of oscillation is 2s, then the equation of motion is given by

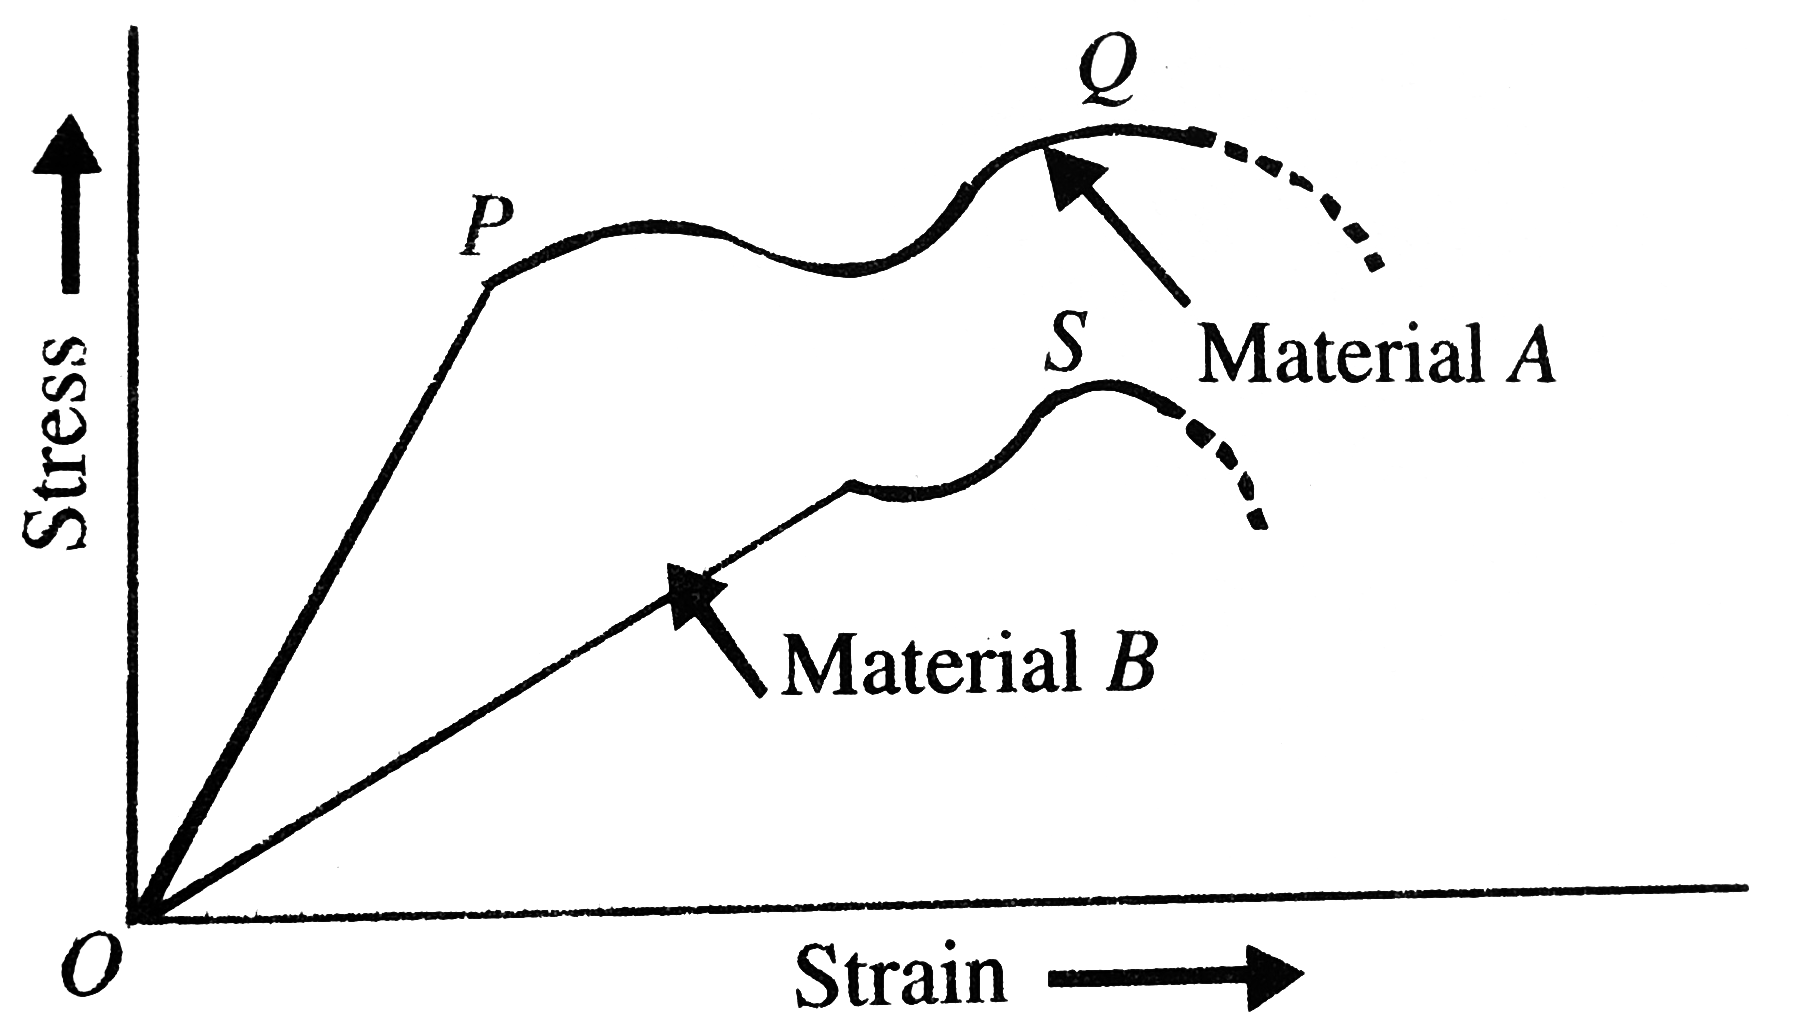
View SolutionFigure shows the stress-strain graphs for materials .A and B. From the graph it follows that
View Solution
