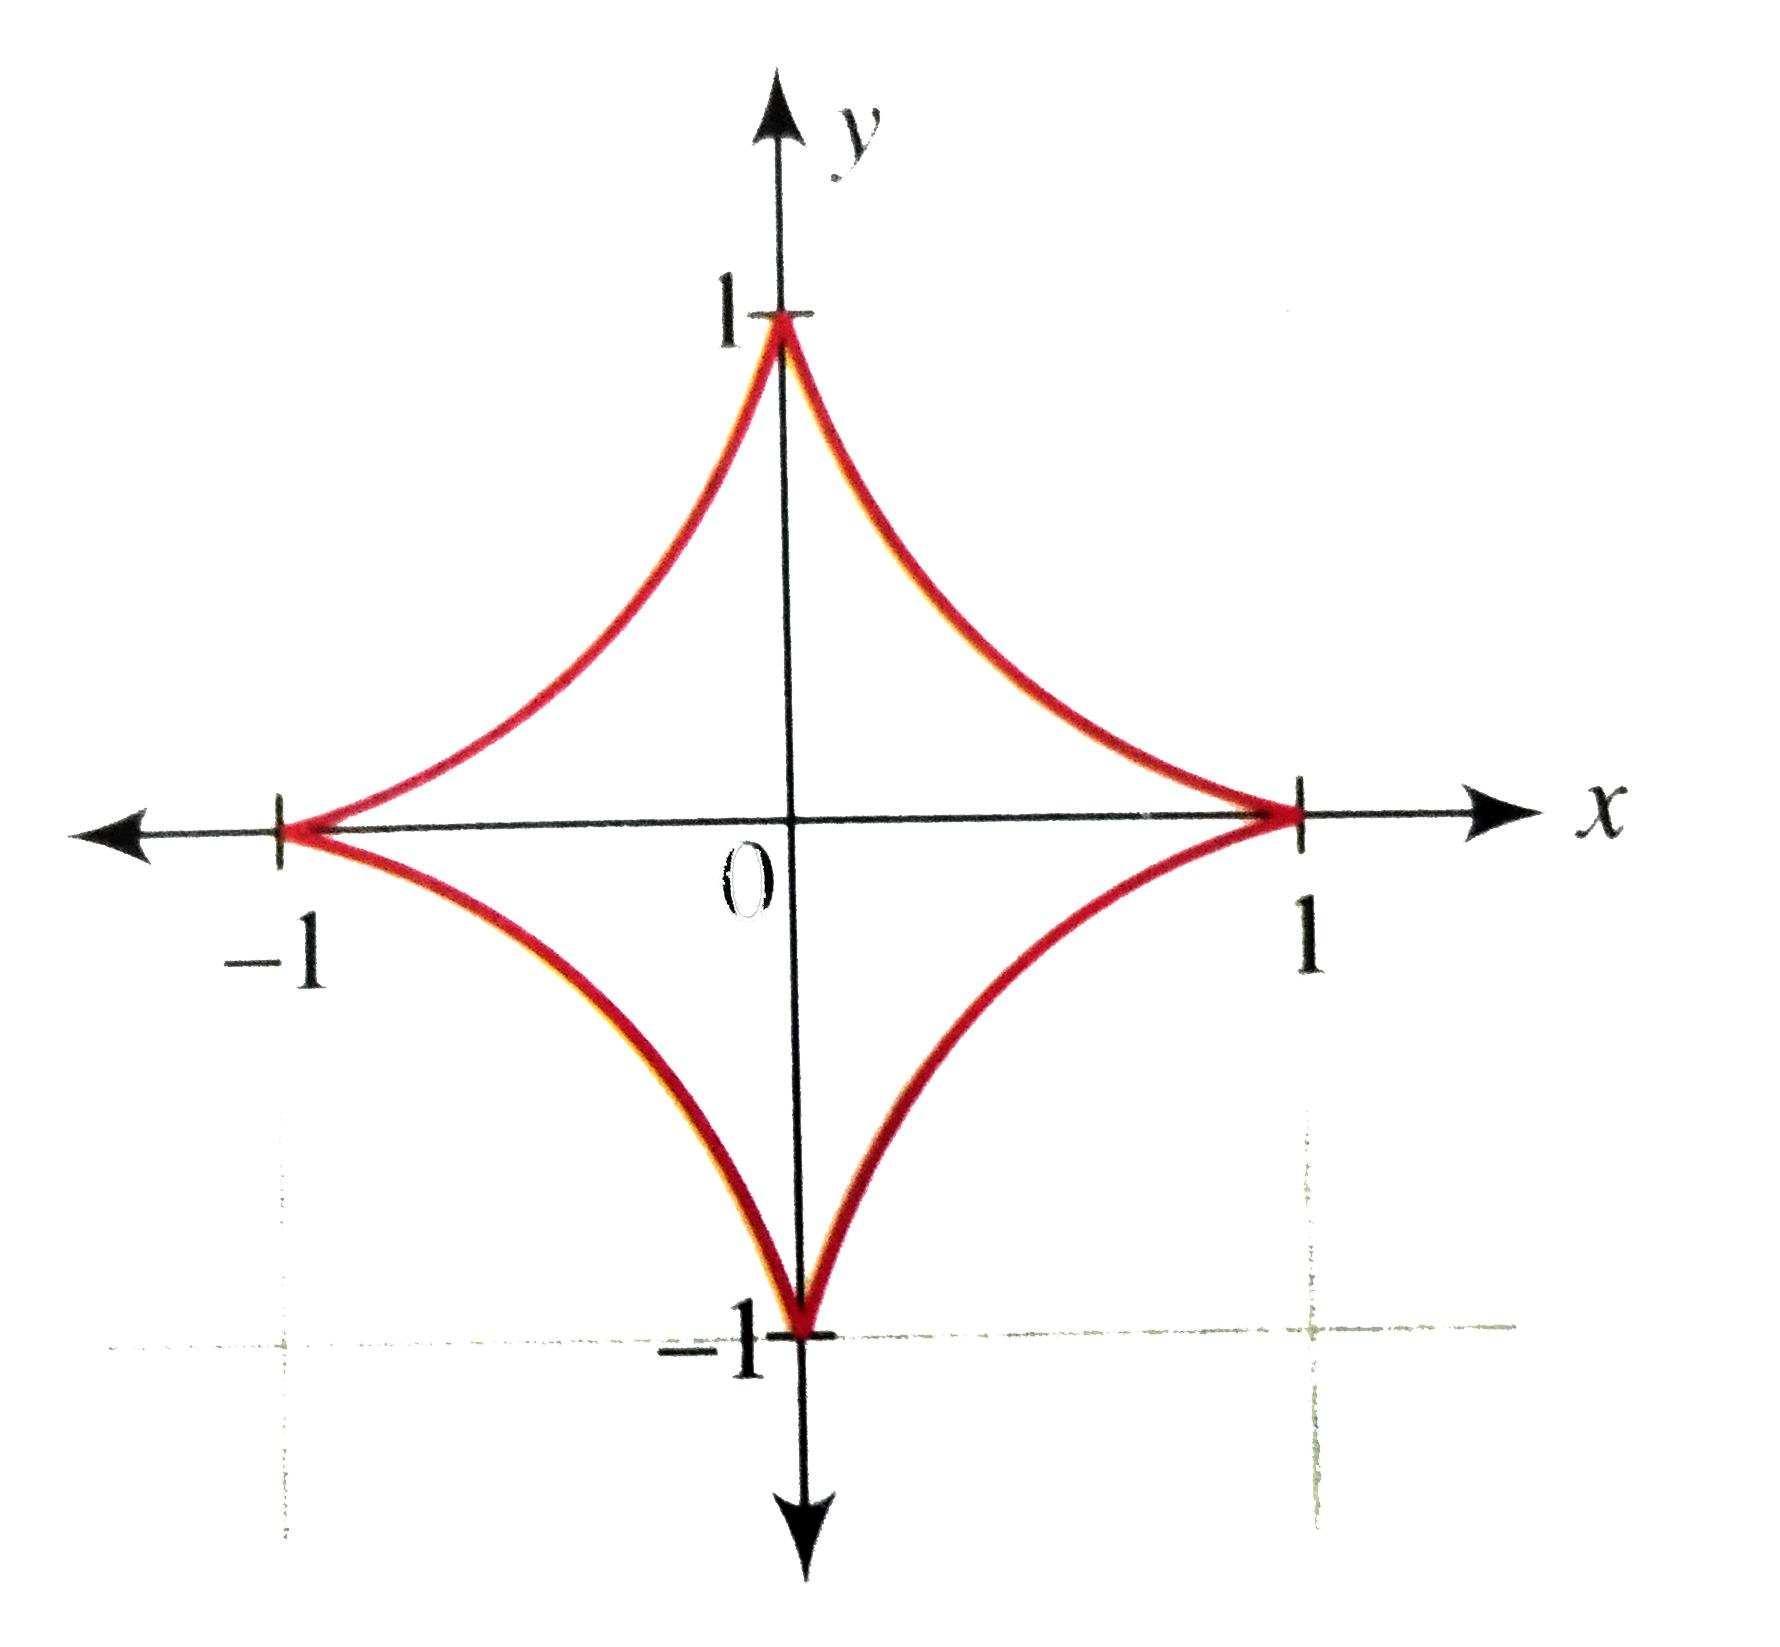
Draw the graph of x2/3y2/3=1
Video Solution
Text Solution
We have x2/3+y23=1
or y2/3=1−x2/3
or y=f(x)=(1−x2/3)3/2
Clearly, the above function is defined if 1−x2/3≥0
or x23≤1 or x2≤1 or−1≤x≤1
f(0)=1
f(x)=0∴x=±1
f′(x)=32(1−x23)(−23x−1/3)
=−(1−x2/3)1/2x1/3
f′(x)<0 for x>0 and f′(x)<0 for x<0
f′(0) does not exist, sothe function is not differentiable at x=0.
f''(x)=−−23x−1/32(1−x2/3)1/2.x1/3−13x−2/3.(1−x2/3)1/2x2/3
=13.1+x−2/3.(1−x2/3)(1−x2/3)1/2.x23l>0,∀x∈(−1,1)
Hence the graph is concave upward.
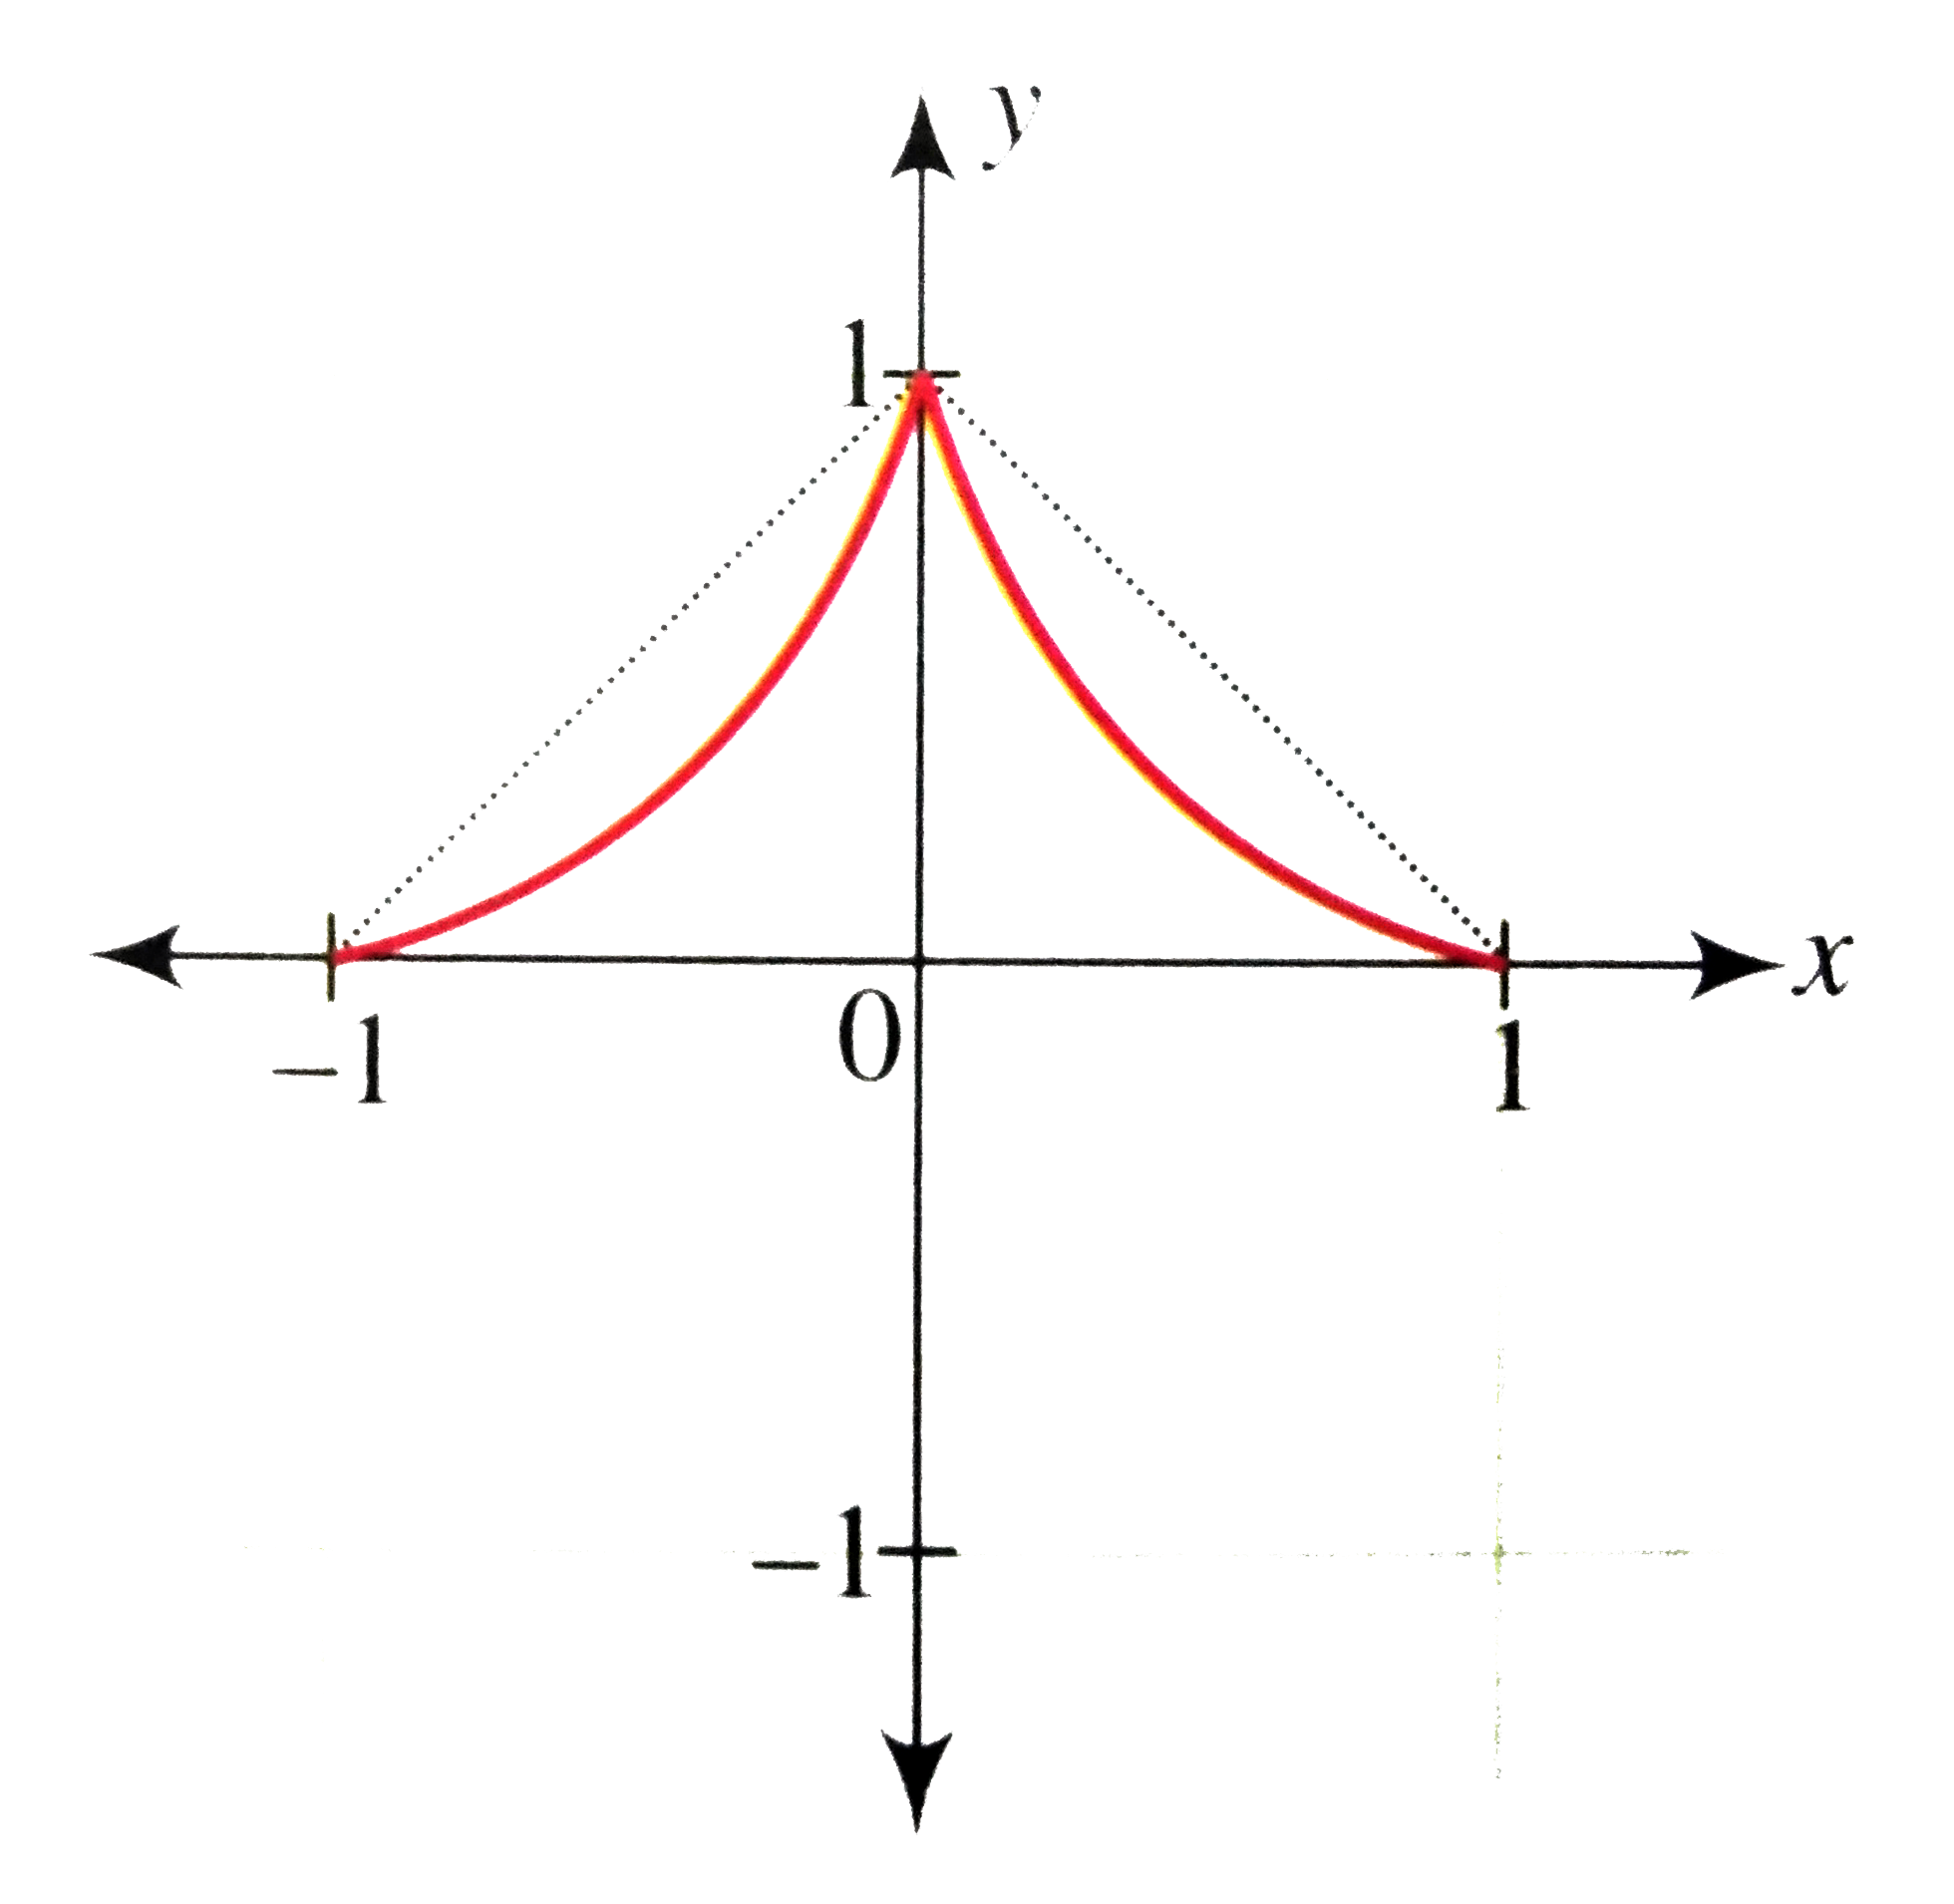
From the above information the graph of the function y=f(x) can be drawn as shown in the following figure.

For y<0, we can reflect the above graph in the x-axis, so the graph of the given relation can be drawn as shown in the following figure.

|
Topper's Solved these Questions
Similar Questions
Draw the graph of y=x3/5
View SolutionDraw the graph of y=x2+1
View SolutionDraw the graph of y=2x.
View SolutionDraw the graph of y≤x+2.
View SolutionDraw the graph of y=|x|+2
View SolutionDraw the graph of f(x)=x2−3
View SolutionDraw the graph of y=2−x.
View Solutiondraw the graph of |y|=x3−3x+2
View SolutionDraw the graph of y=tan(3x).
View SolutionDraw the graph of y=(x+1)2/3+(x−1)2/3
View Solution
