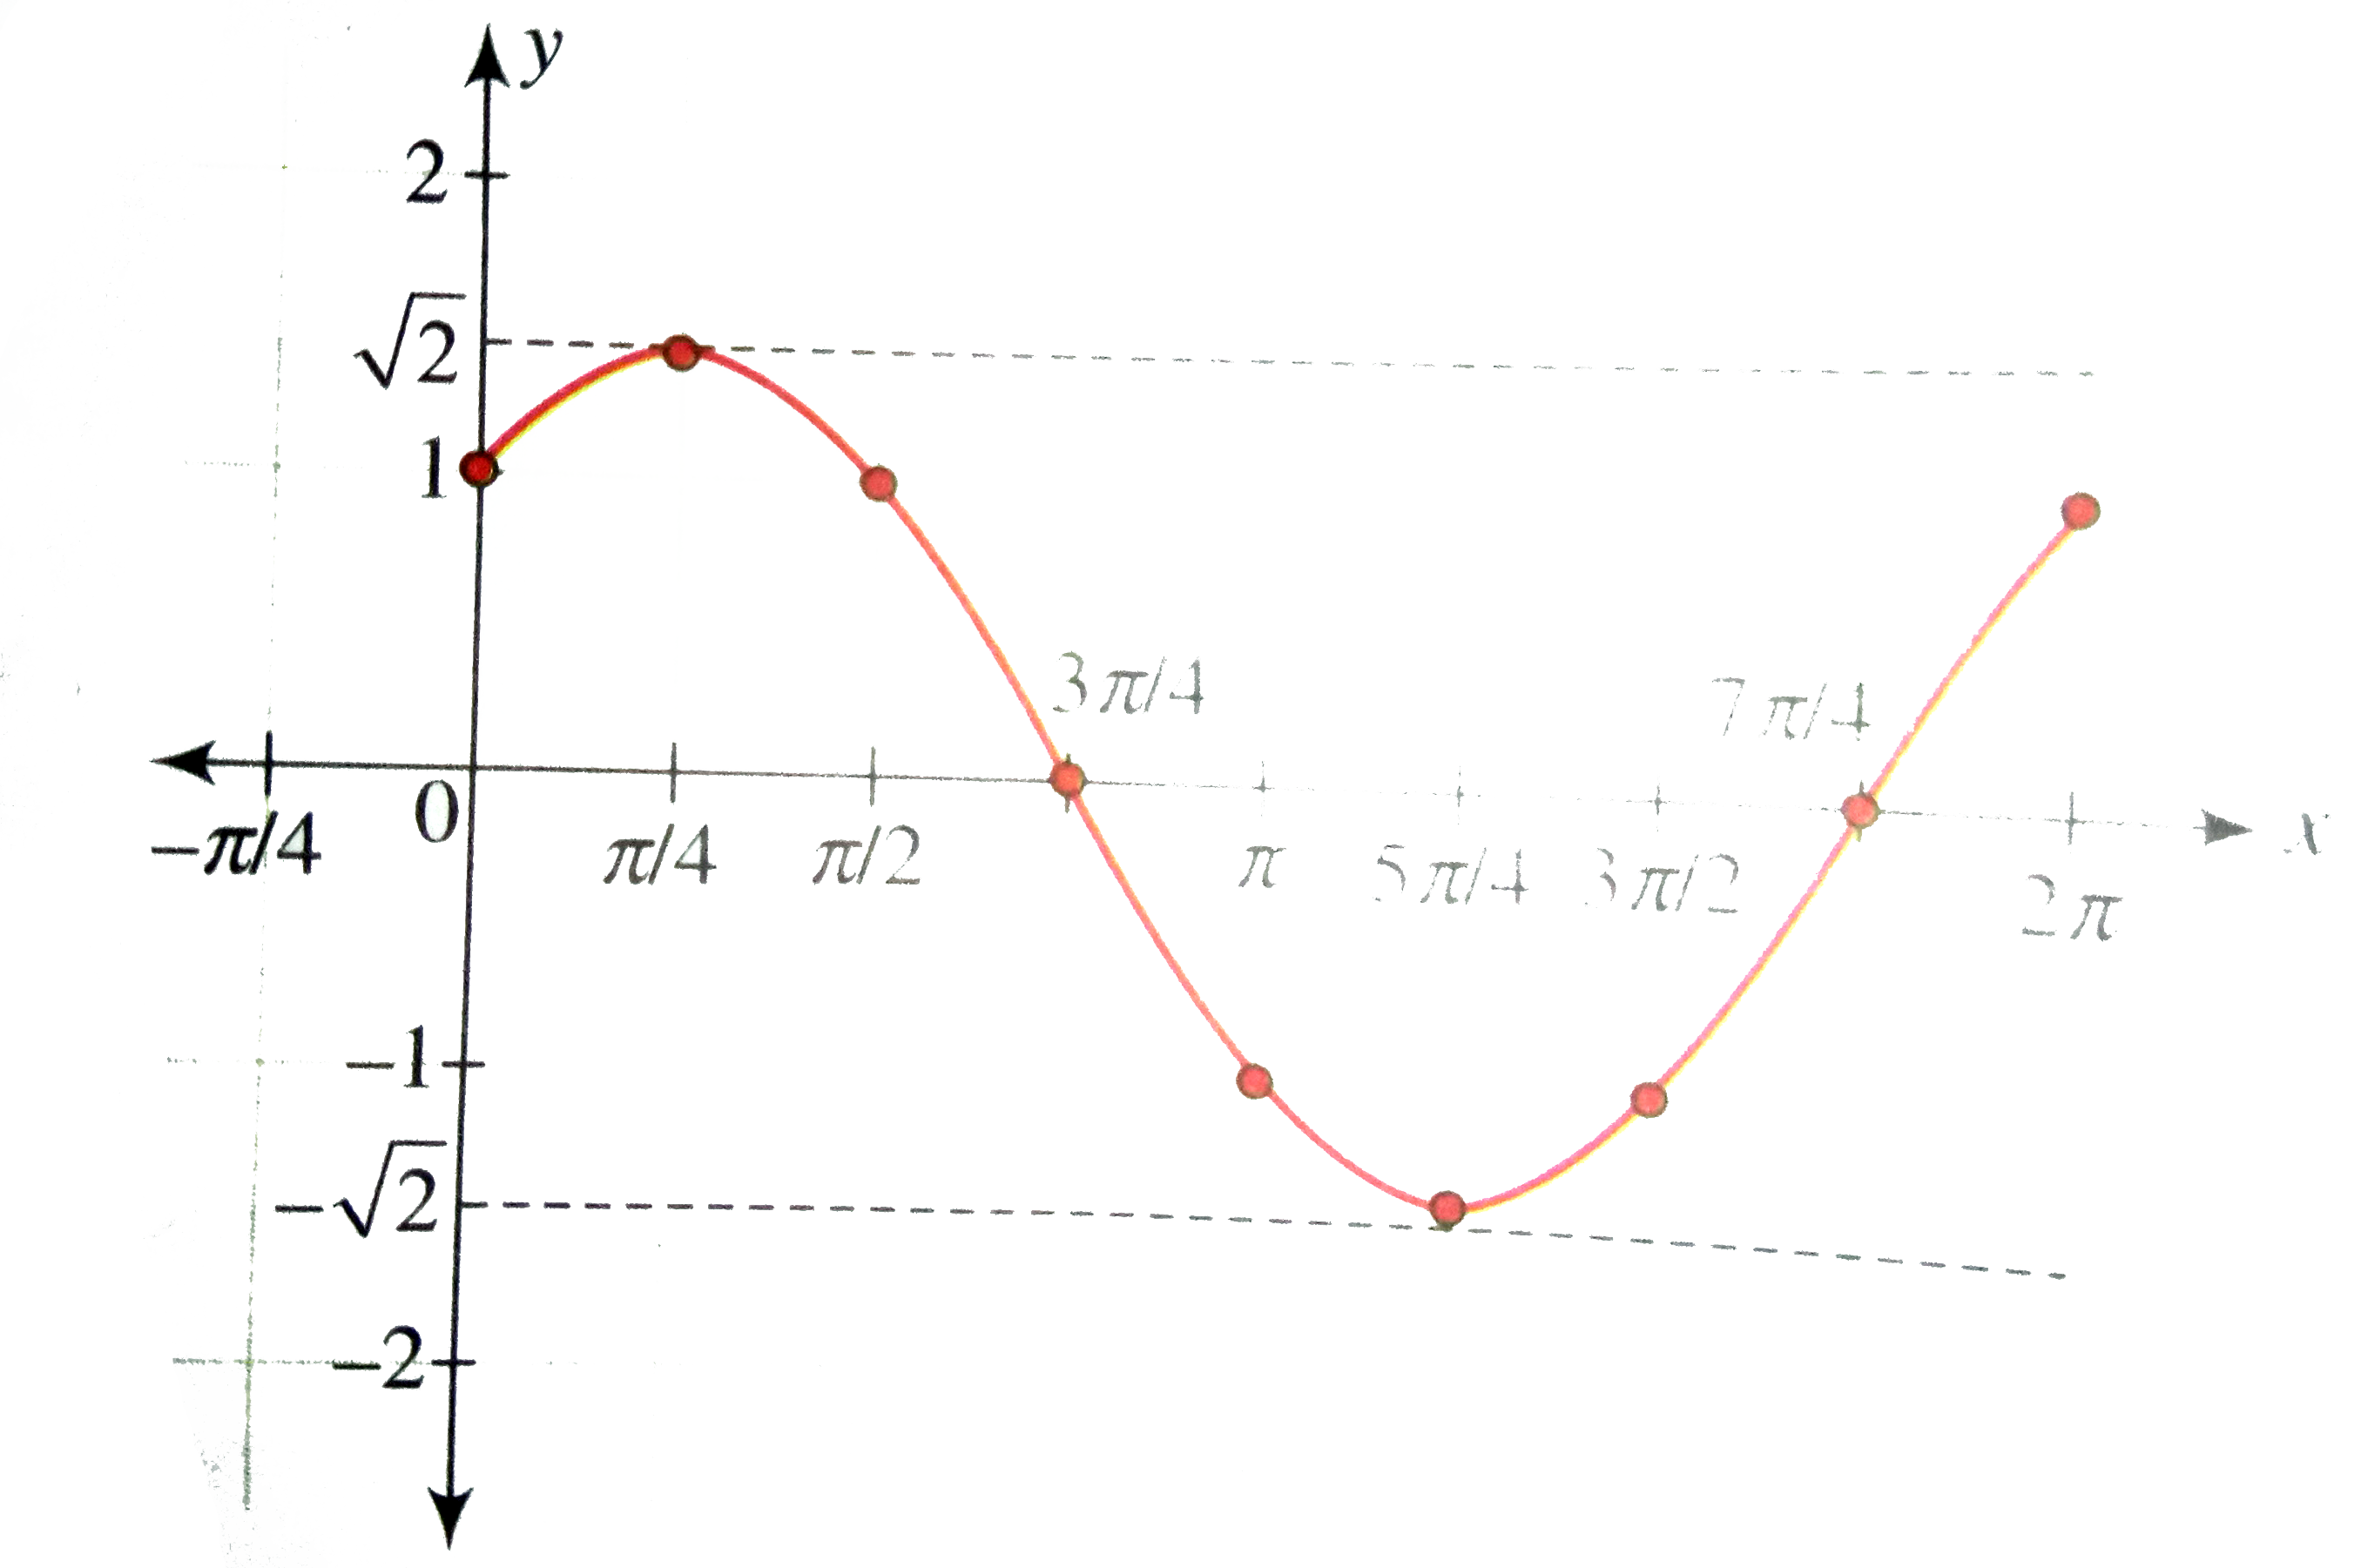
Draw the graph of y=sinx+cosx,x∈[0,2π].
Video Solution
Text Solution
We have y=f(x)=sinx+cosx,x∈[0,2π]
To draw the graph, we need to decide the points to be plotted.
f(x) = sin x + cos x
=√2(1√2sinx+1√2cosx)
=√2sin(x+π4)
f(0)=1,f(π4)=√2,f(π2)=1
f(3π4)=0,f(π)=−1,f(5π4)=−√2,
f(3π2)=−1,f(7π4)=0,f(2π)=1,
Plotting these points and joining them, we get the graph as shown in the gfollowing figure.

|
Topper's Solved these Questions
- GRAPHS OF TRIGONOMETRIC FUNCTIONSBook:CENGAGEChapter:GRAPHS OF TRIGONOMETRIC FUNCTIONSExercise:Exercise
Explore 22 Videos
- GRAPHS OF ELEMENTARY FUNCTIONS Book:CENGAGEChapter:GRAPHS OF ELEMENTARY FUNCTIONS Exercise:Exercise
Explore 34 Videos
- HIGHT AND DISTANCE Book:CENGAGEChapter:HIGHT AND DISTANCE Exercise:JEE Previous Year
Explore 3 Videos
Similar Questions
Draw the graph of y = x sin x.
View SolutionDraw the graph of y=3sin2x.
View SolutionDraw the graph of y=sin|x|.
View SolutionDraw the graph of y=sin2x.
View SolutionDraw the graph of y=sin3x.
View SolutionDraw the graph y=sin2x.
View SolutionDraw the graph of y= [sinx], y= [cosx]
View SolutionDraw graph of y = sin x
View SolutionDraw the graph of y=sinxx.
View SolutionDraw the graph of y=[sinx],x∈[0,2π], where [⋅] represents the greatest integer function.
View Solution

