Which one of the following graphs represents the variation of electric field with distance r from the centre of a charged spherical conductor of radius R?

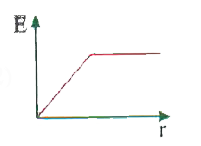

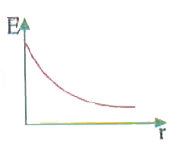
The correct Answer is:C
Eαr,Eα1r2
Topper's Solved these Questions
Similar Questions
Draw a graph of electric field E(r) with distance r from the centre of the shell for 0≤r≤0 .
View SolutionA hollow charged sphere of radius R has a constant surface charge density o. Of the following graphs the one, which shows the variation of the electric field strength E with distance X from the centre of the sphere is (A) E I=R x (B) E 1
View Solution
Knowledge Check
An isolated non-conducting solid sphere of radius R is given an electric charge. The charge is uniformly distributed in the volume of sphere. The graph which shows the correct variation of magnitude of electric field with distance from the centre of the sphere is
A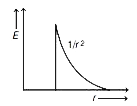 B
B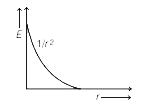 C
C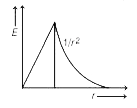 D
D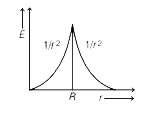
Which of the following graph represents the variation of electric field E due to a thin charged spherical shell of radius R as a function of the distance r from the centre of the shell?
A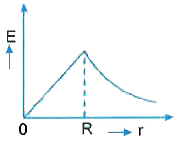 B
B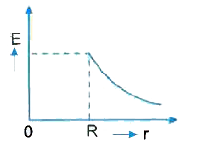 CD
CD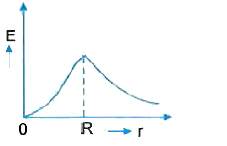
Which one of the following plots represents the variation of the gravitational field on a particle with distance r due to a thin spherical shell of raduis R? (r is measured from the centre of the spherical shell).
A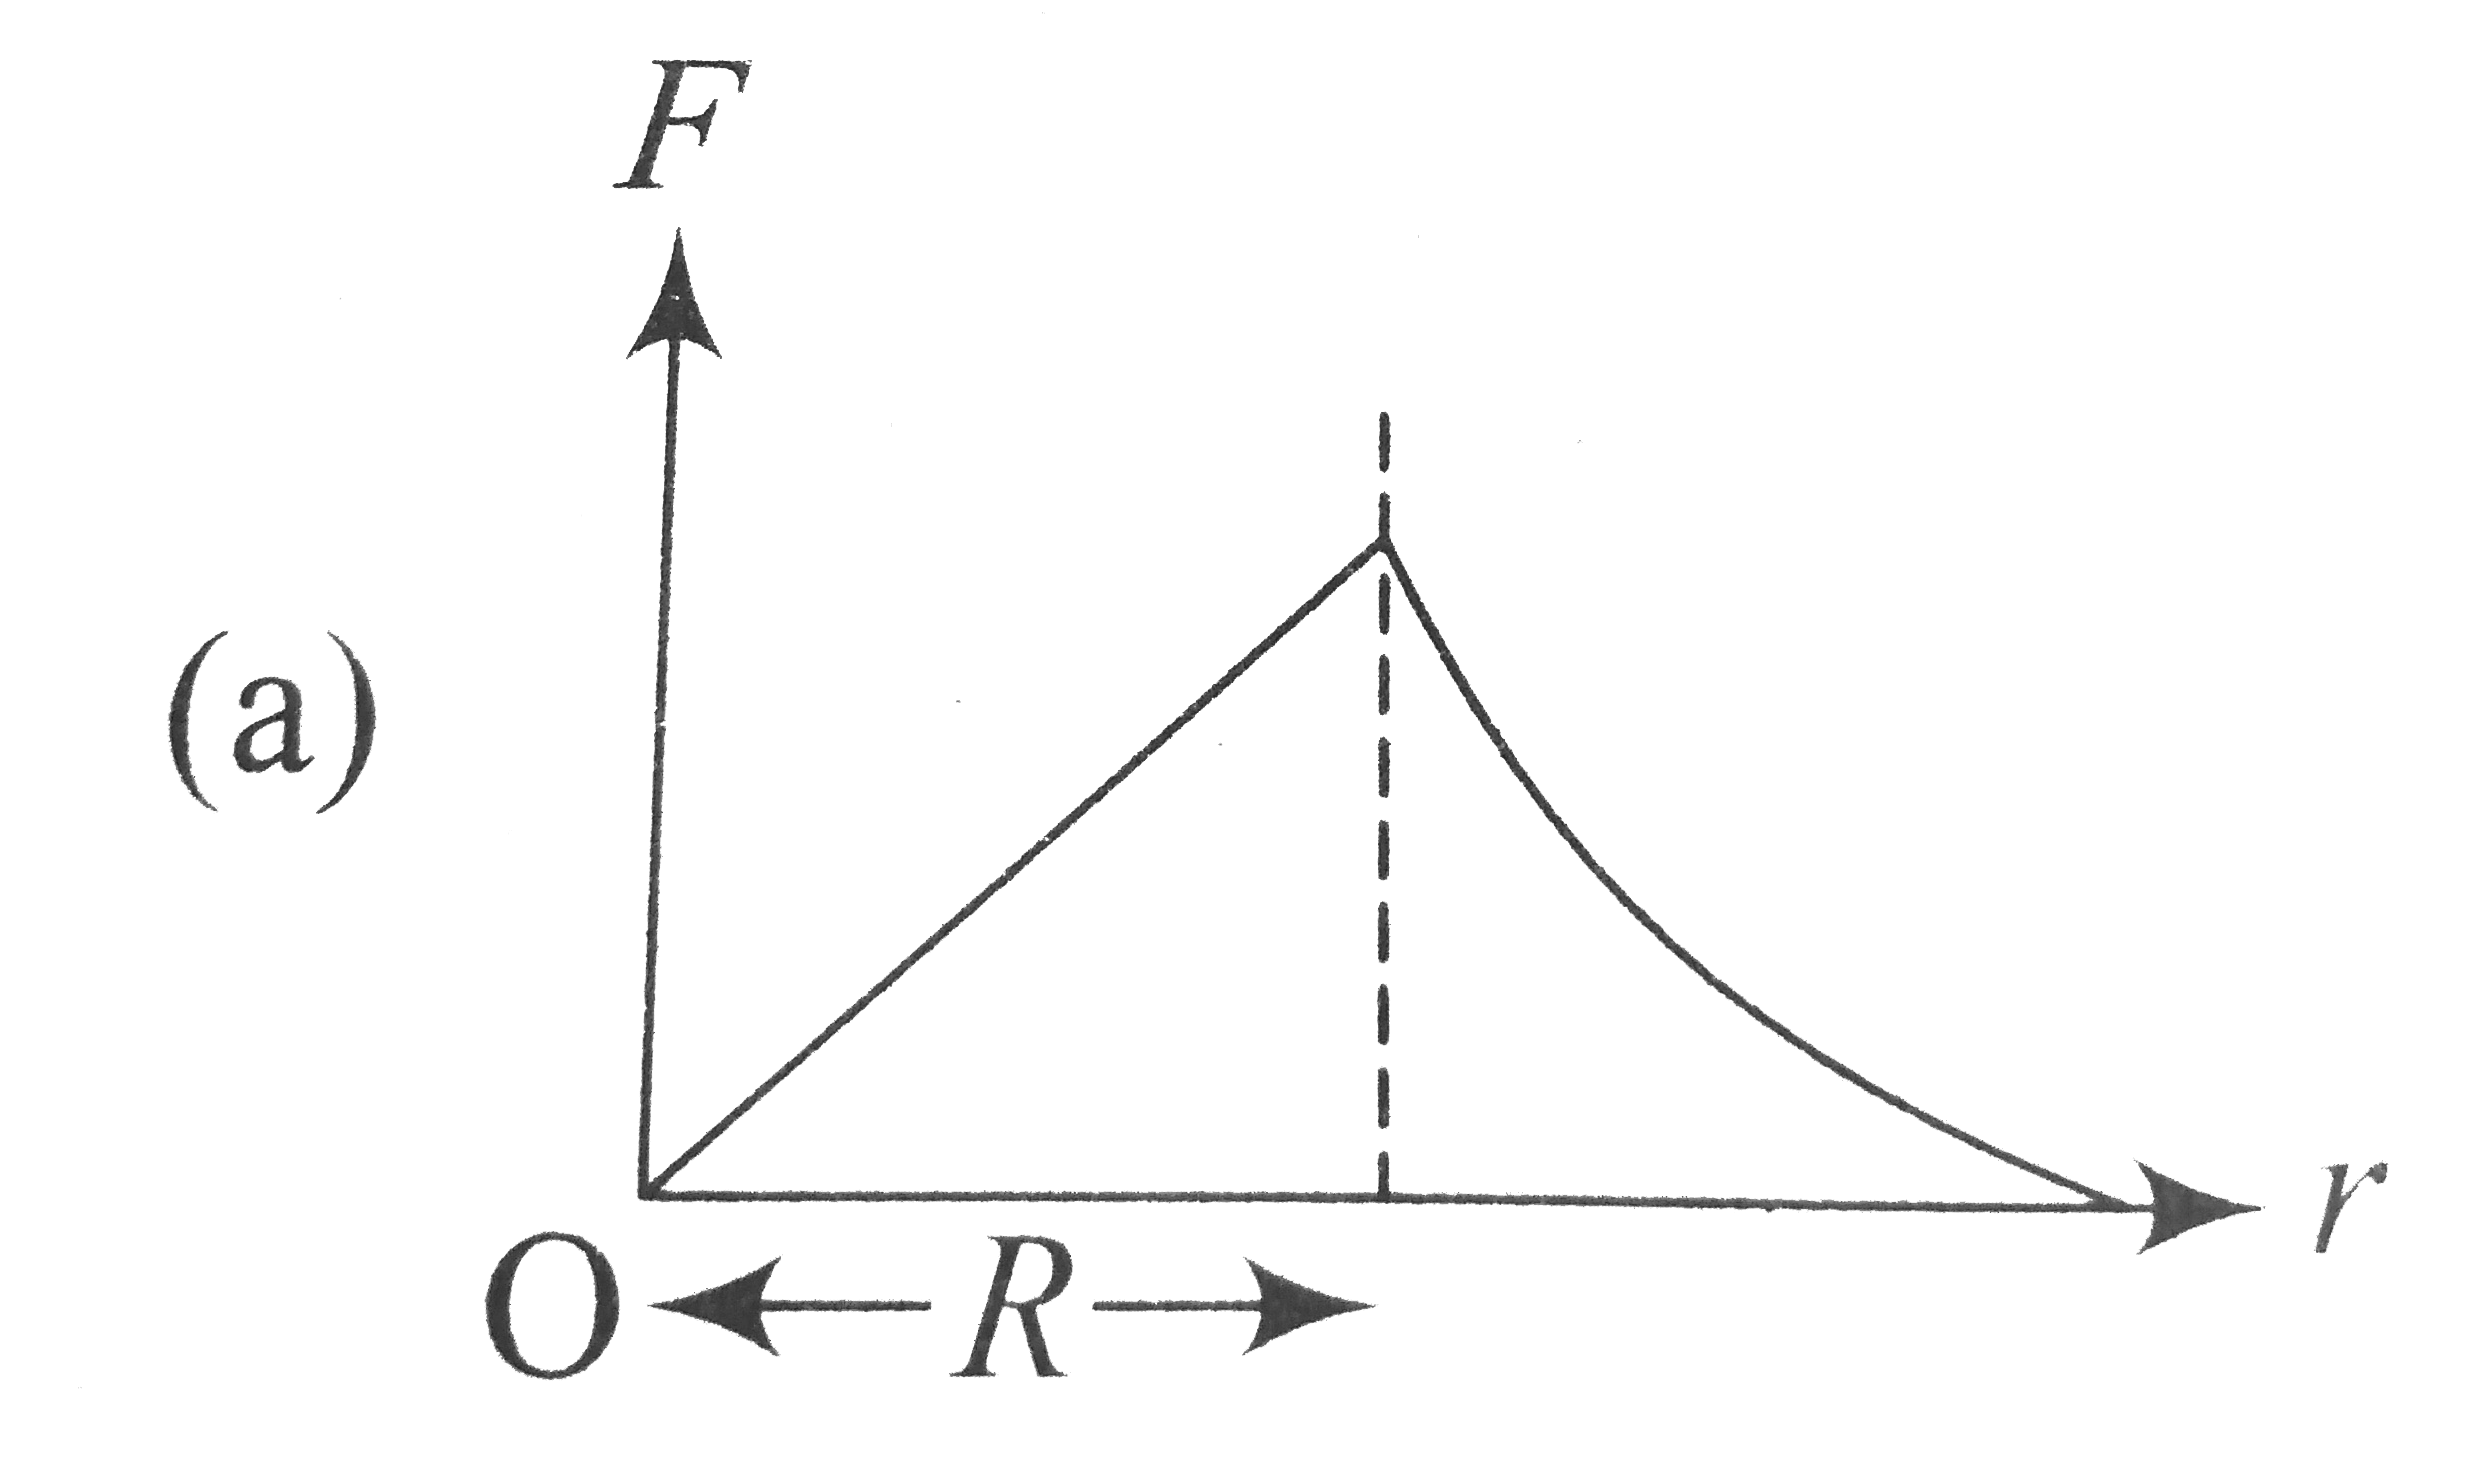 B
B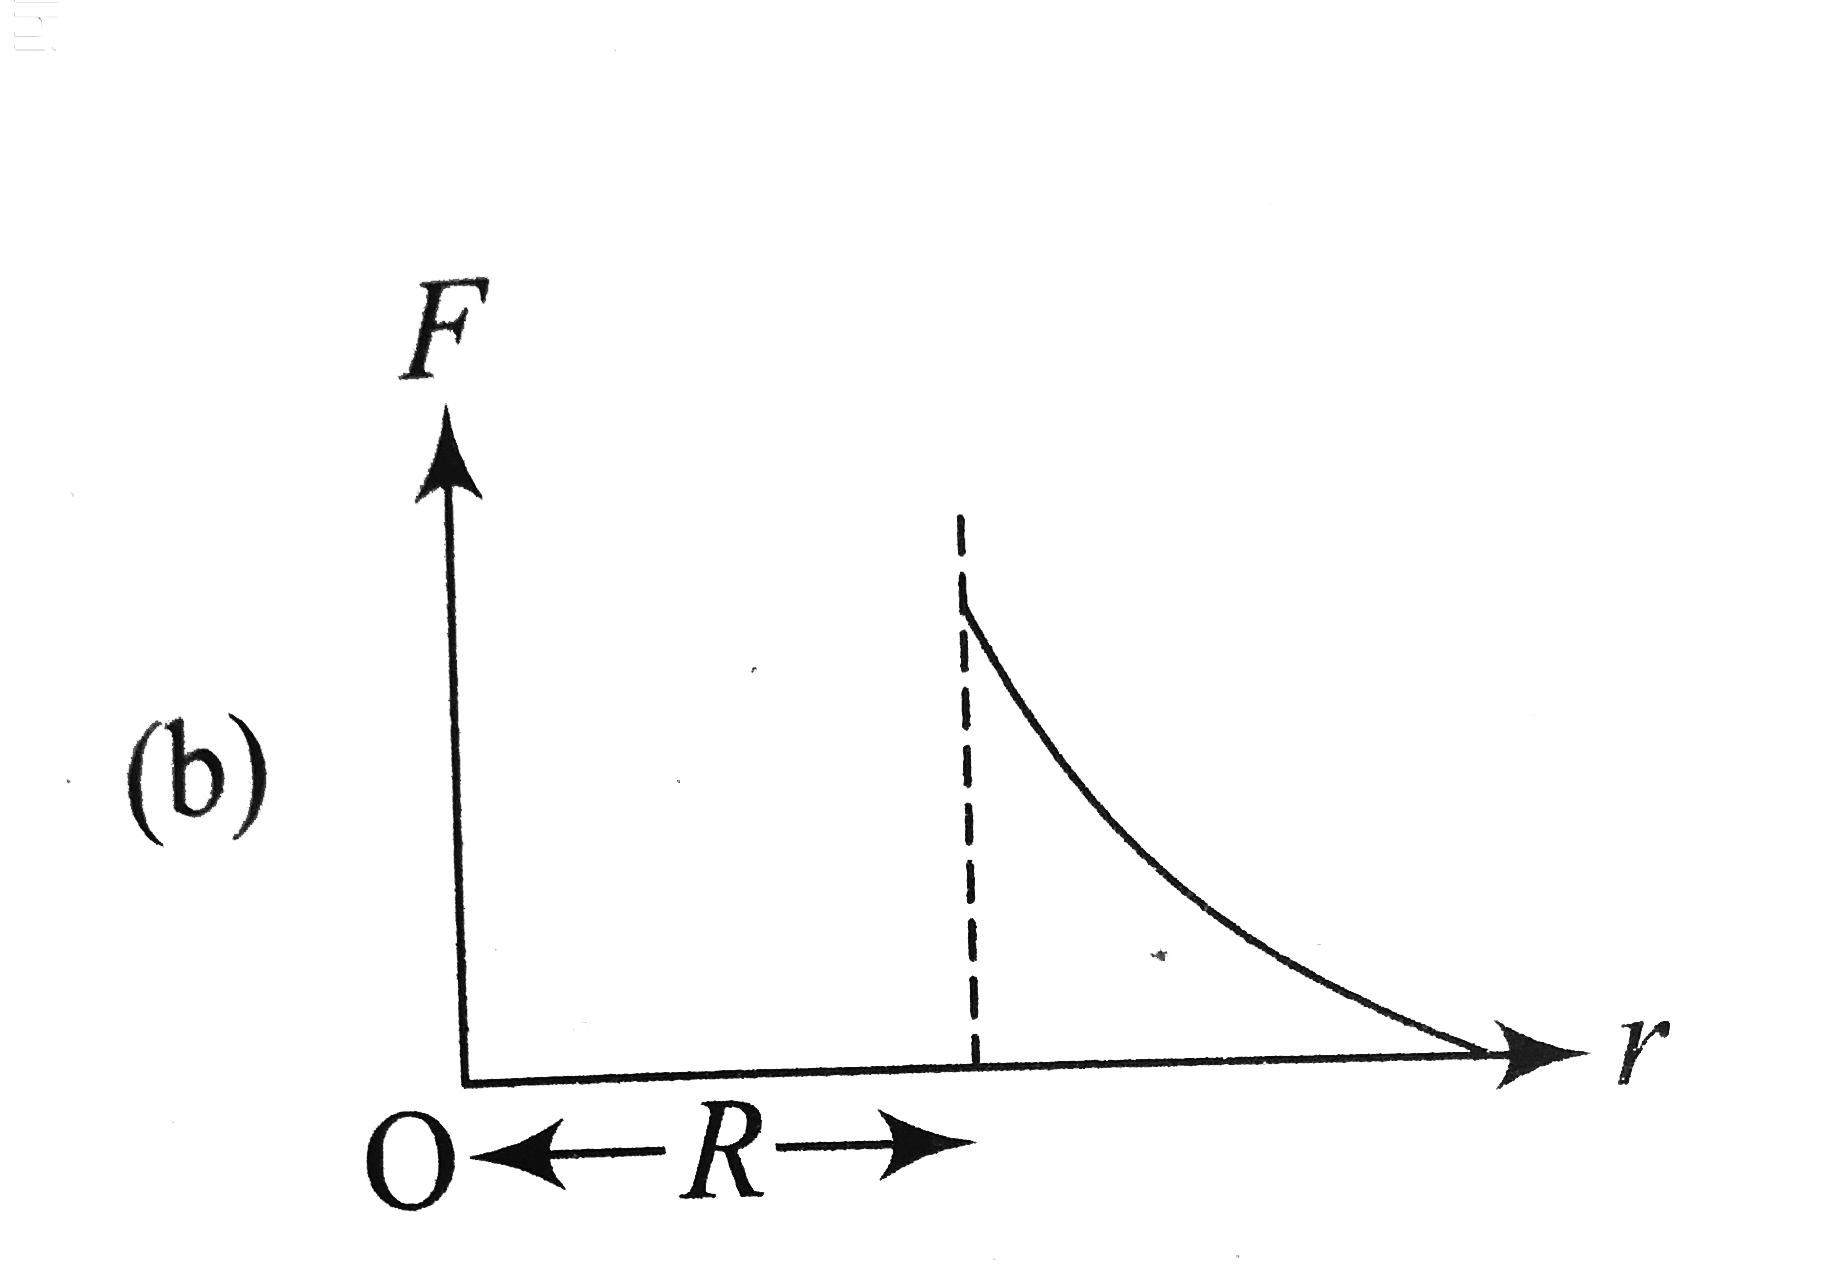 C
C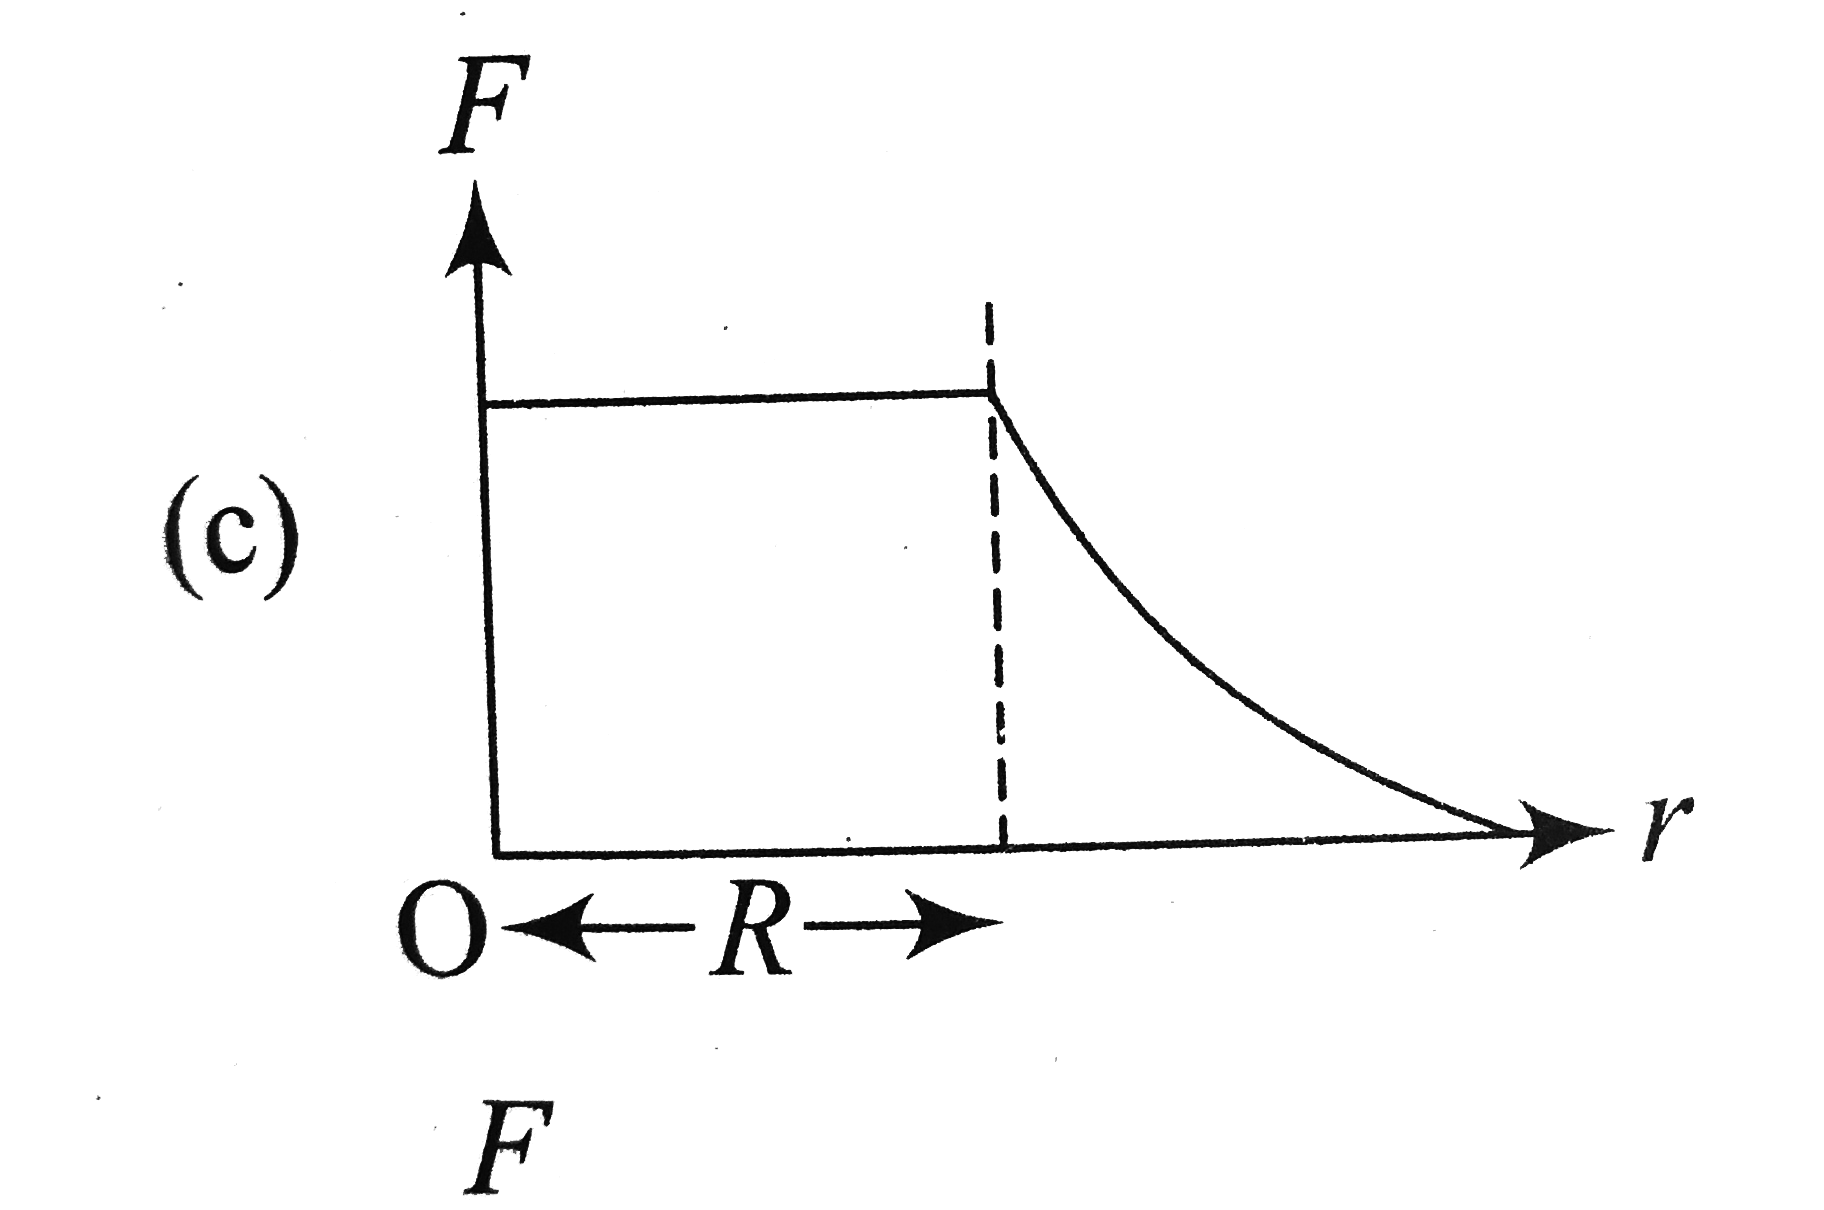 D
D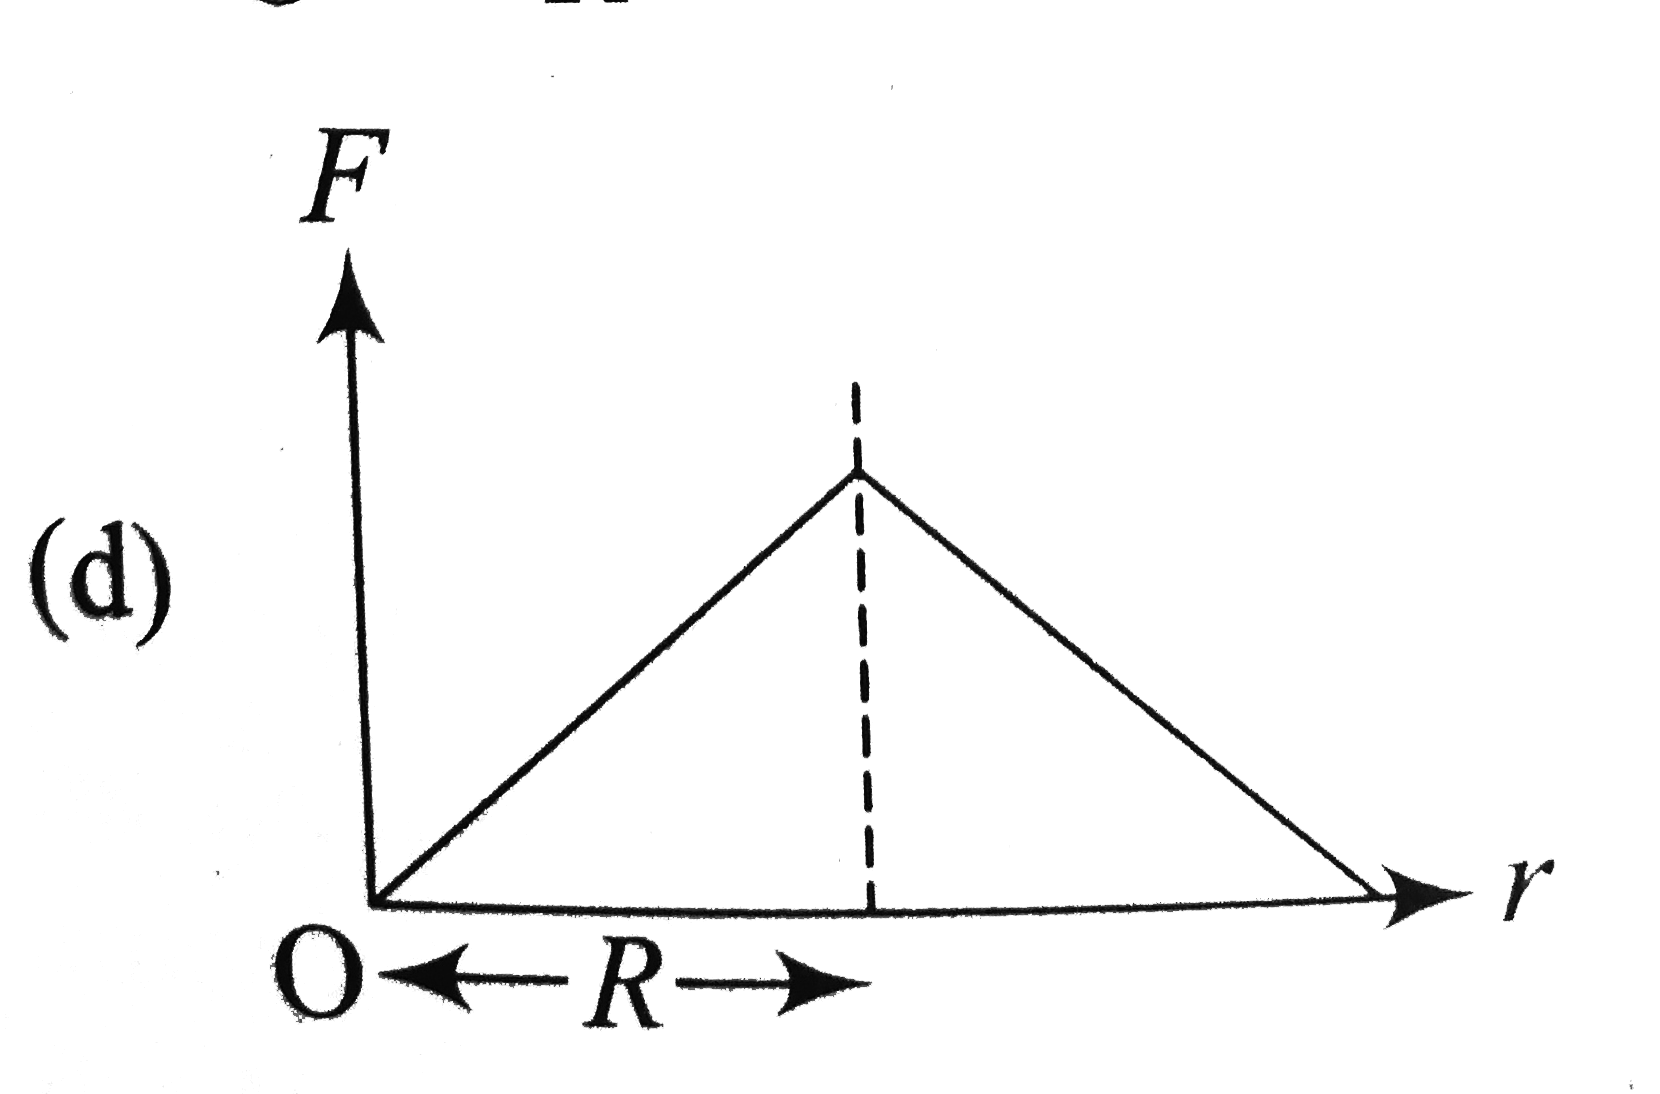
Which one of t he following plots represents the variation of gravitational field of a particle with distance r due to thin spherical shell of radius R ?
View SolutionWhich one of the following graphs represents correctly represent the variation of the gravitational field (E) with the distance (r) from the centre of a spherical shell of mass M radius R ?
View SolutionConsider a uniform spherical volume charge distribution of radius R. Which of the following graphs correctly represents the magnitude of the electric field E as a distance r from the center of the sphere ?
View SolutionA metallic spherical shell of radius R has a charge -Q on it. A point charge +Q is placed at the centre of the shell. Which of the graphs shown below may correctly represent the variation of electric field E with distance r from the centre of shell ?
View SolutionWhich graph best represents the variation of electric potential as a function of distance from the centre of a uniformly charged solid sphere of charge of radius R ?
View Solution
