A ball is thrown vertically upwards. Which of the following plots represent the speed graph of the ball during its flight if the air resistence is not ignored?
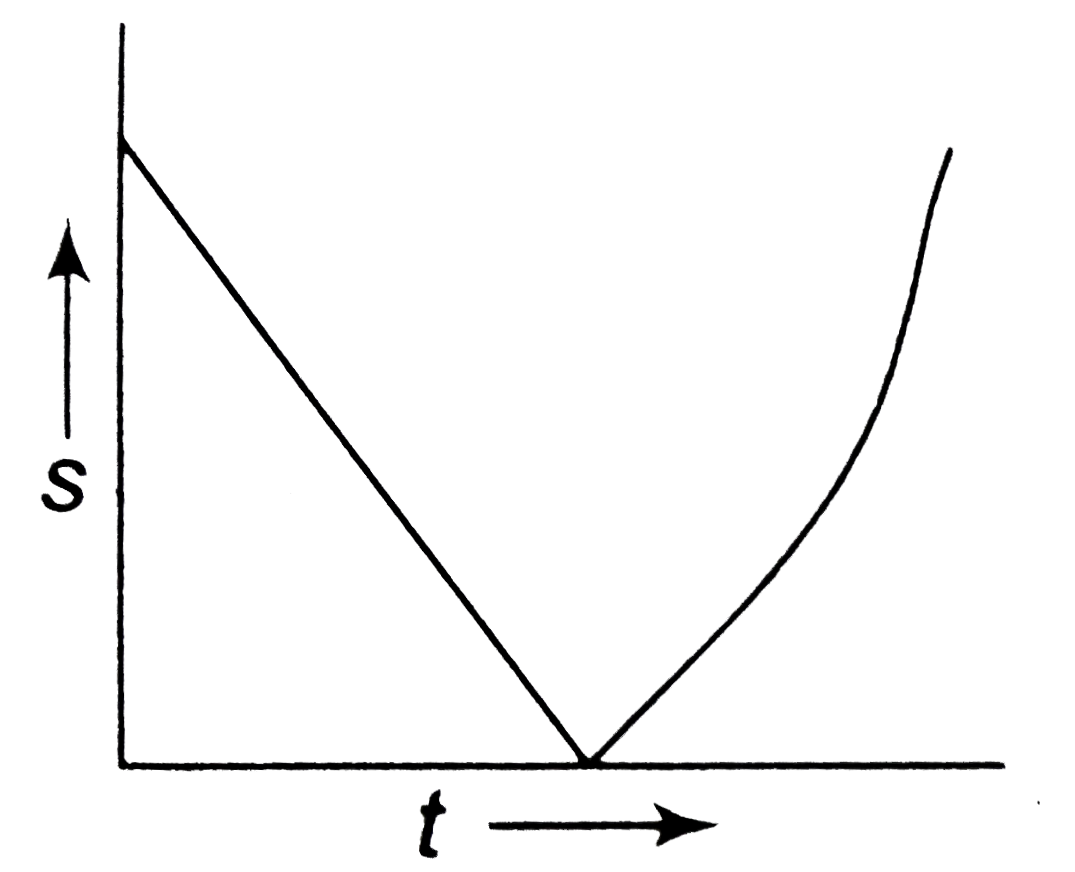
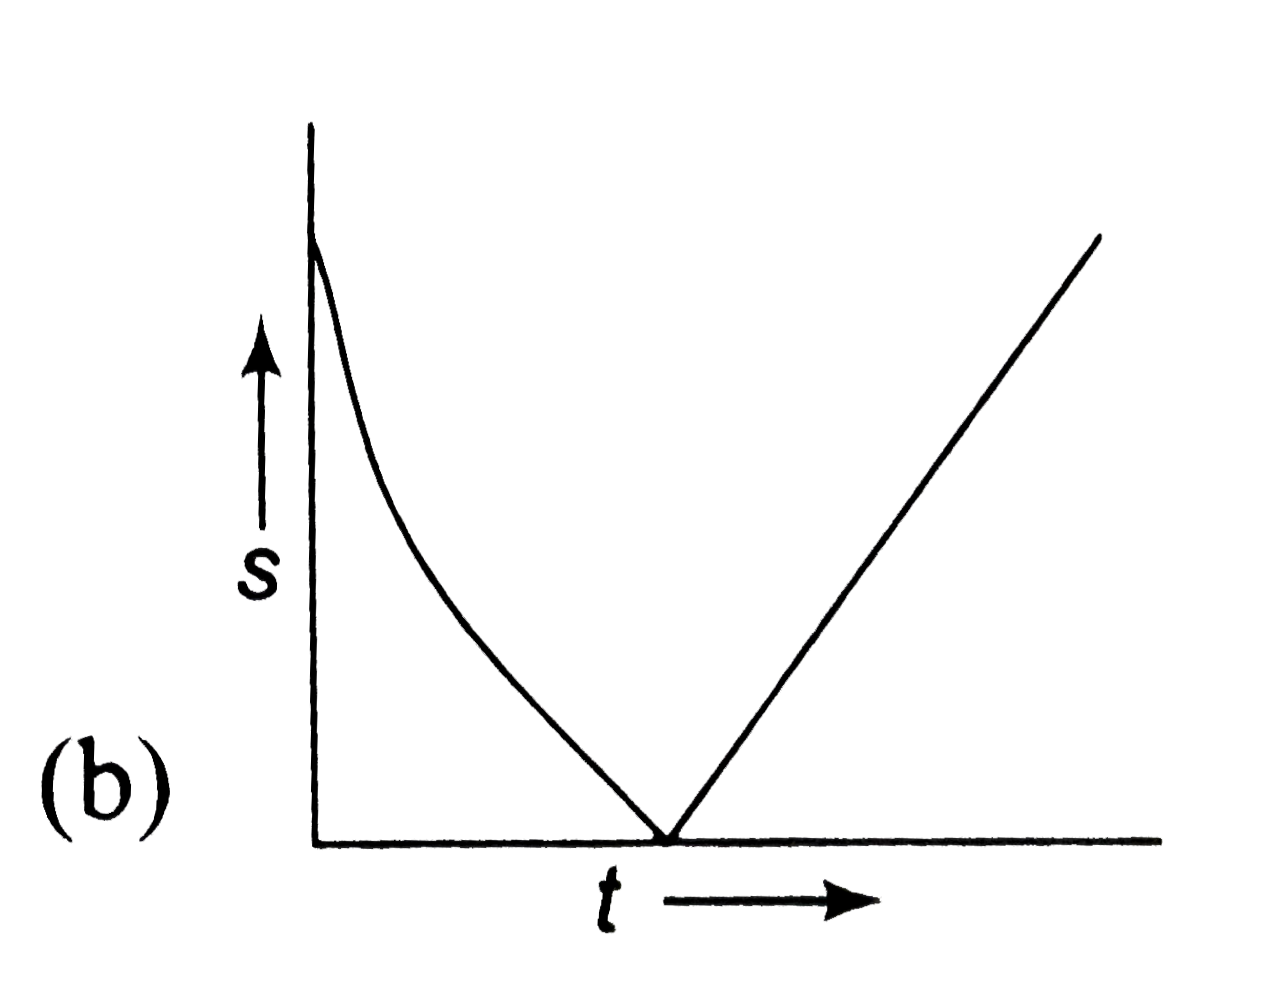
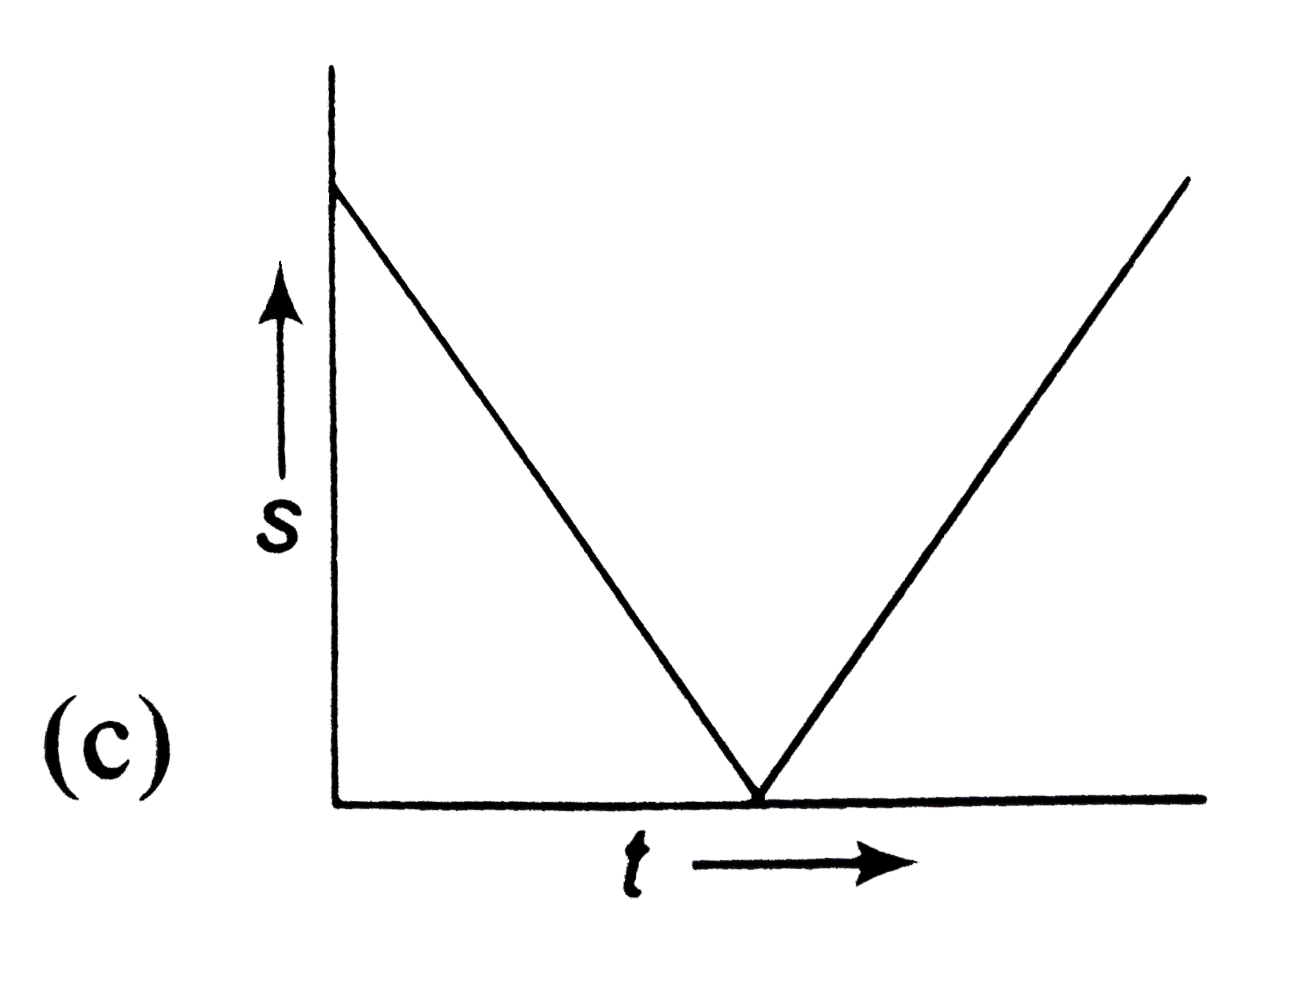
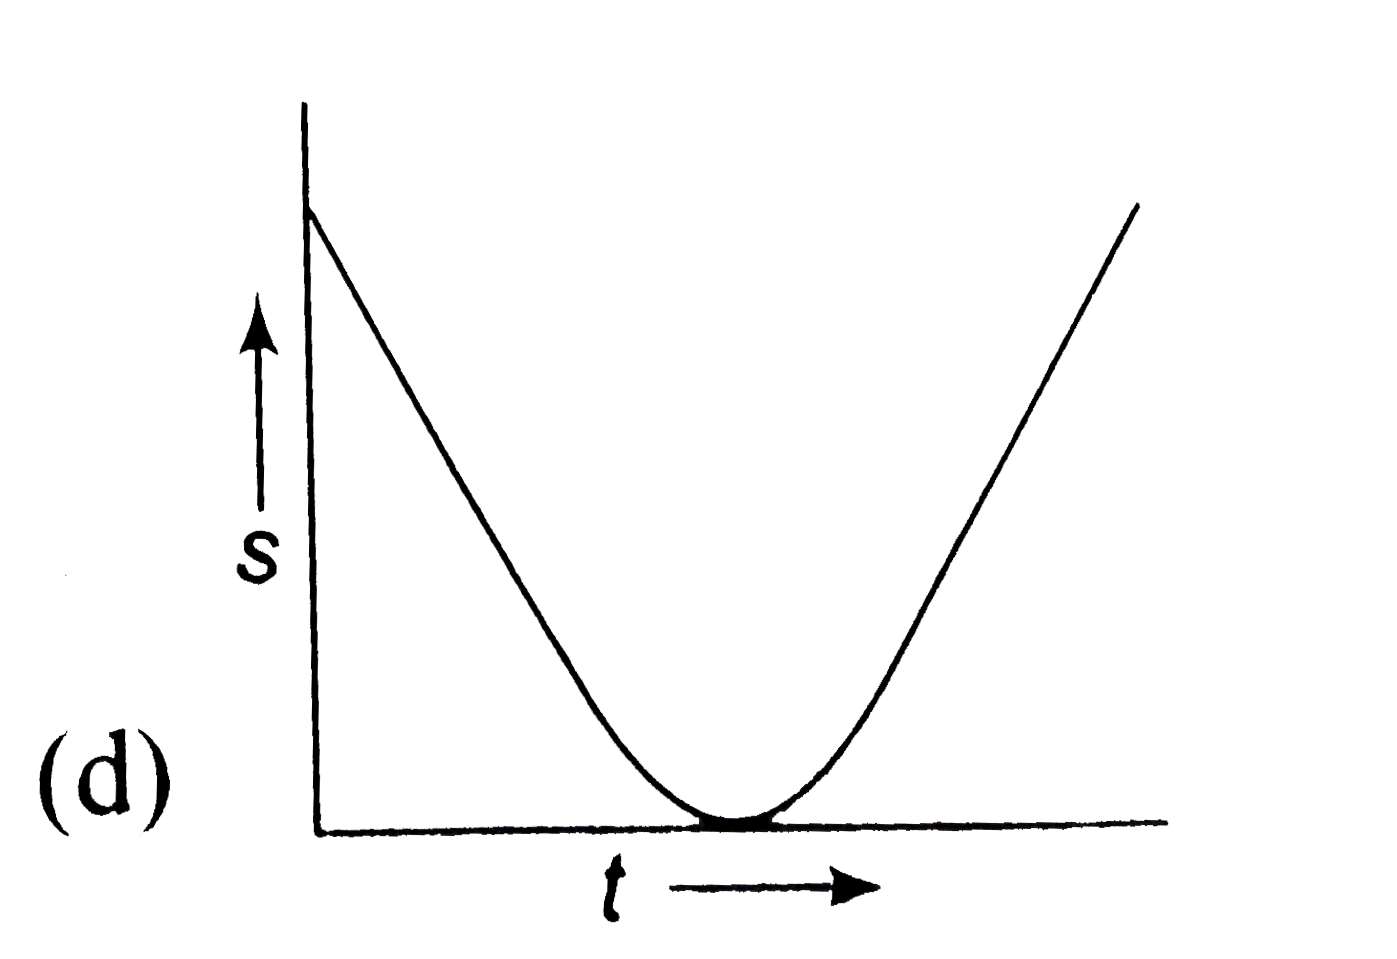
The correct Answer is:d
To solve the problem of determining which speed graph represents the motion of a ball thrown vertically upwards considering air resistance, we can follow these steps:
Step 1: Understand the Motion of the Ball
When a ball is thrown vertically upwards, it will initially move upwards, slow down due to gravity, and eventually come to a stop at its peak height before falling back down. The speed will be zero at the peak.
Step 2: Consider the Effect of Air Resistance
In the absence of air resistance, the speed would decrease uniformly as the ball rises and increase uniformly as it falls. However, with air resistance, the speed will not follow this linear pattern. Air resistance opposes the motion, which means:
- As the ball rises, it will slow down more quickly than it would without air resistance.
- As the ball falls, it will accelerate less than it would without air resistance.
Step 3: Analyze the Speed Graph
- Upward Motion: The speed will decrease more rapidly than in the case without air resistance. The graph will show a curve that approaches zero speed more steeply.
- Peak: At the peak, the speed is zero.
- Downward Motion: The speed will increase, but not as steeply as it would without air resistance. The graph will show a curve that rises less steeply than it falls in the absence of air resistance.
Step 4: Identify the Correct Graph
Given the characteristics of the speed graph with air resistance:
- The upward curve will be steeper as it approaches zero.
- The downward curve will be less steep than the upward curve.
Conclusion
The correct graph that represents the speed of the ball during its flight, considering air resistance, will show a steep decrease in speed as it rises and a less steep increase in speed as it falls back down.
When a ball is thrown vertically upwards, it will initially move upwards, slow down due to gravity, and eventually come to a stop at its peak height before falling back down. The speed will be zero at the peak.
In the absence of air resistance, the speed would decrease uniformly as the ball rises and increase uniformly as it falls. However, with air resistance, the speed will not follow this linear pattern. Air resistance opposes the motion, which means:
- As the ball rises, it will slow down more quickly than it would without air resistance.
- As the ball falls, it will accelerate less than it would without air resistance.
- Upward Motion: The speed will decrease more rapidly than in the case without air resistance. The graph will show a curve that approaches zero speed more steeply.
- Peak: At the peak, the speed is zero.
- Downward Motion: The speed will increase, but not as steeply as it would without air resistance. The graph will show a curve that rises less steeply than it falls in the absence of air resistance.
Given the characteristics of the speed graph with air resistance:
- The upward curve will be steeper as it approaches zero.
- The downward curve will be less steep than the upward curve.
The correct graph that represents the speed of the ball during its flight, considering air resistance, will show a steep decrease in speed as it rises and a less steep increase in speed as it falls back down.
Topper's Solved these Questions
- MOCK TESTBOOK - A2ZCHAPTER - MOCK TESTEXERCISE - General Kinematics
30 Videos
- MOCK TESTBOOK - A2ZCHAPTER - MOCK TESTEXERCISE - Motion With Constant Acceleration
15 Videos
- KINETIC THEORY OF GASES AND THERMODYNAMICSBOOK - A2ZCHAPTER - KINETIC THEORY OF GASES AND THERMODYNAMICSEXERCISE - Chapter Test
29 Videos
- MOTION IN TWO DIMENSIONBOOK - A2ZCHAPTER - MOTION IN TWO DIMENSIONEXERCISE - Chapter Test
29 Videos
Similar Questions
Knowledge Check
A ball is thrown vertically upwards. Which of the following plots represents the speed-time graph of the ball during its height if the air resistance is not ingnored ?
A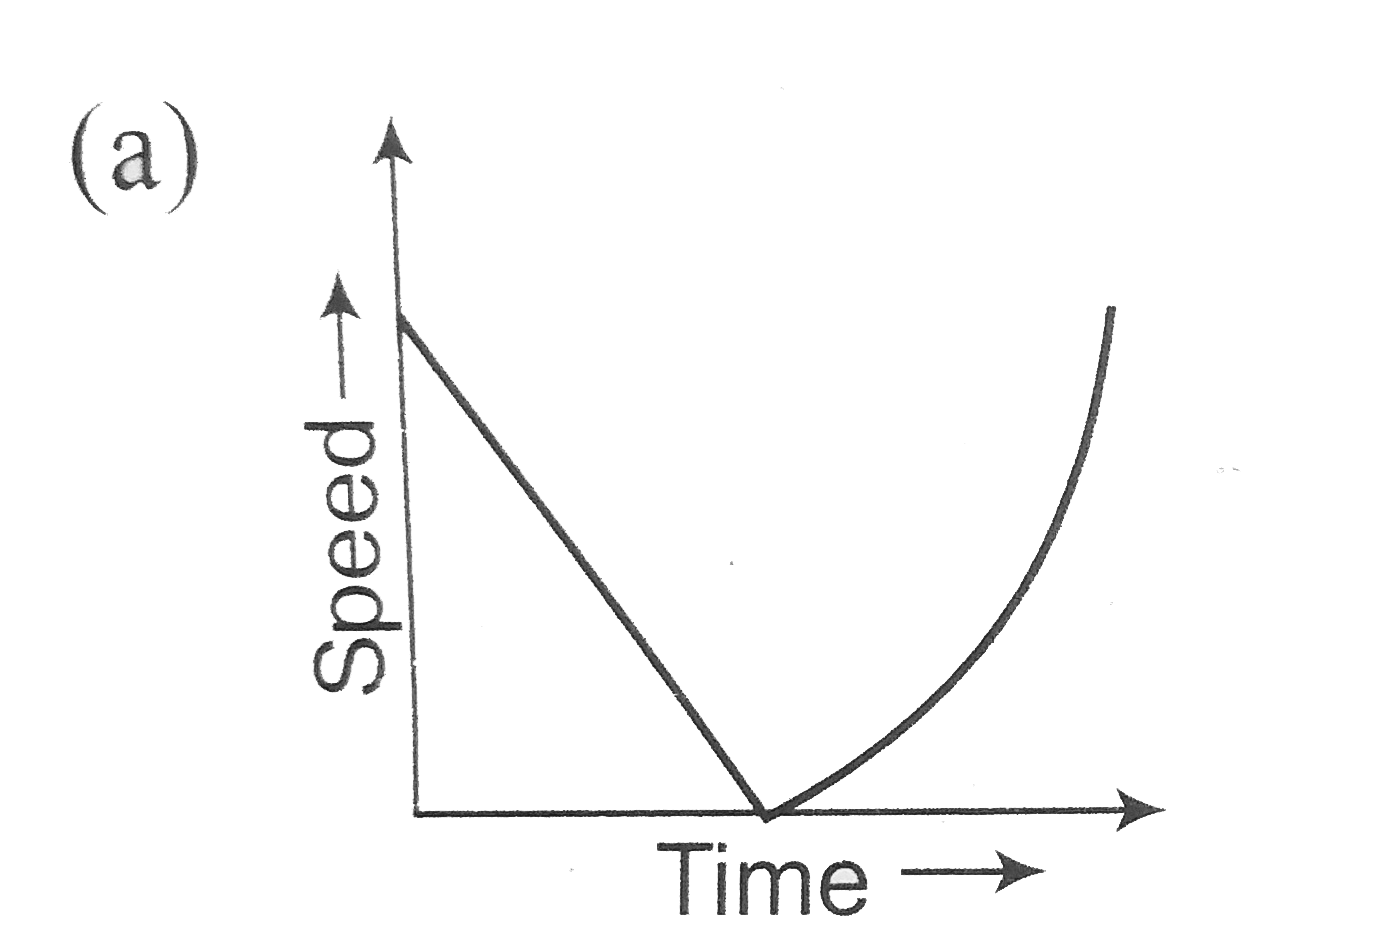 .B
.B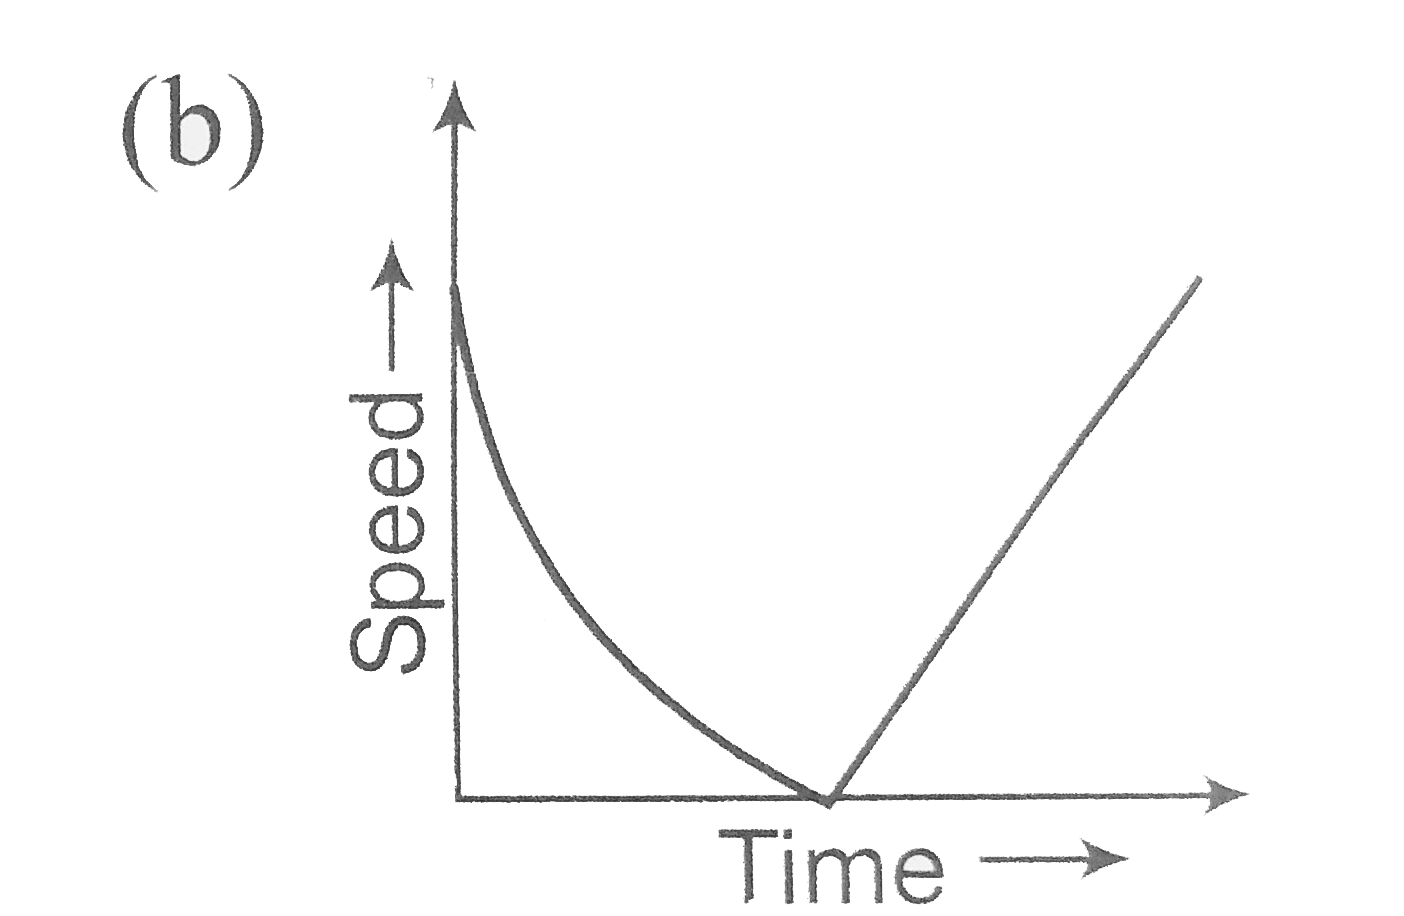 .C
.C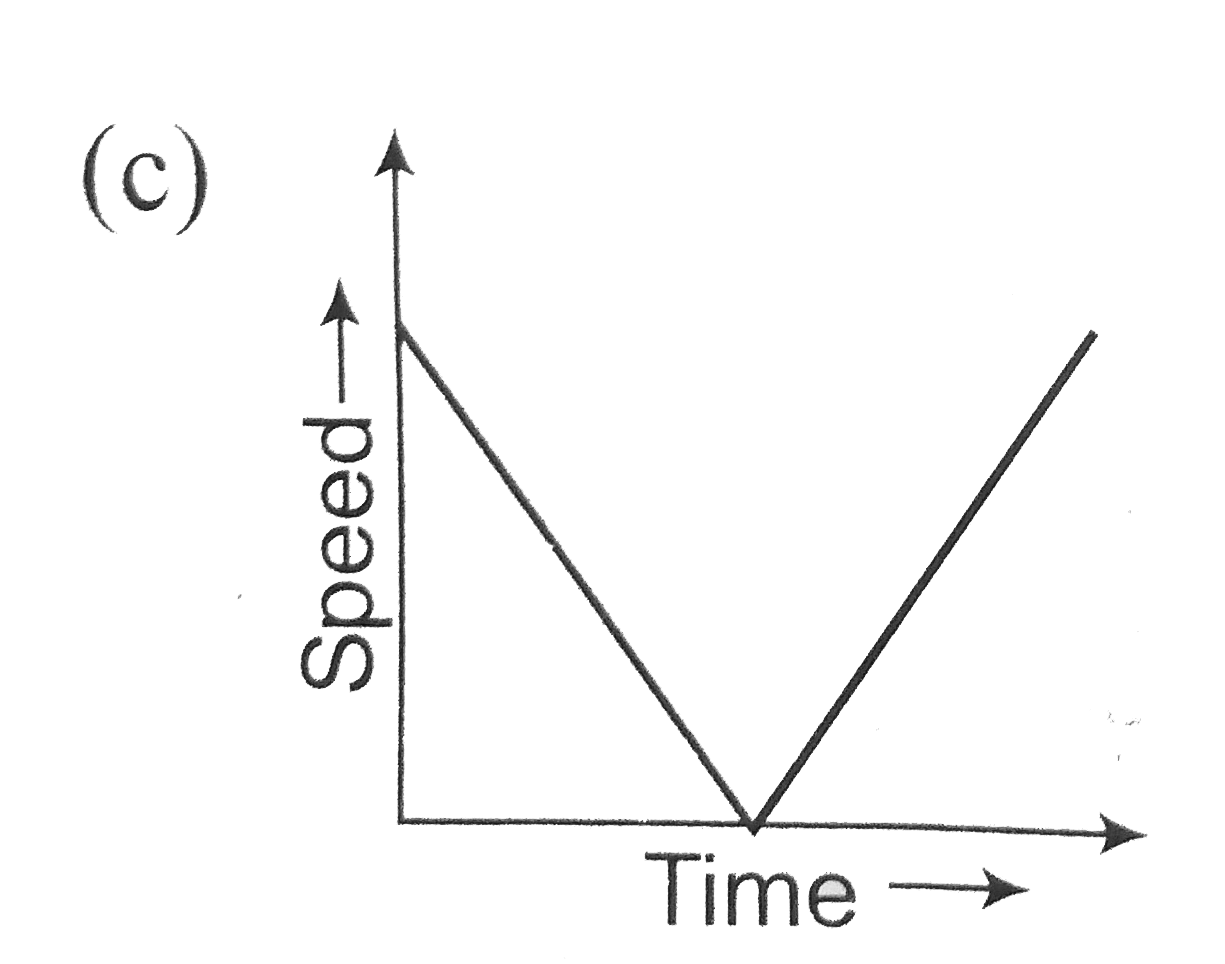 .D
.D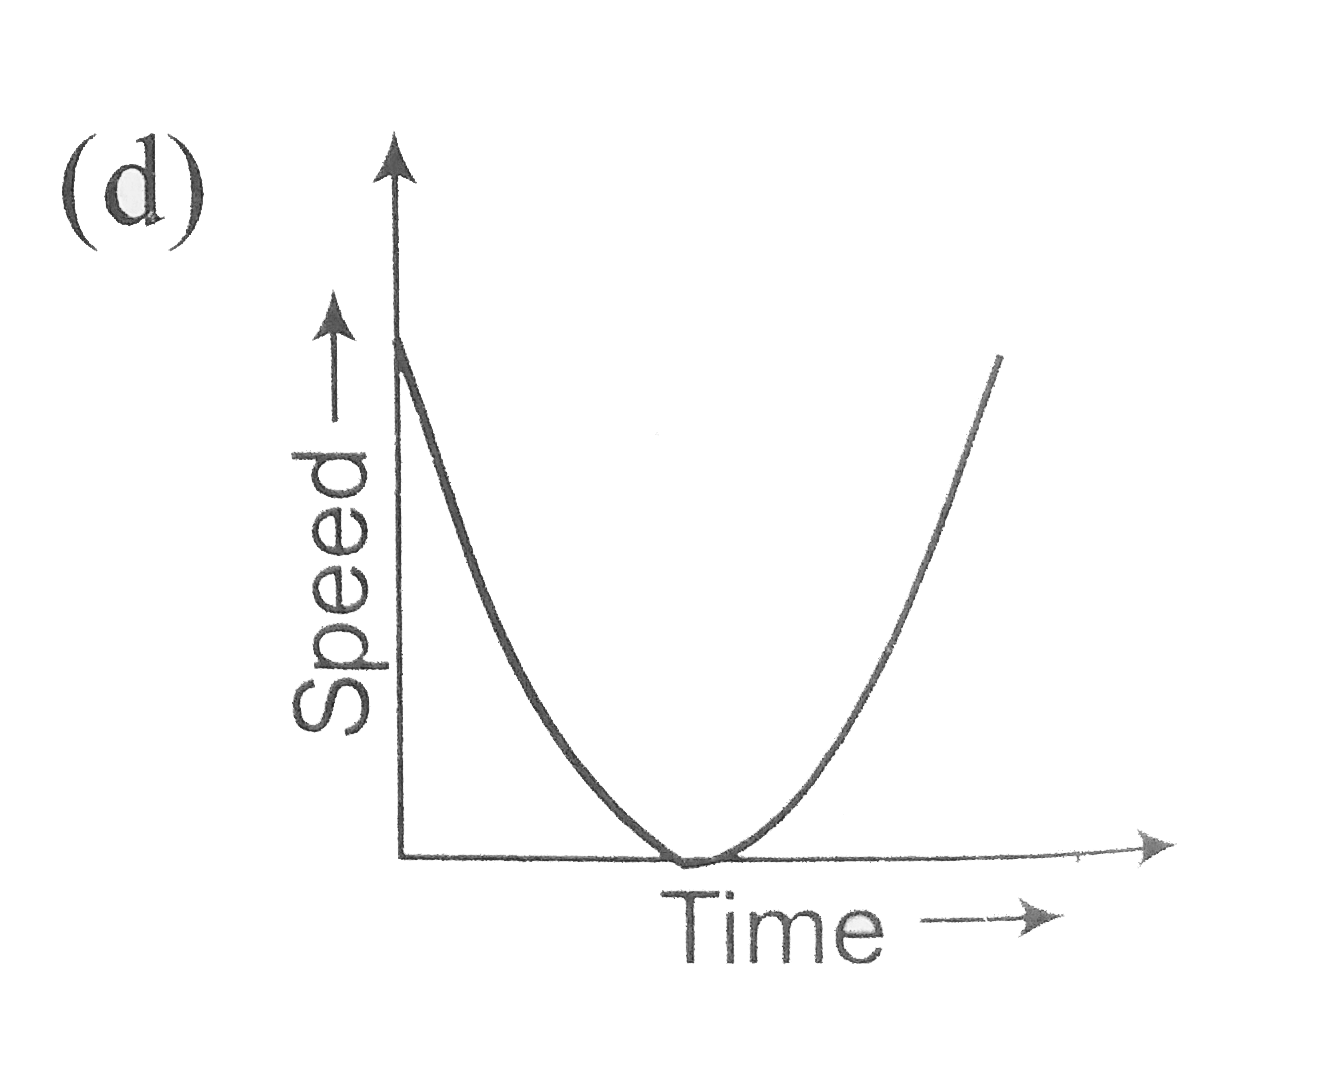 .
.A ball is thrown vertically upwards. Which of the following graph/graphs represent velocity time graph of the ball during its flight ( air resistance is neglected).
A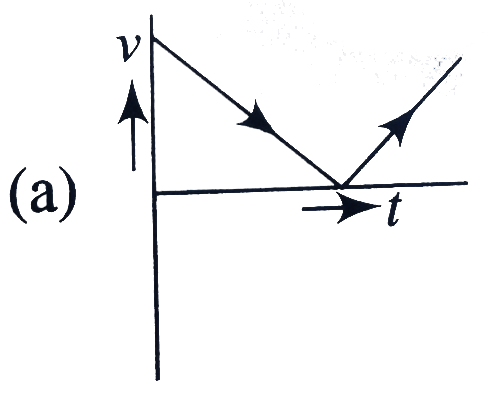 B
B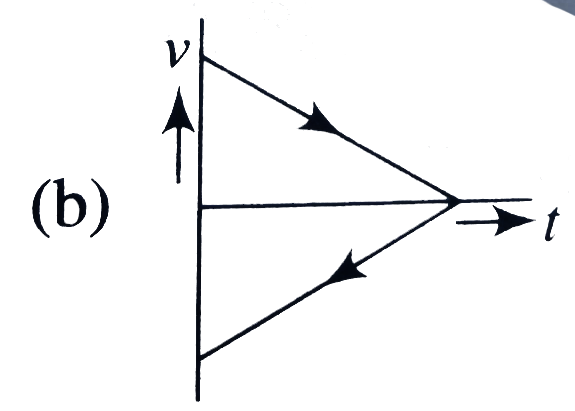 C
C D
D
A body nis thrown vertically upward. Which of the following graphs correctly/represents the velocity of the body with time?
A B
B C
C D
D
A ball is thrown vertically upward. What is the magnitude of velocity at the highest point ?
View SolutionA body is thrown vertically upwards. Which one of the following graphs correctly represent the velocity vs time?
View SolutionWhich of the following graphs show the v−t graph of a ball thrown upwards ?
View SolutionA ball is projected vertically up with an initial velocity. Which of the following graphs represents the KE of the ball?
View SolutionA ball is thrown vertically upwards under gravity. The velocity-time variation is represented by the graph
View Solution
