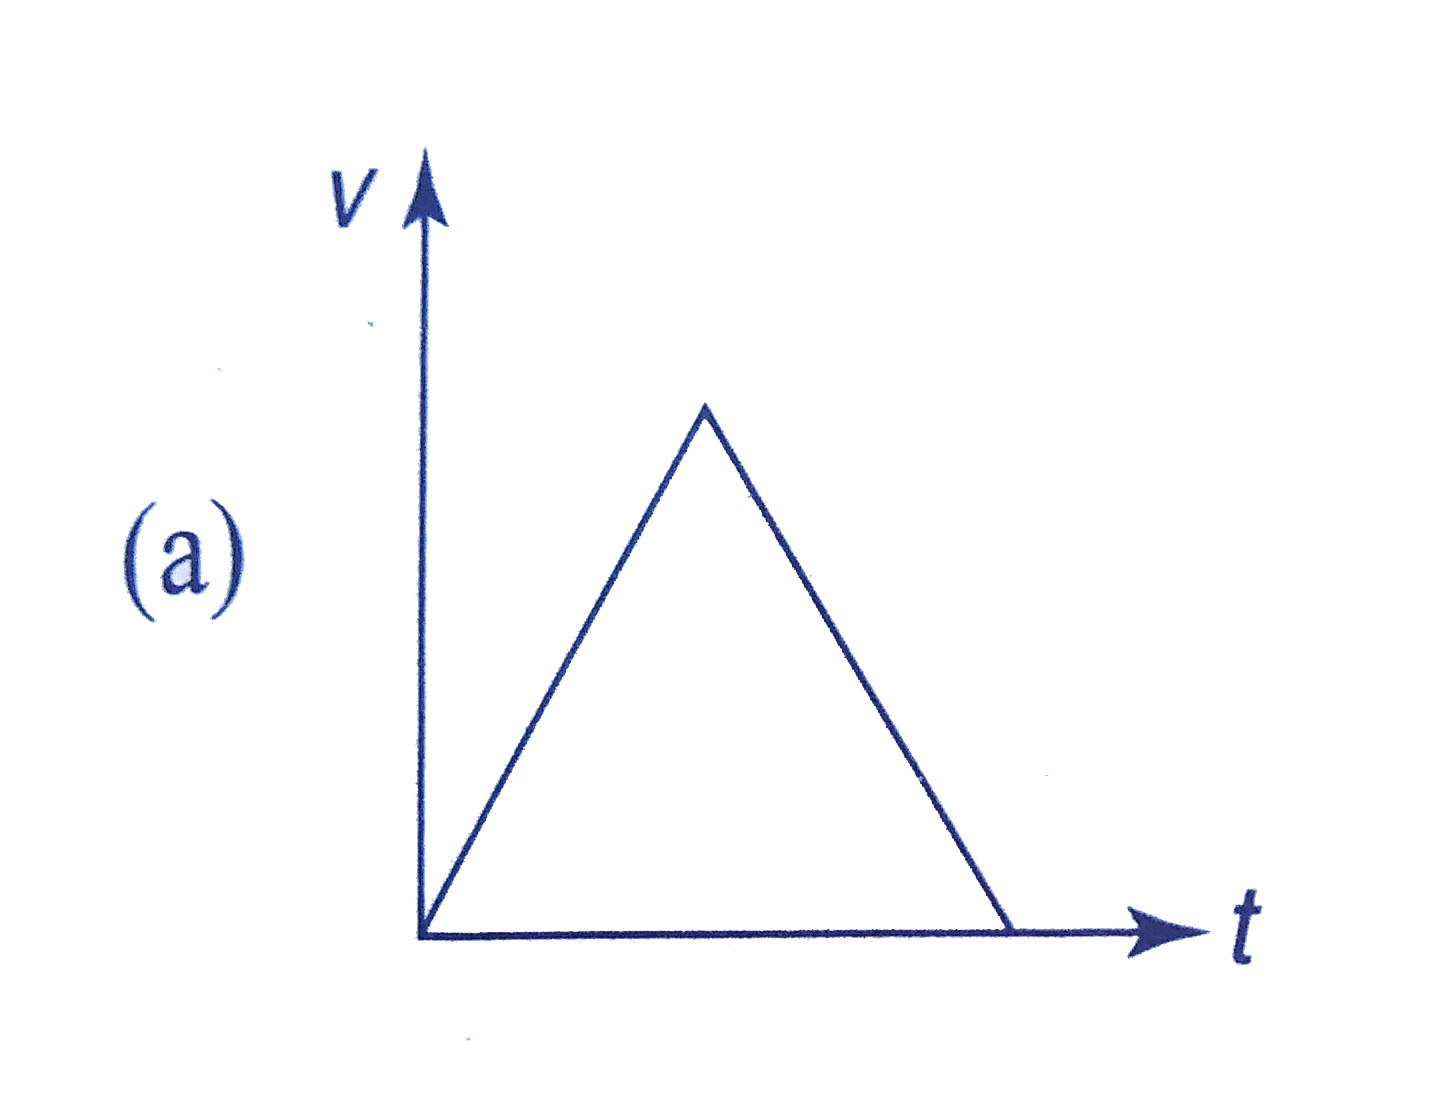
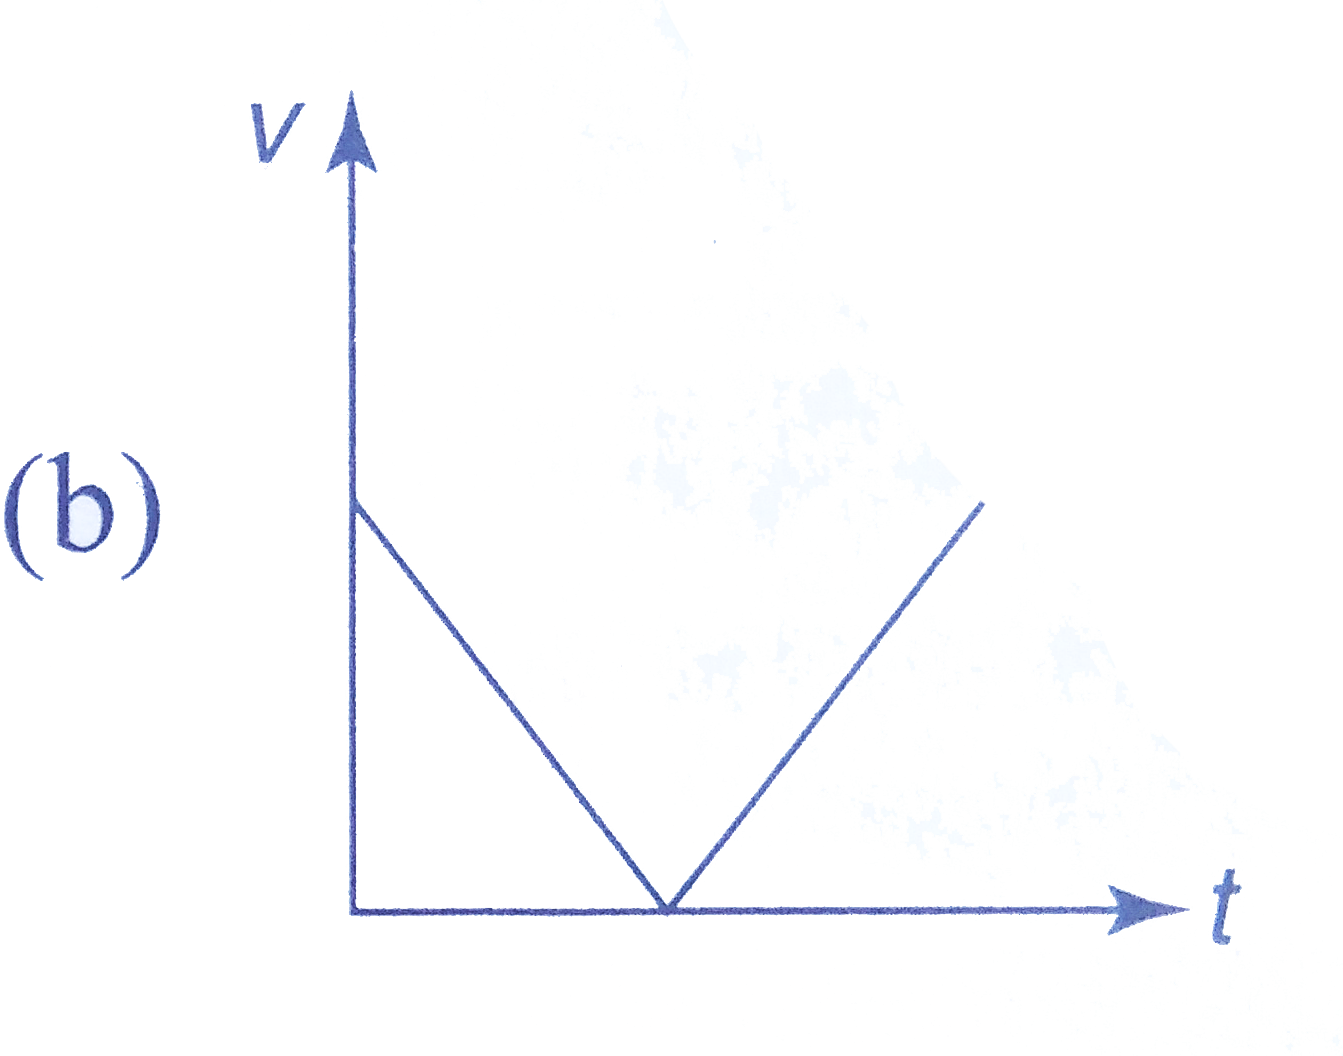
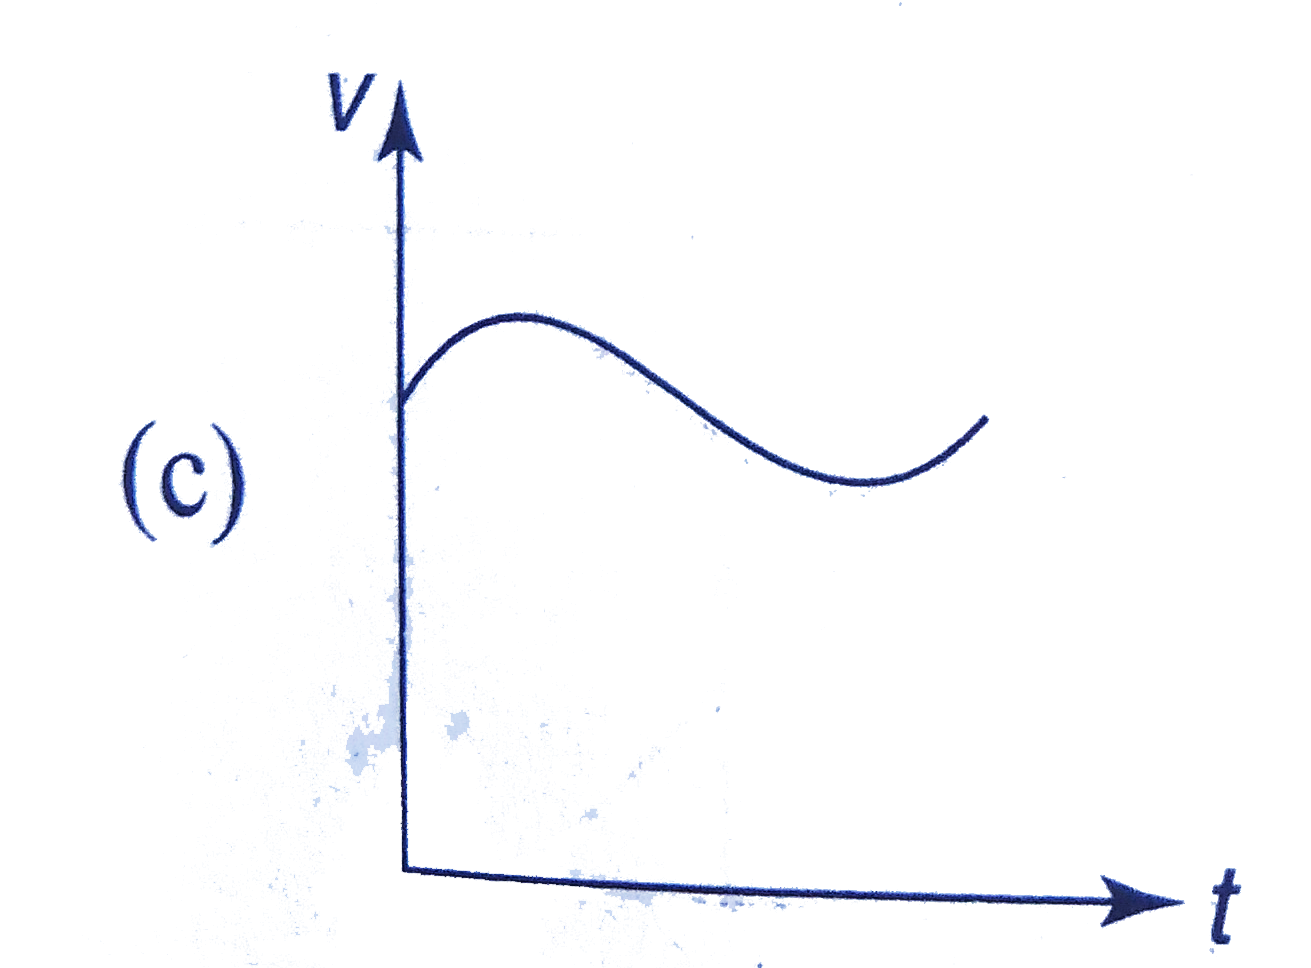
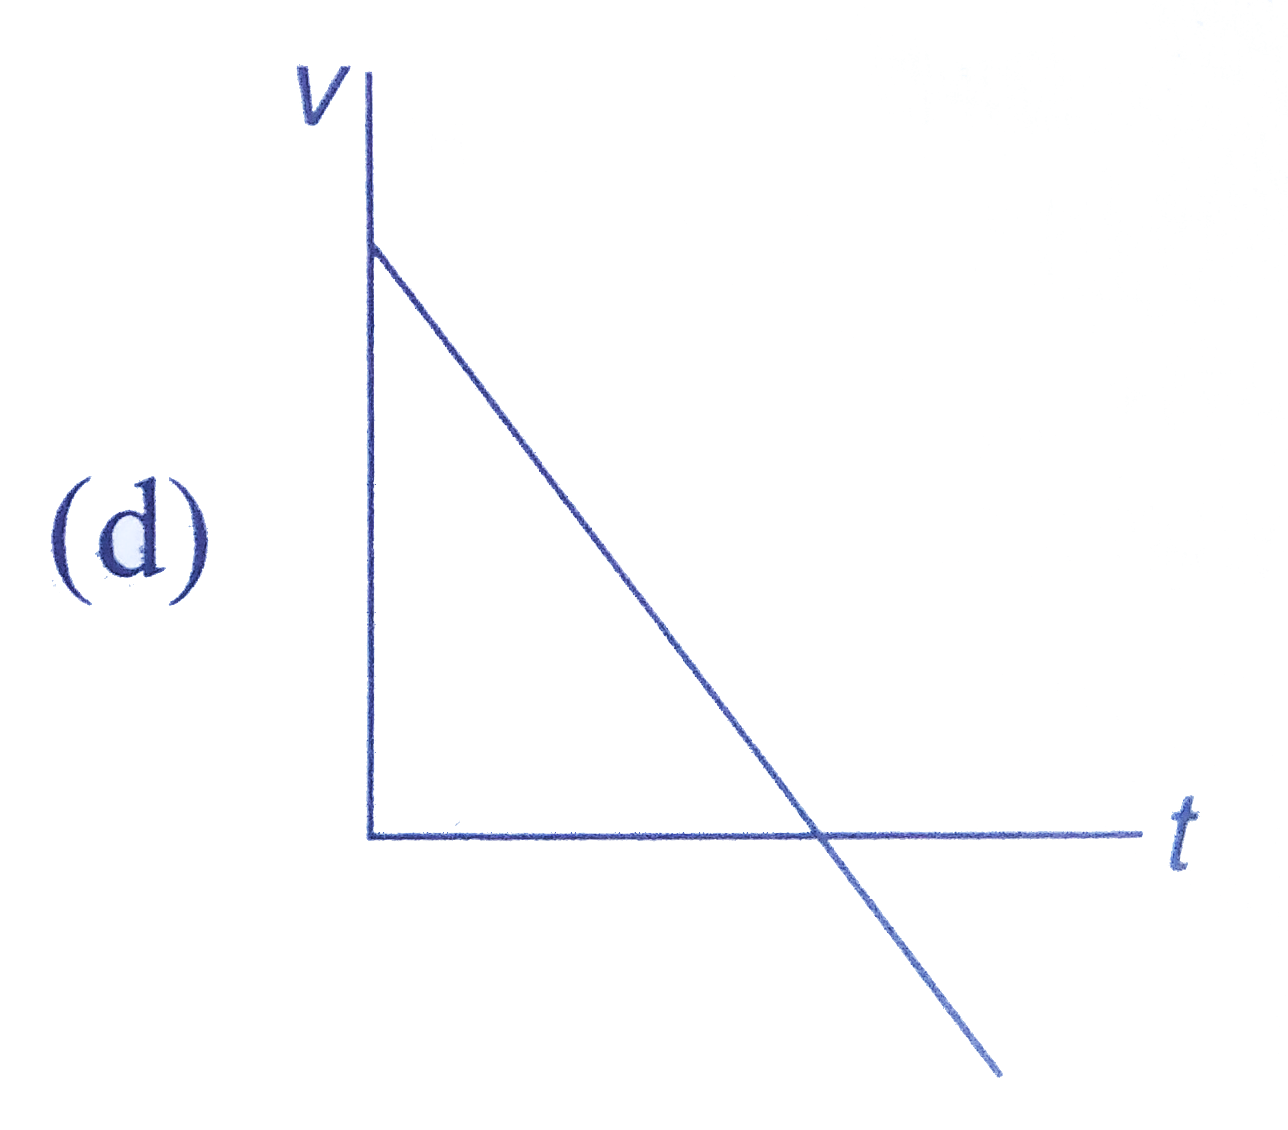
Which of the following graphs show the graph of a ball thrown upwards ?
 .
.
 .
.
 .
.
 .
.
The correct Answer is:D
As the ball goes up air its velocity goes on decreasing till reaches the top where its velocity becomes zero. After that velocity increases as it comes down in negative direction.
Topper's Solved these Questions
- GENERAL KINEMATICS AND MOTION IN ONE DIMENSIONBOOK - A2ZCHAPTER - GENERAL KINEMATICS AND MOTION IN ONE DIMENSIONEXERCISE - Problem Based On Mixed Concepts
30 Videos
- GENERAL KINEMATICS AND MOTION IN ONE DIMENSIONBOOK - A2ZCHAPTER - GENERAL KINEMATICS AND MOTION IN ONE DIMENSIONEXERCISE - Assertion Reasoning
20 Videos
- GENERAL KINEMATICS AND MOTION IN ONE DIMENSIONBOOK - A2ZCHAPTER - GENERAL KINEMATICS AND MOTION IN ONE DIMENSIONEXERCISE - Relative Motion In One Dimension
20 Videos
- FLUID MECHANICSBOOK - A2ZCHAPTER - FLUID MECHANICSEXERCISE - Chapter Test
29 Videos
- GRAVITATIONBOOK - A2ZCHAPTER - GRAVITATIONEXERCISE - Chapter Test
29 Videos
Similar Questions
Knowledge Check
The following graph shows the
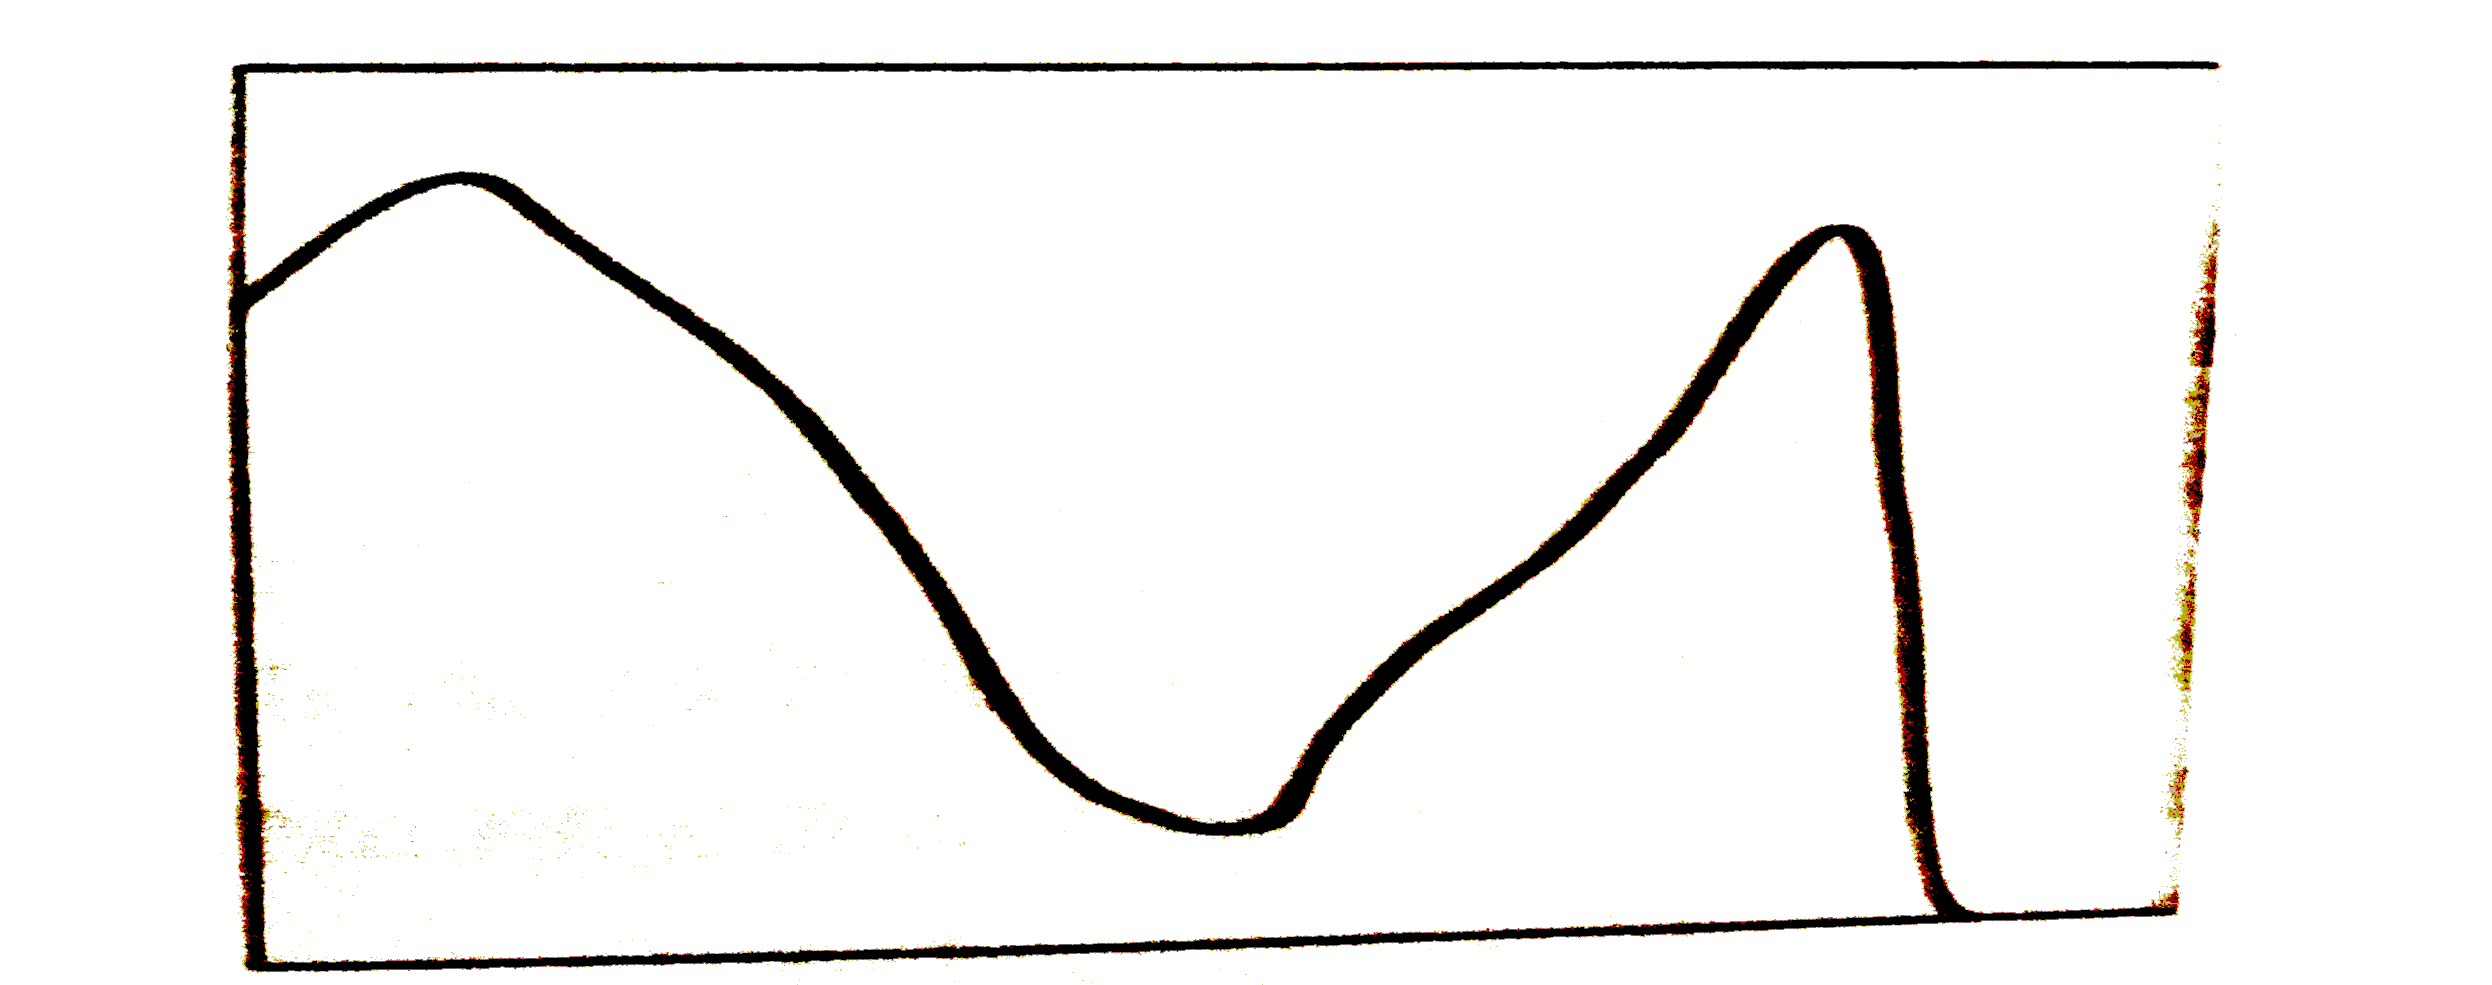 AAbsorption spectrum of chlorophyll aBAbsorption spectrum of chlorophyll bCAction spectrum of photosynthesisDBoth A and B
Which of the following graphs relates V and T?
A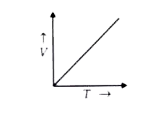 B
B C
C D
D
The following graph show that the reaction is:
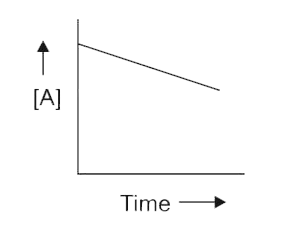 Azero orderBfirst orderCsecond orderDfractional order
A ball is thrown vertically upwards. Which of the following graph/graphs represent velocity time graph of the ball during its flight ( air resistance is neglected).
View SolutionA ball is thrown vertically upwards. Which of the following plots represent the speed graph of the ball during its flight if the air resistence is not ignored?
View SolutionA ball thrown vertically upward with initial velocity u. Which of the following graphs represent the velocity of ball correctly as function of time?
(Take upward direction as positive)
View SolutionA ball is thrown vertically upwards. Which of the following plots represents the speed-time graph of the ball during its height if the air resistance is not ingnored ?
View SolutionWhich of the following shows velocity (v) - time (t) graph for falling apple?
View Solution

