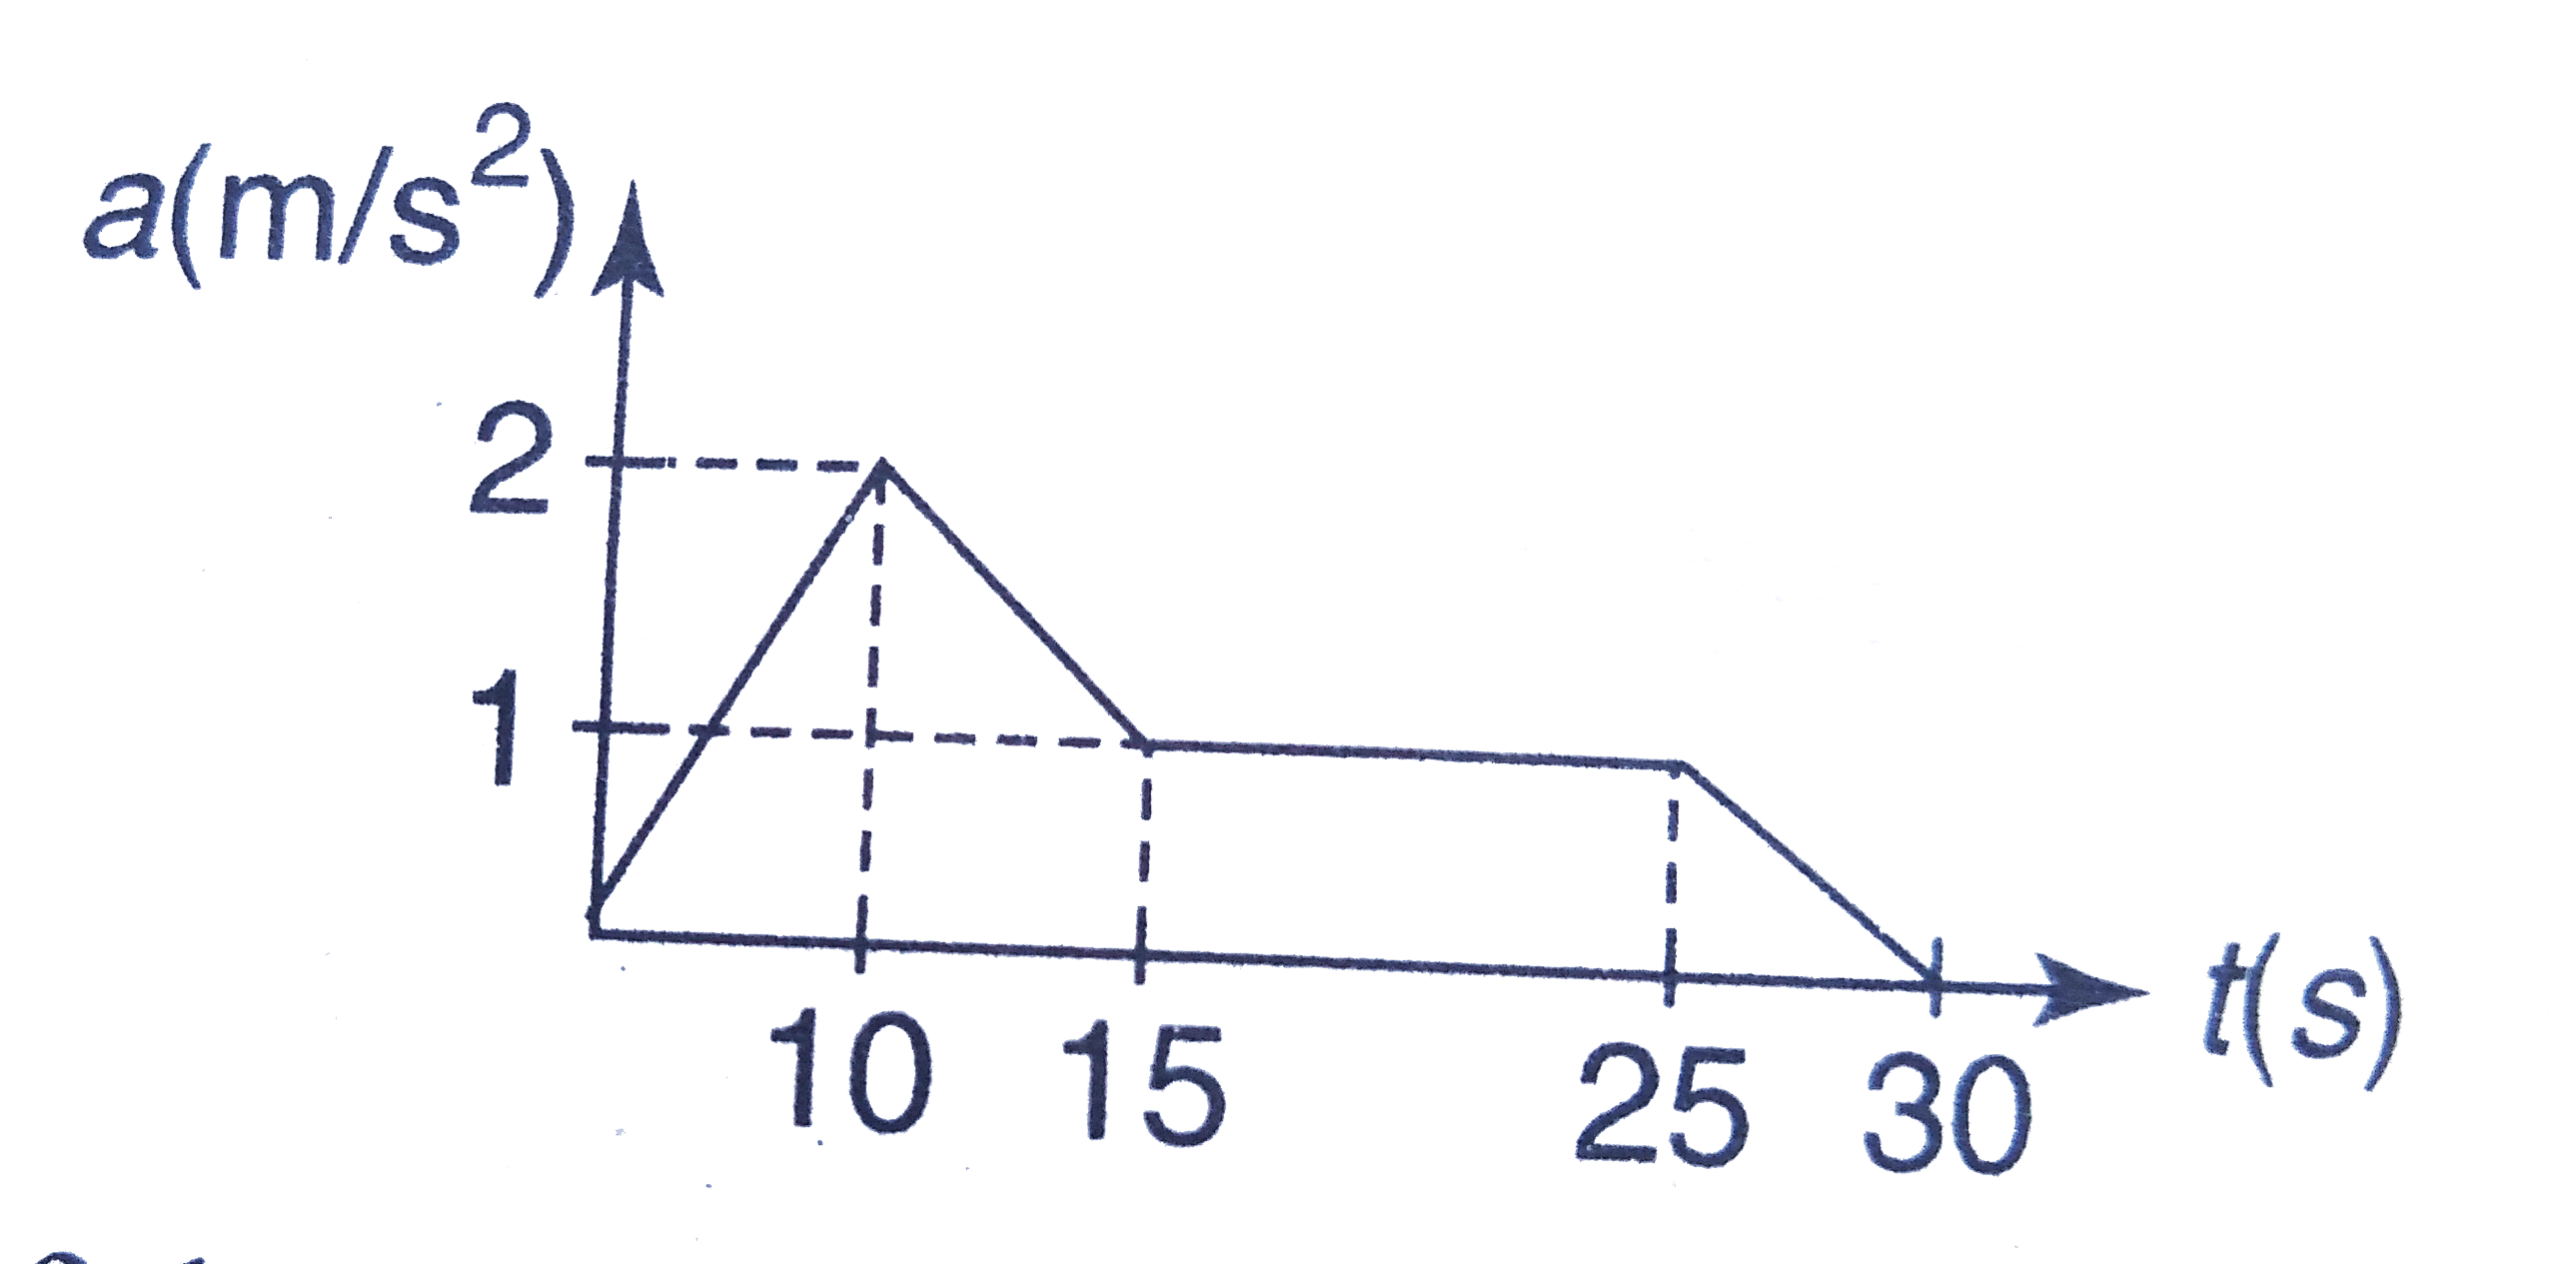
In figure shown, the graph shows the variation of acceleration of body with time t. The velcocity of the body at t=0 is zero. The velocity of the body at t=30s is.
30m/s
20m/s
40m/s
none
The correct Answer is:A
Area upto 30s : = 12×10×2+12(1+2)×5
+1×10+12×5×1=30m/s
⇒v=30m/s.
Topper's Solved these Questions
- GENERAL KINEMATICS AND MOTION IN ONE DIMENSIONBook:A2ZChapter:GENERAL KINEMATICS AND MOTION IN ONE DIMENSIONExercise:Problem Based On Mixed Concepts
Explore 30 Videos
- GENERAL KINEMATICS AND MOTION IN ONE DIMENSIONBook:A2ZChapter:GENERAL KINEMATICS AND MOTION IN ONE DIMENSIONExercise:Assertion Reasoning
Explore 20 Videos
- GENERAL KINEMATICS AND MOTION IN ONE DIMENSIONBook:A2ZChapter:GENERAL KINEMATICS AND MOTION IN ONE DIMENSIONExercise:Relative Motion In One Dimension
Explore 20 Videos
- FLUID MECHANICSBook:A2ZChapter:FLUID MECHANICSExercise:Chapter Test
Explore 29 Videos
- GRAVITATIONBook:A2ZChapter:GRAVITATIONExercise:Chapter Test
Explore 29 Videos
Similar Questions
Figure shows x-t graph of a particle. Find the Time T Such that the Average Velocity of the Particle During the Period 0 to T is Zero..

View SolutionAcceleration-time graph of a particle moving in a straight line is as shown in figure. At time t=0, velocity of the particle is zero. Find
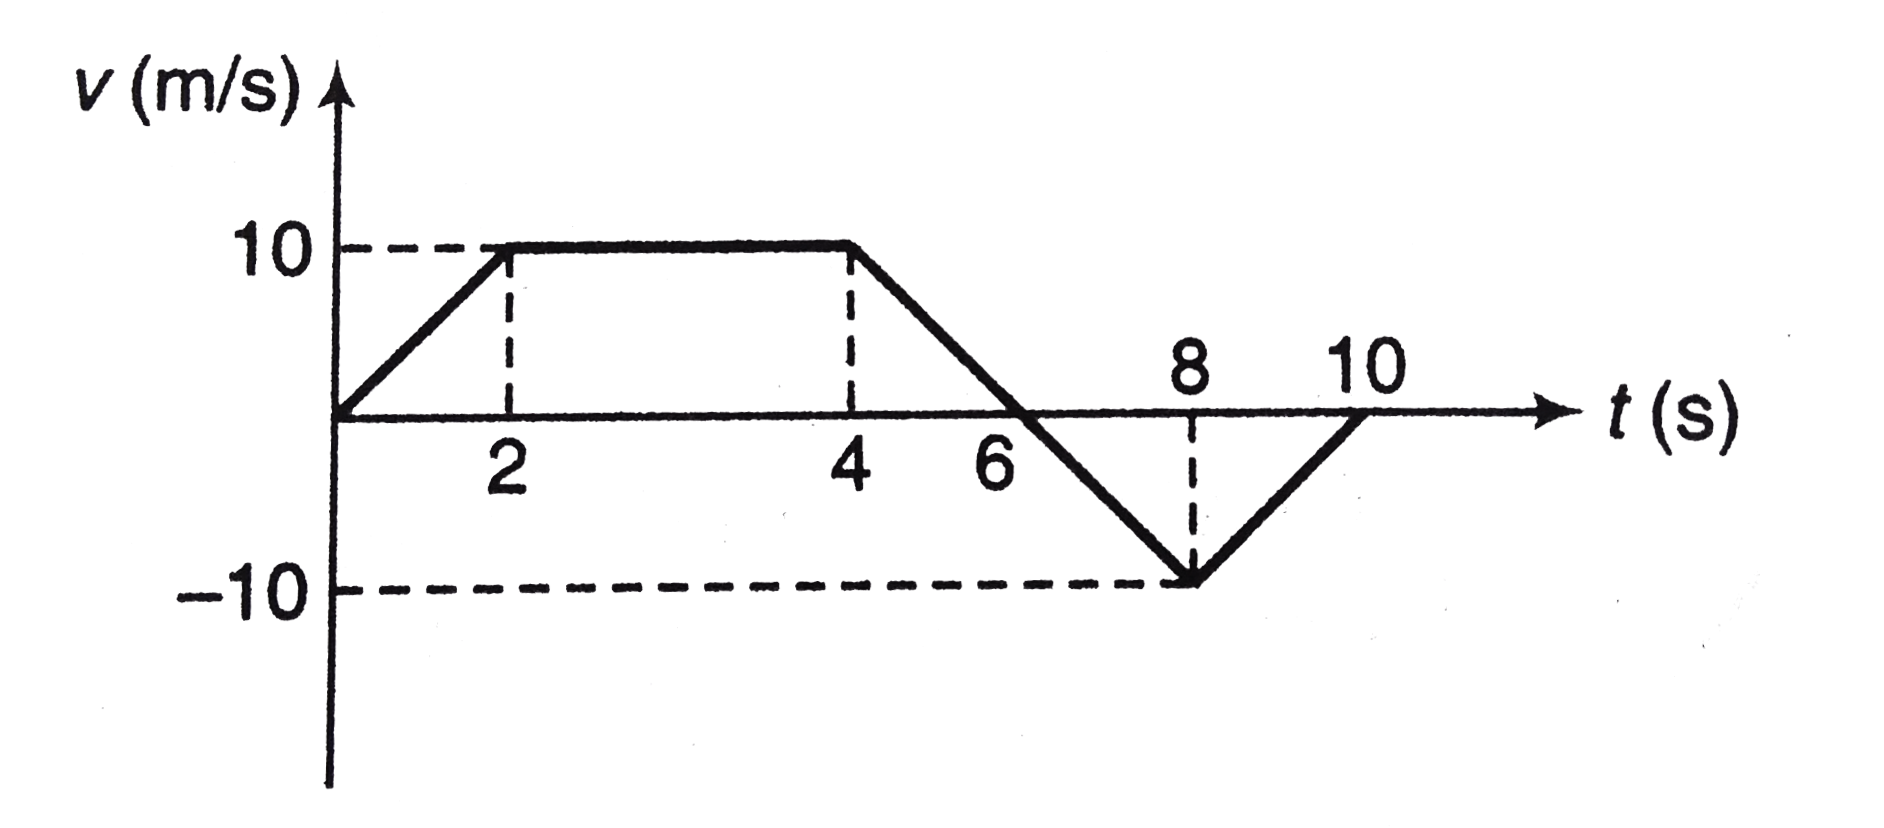
(a) average acceleration in a time interval from t=6s to t=12s,
(b) velocity of the particle at t=14s.
View Solution
Knowledge Check
The velocity-time graph of a body is shown in .
The displacement of the body in 8s is.
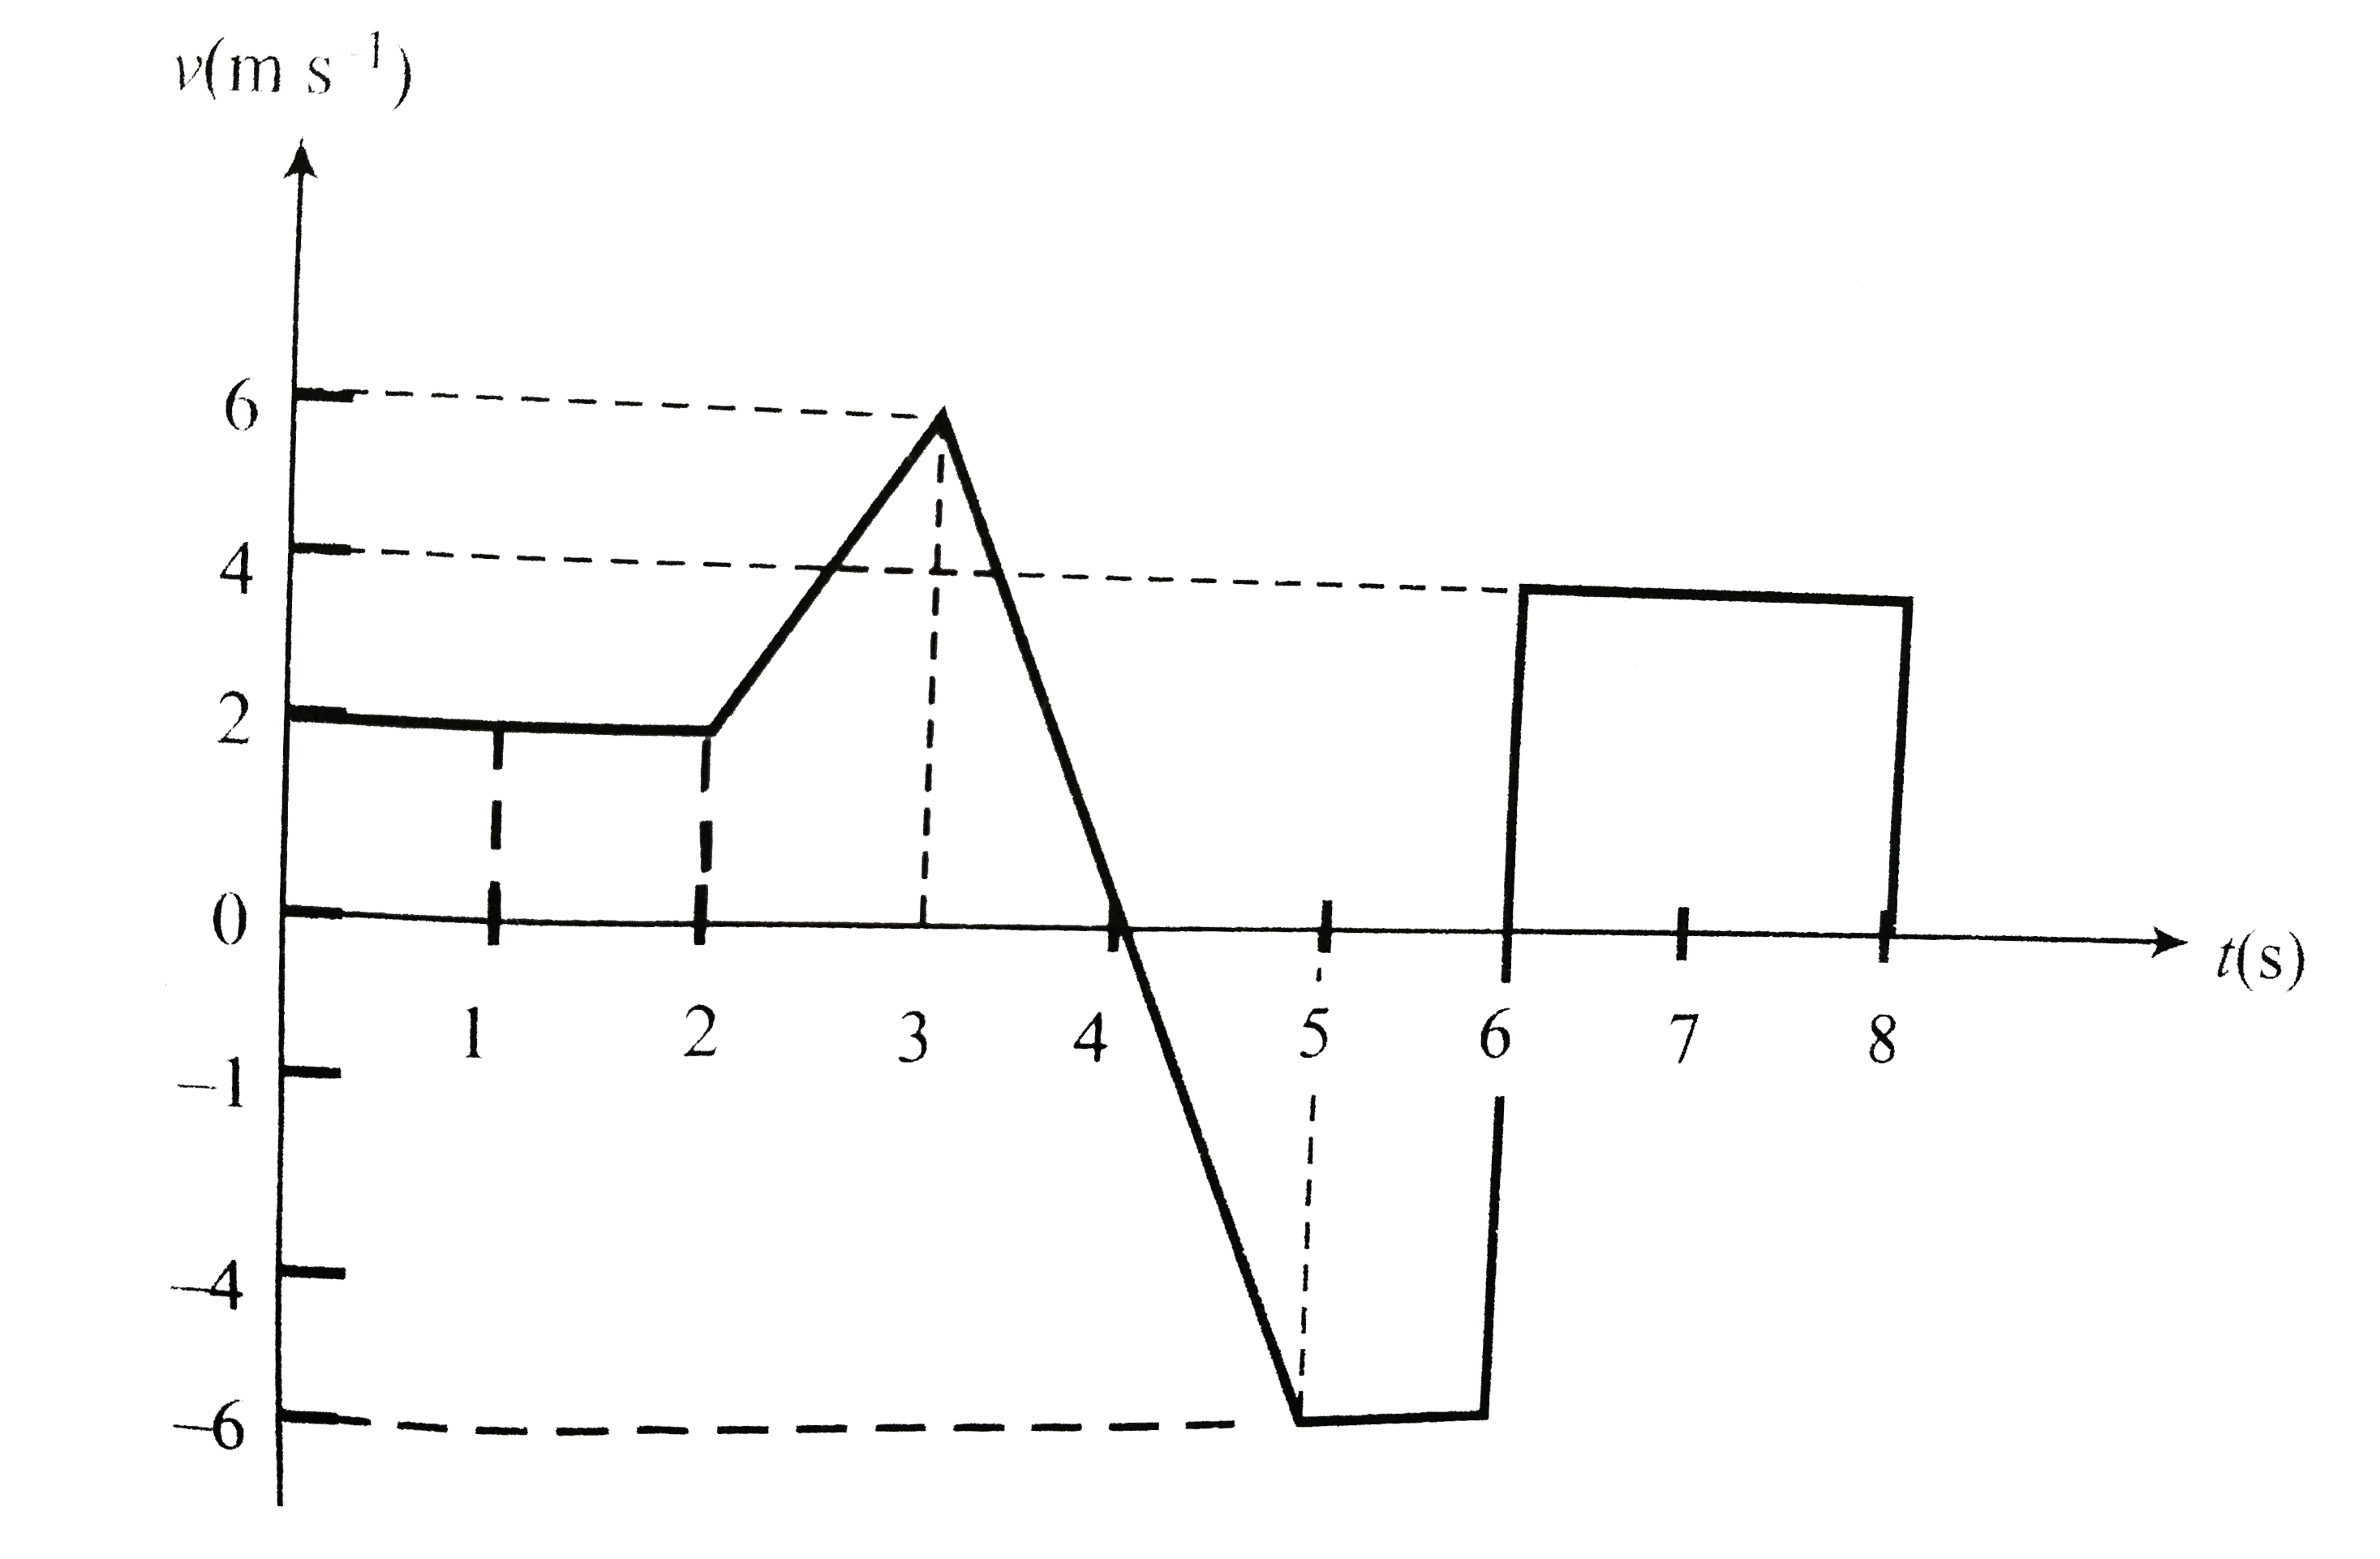 .A9mB12mC10mD28m
The dependence of the acceleration of a body with time is shown in Figure. At t=0, the velocity of the body is −3m/s and position is x=0m.
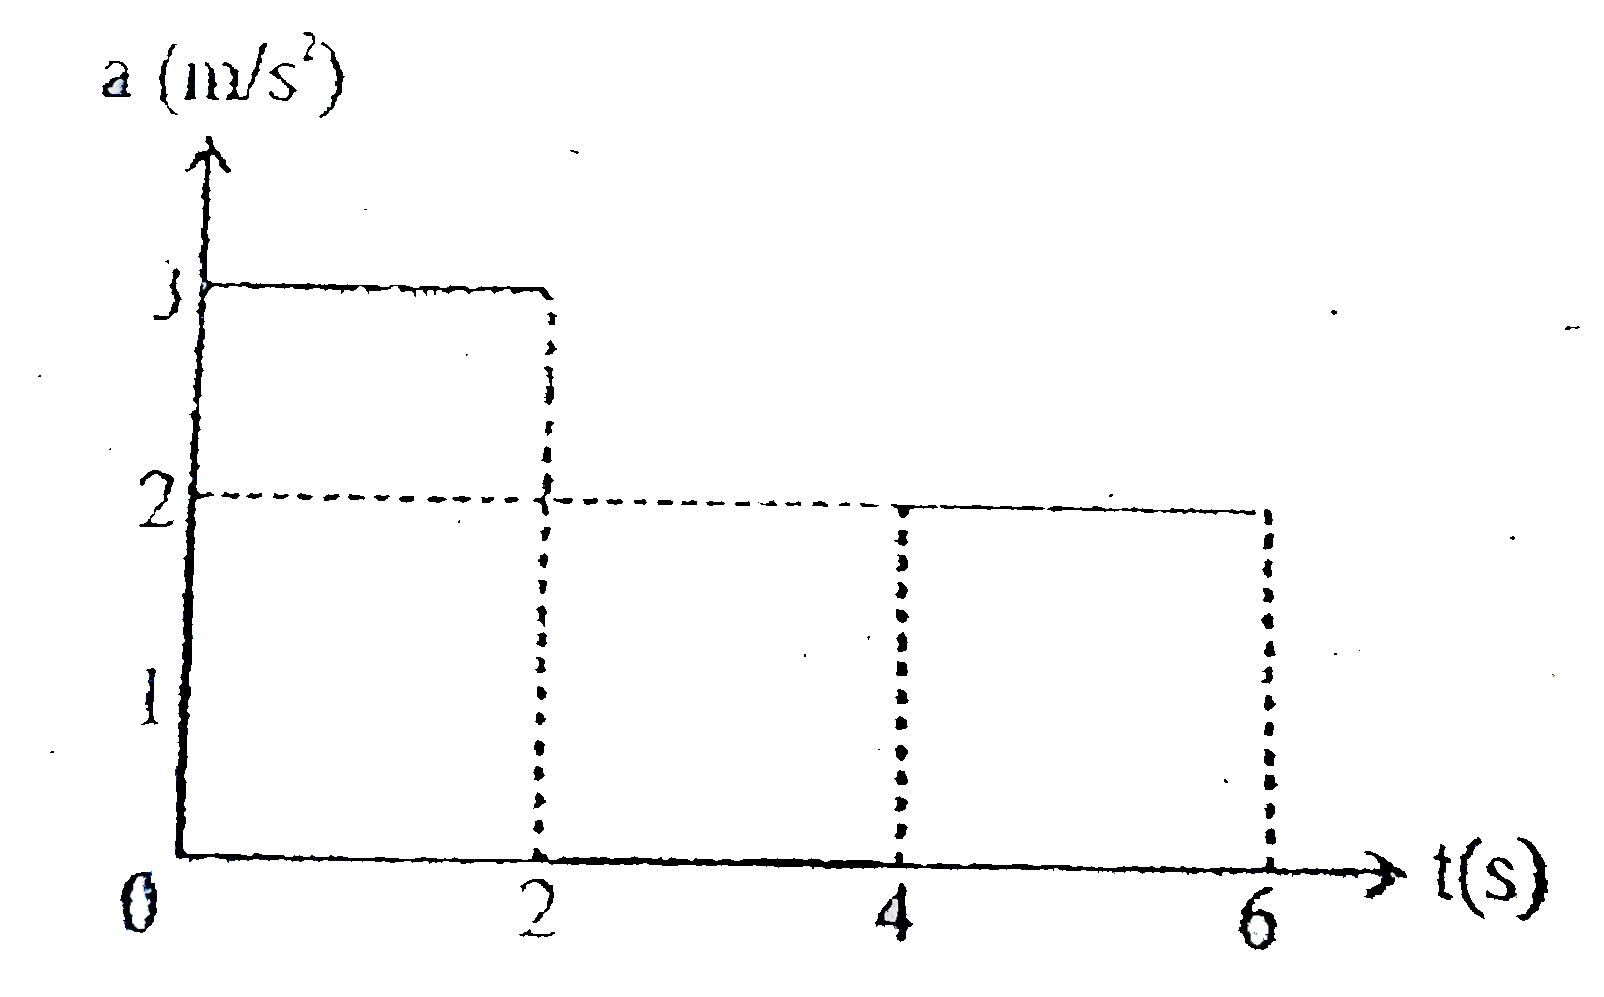 AThe velocity time graph is
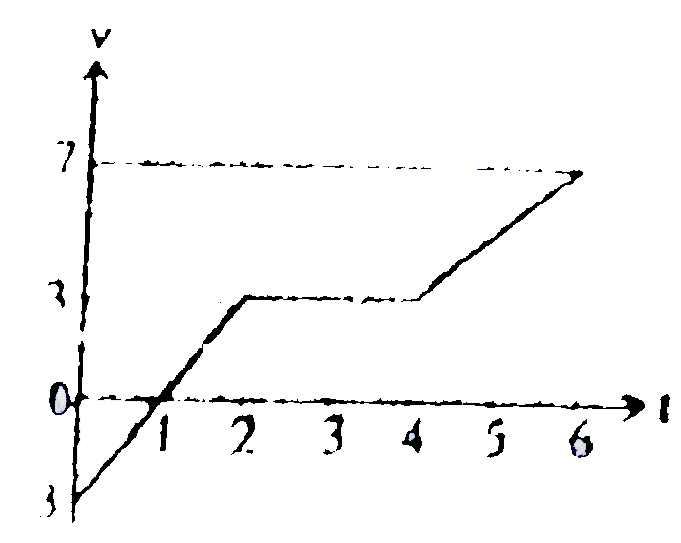 BThe velocity time graph is
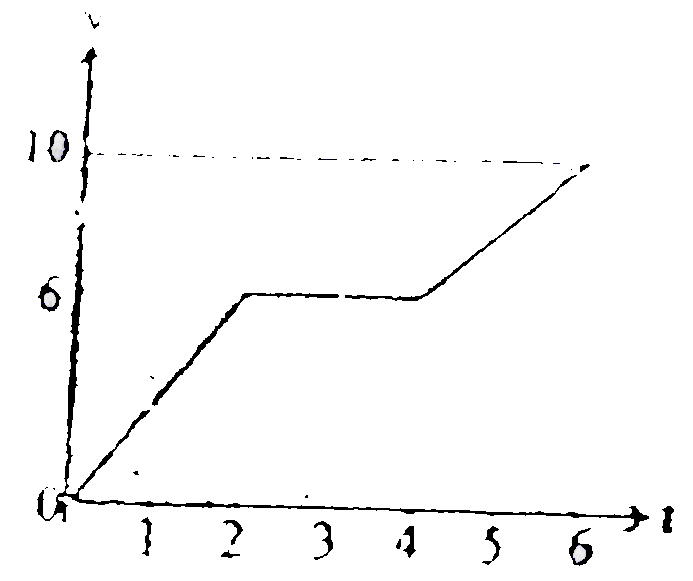 CThe position time graph is
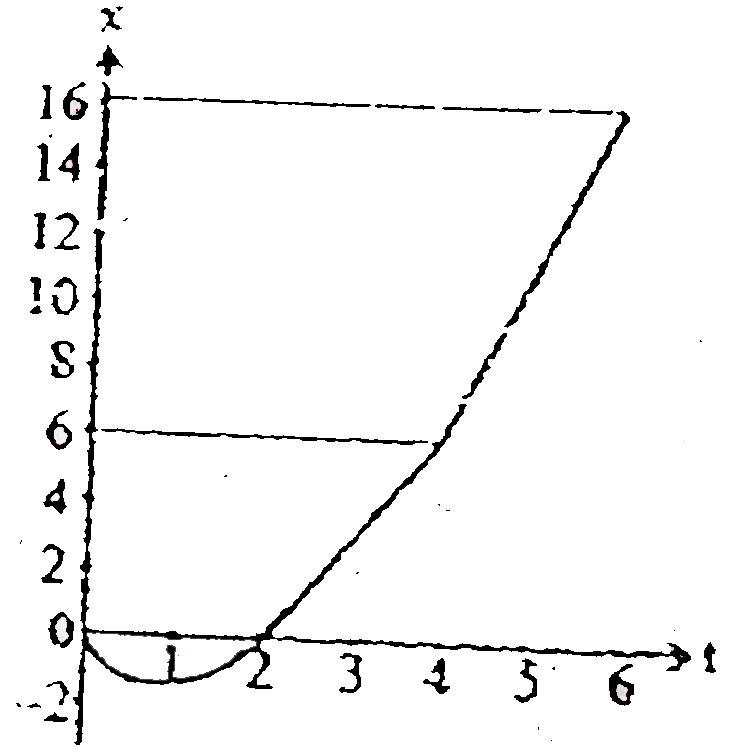 DThe position time graph is
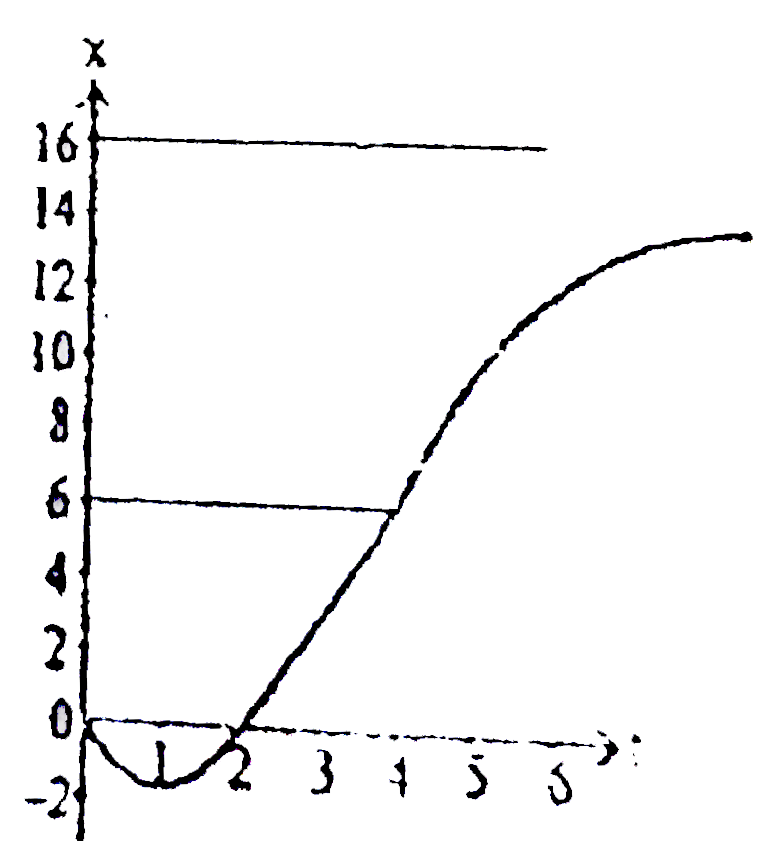
The acceleration a of a body, starting from rest varies with time t following the cquation a= 3t + 4. The velocity of the body at timet =2 s will be
A10ms−1B18ms−1C14ms−1D26ms−1
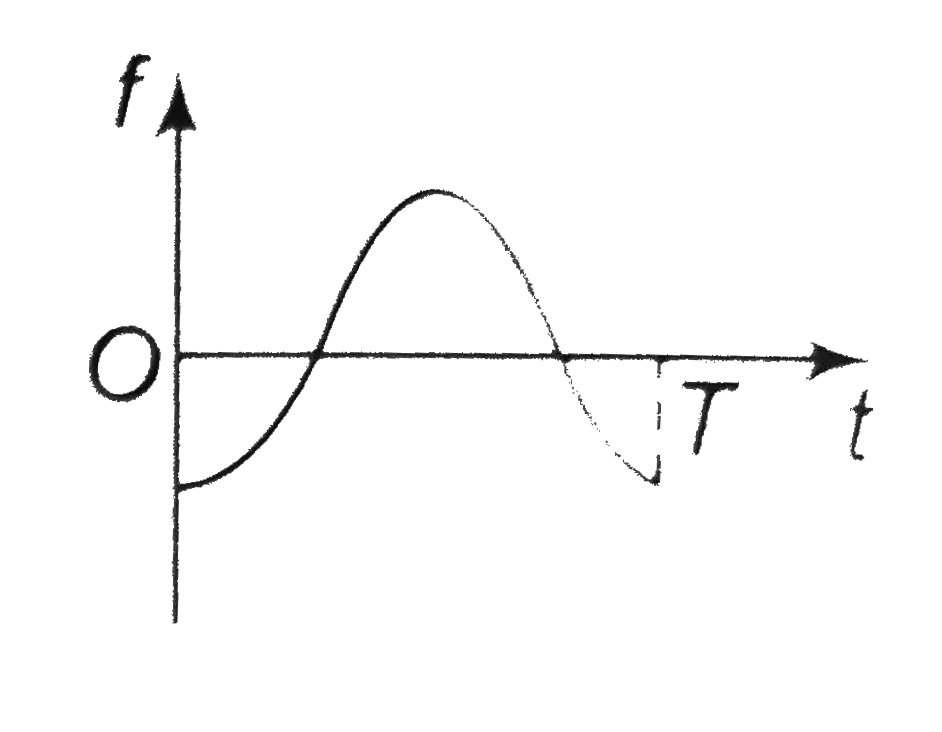
A body is performing simple harmonic motion with amplitude A and time period T variation of its acceleration (f) with time(t) is shown in figure If a line x velocity of the body is x which of the following graph is correct?
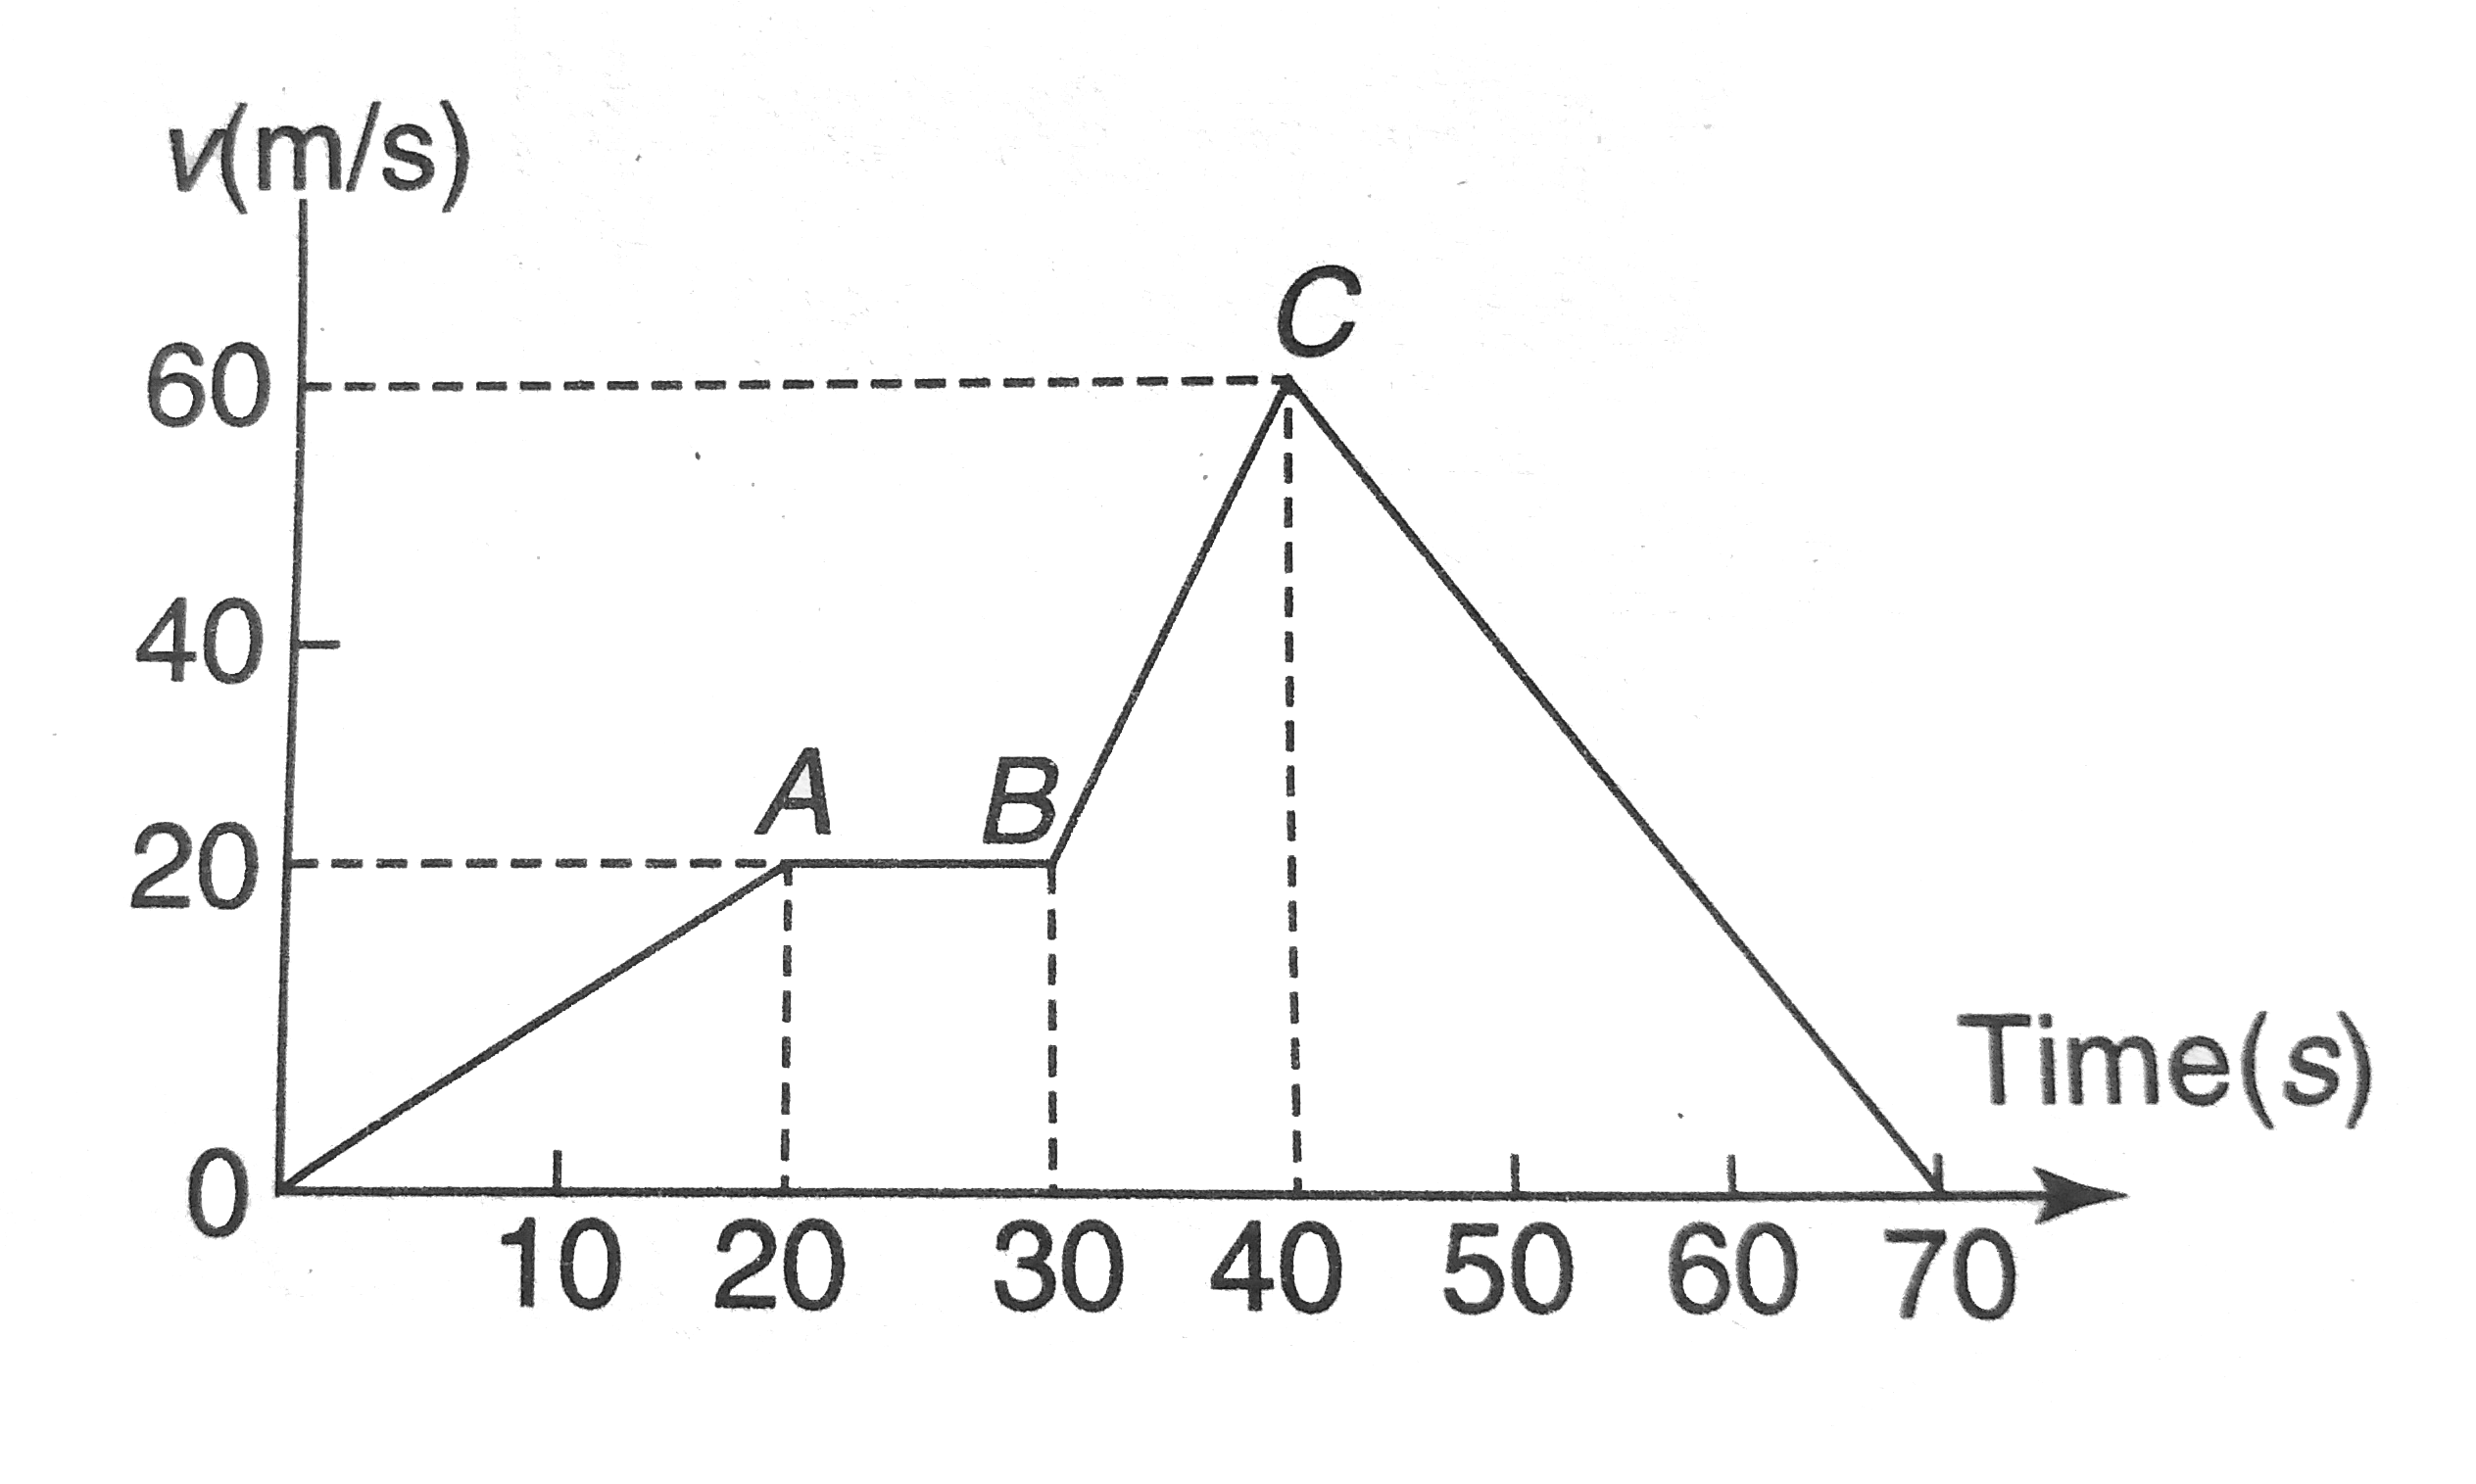
View SolutionThe velocity-time graph of a body is given below. Find the average velocity from t=0 to t=40s.
View SolutionThe displacement of a body is given by 2s=gt2 where g is a constant. The velocity of the body at any time t is :
View Solution
The acceleration time graph of a body is shown below the most probable velocity time graph of the body is
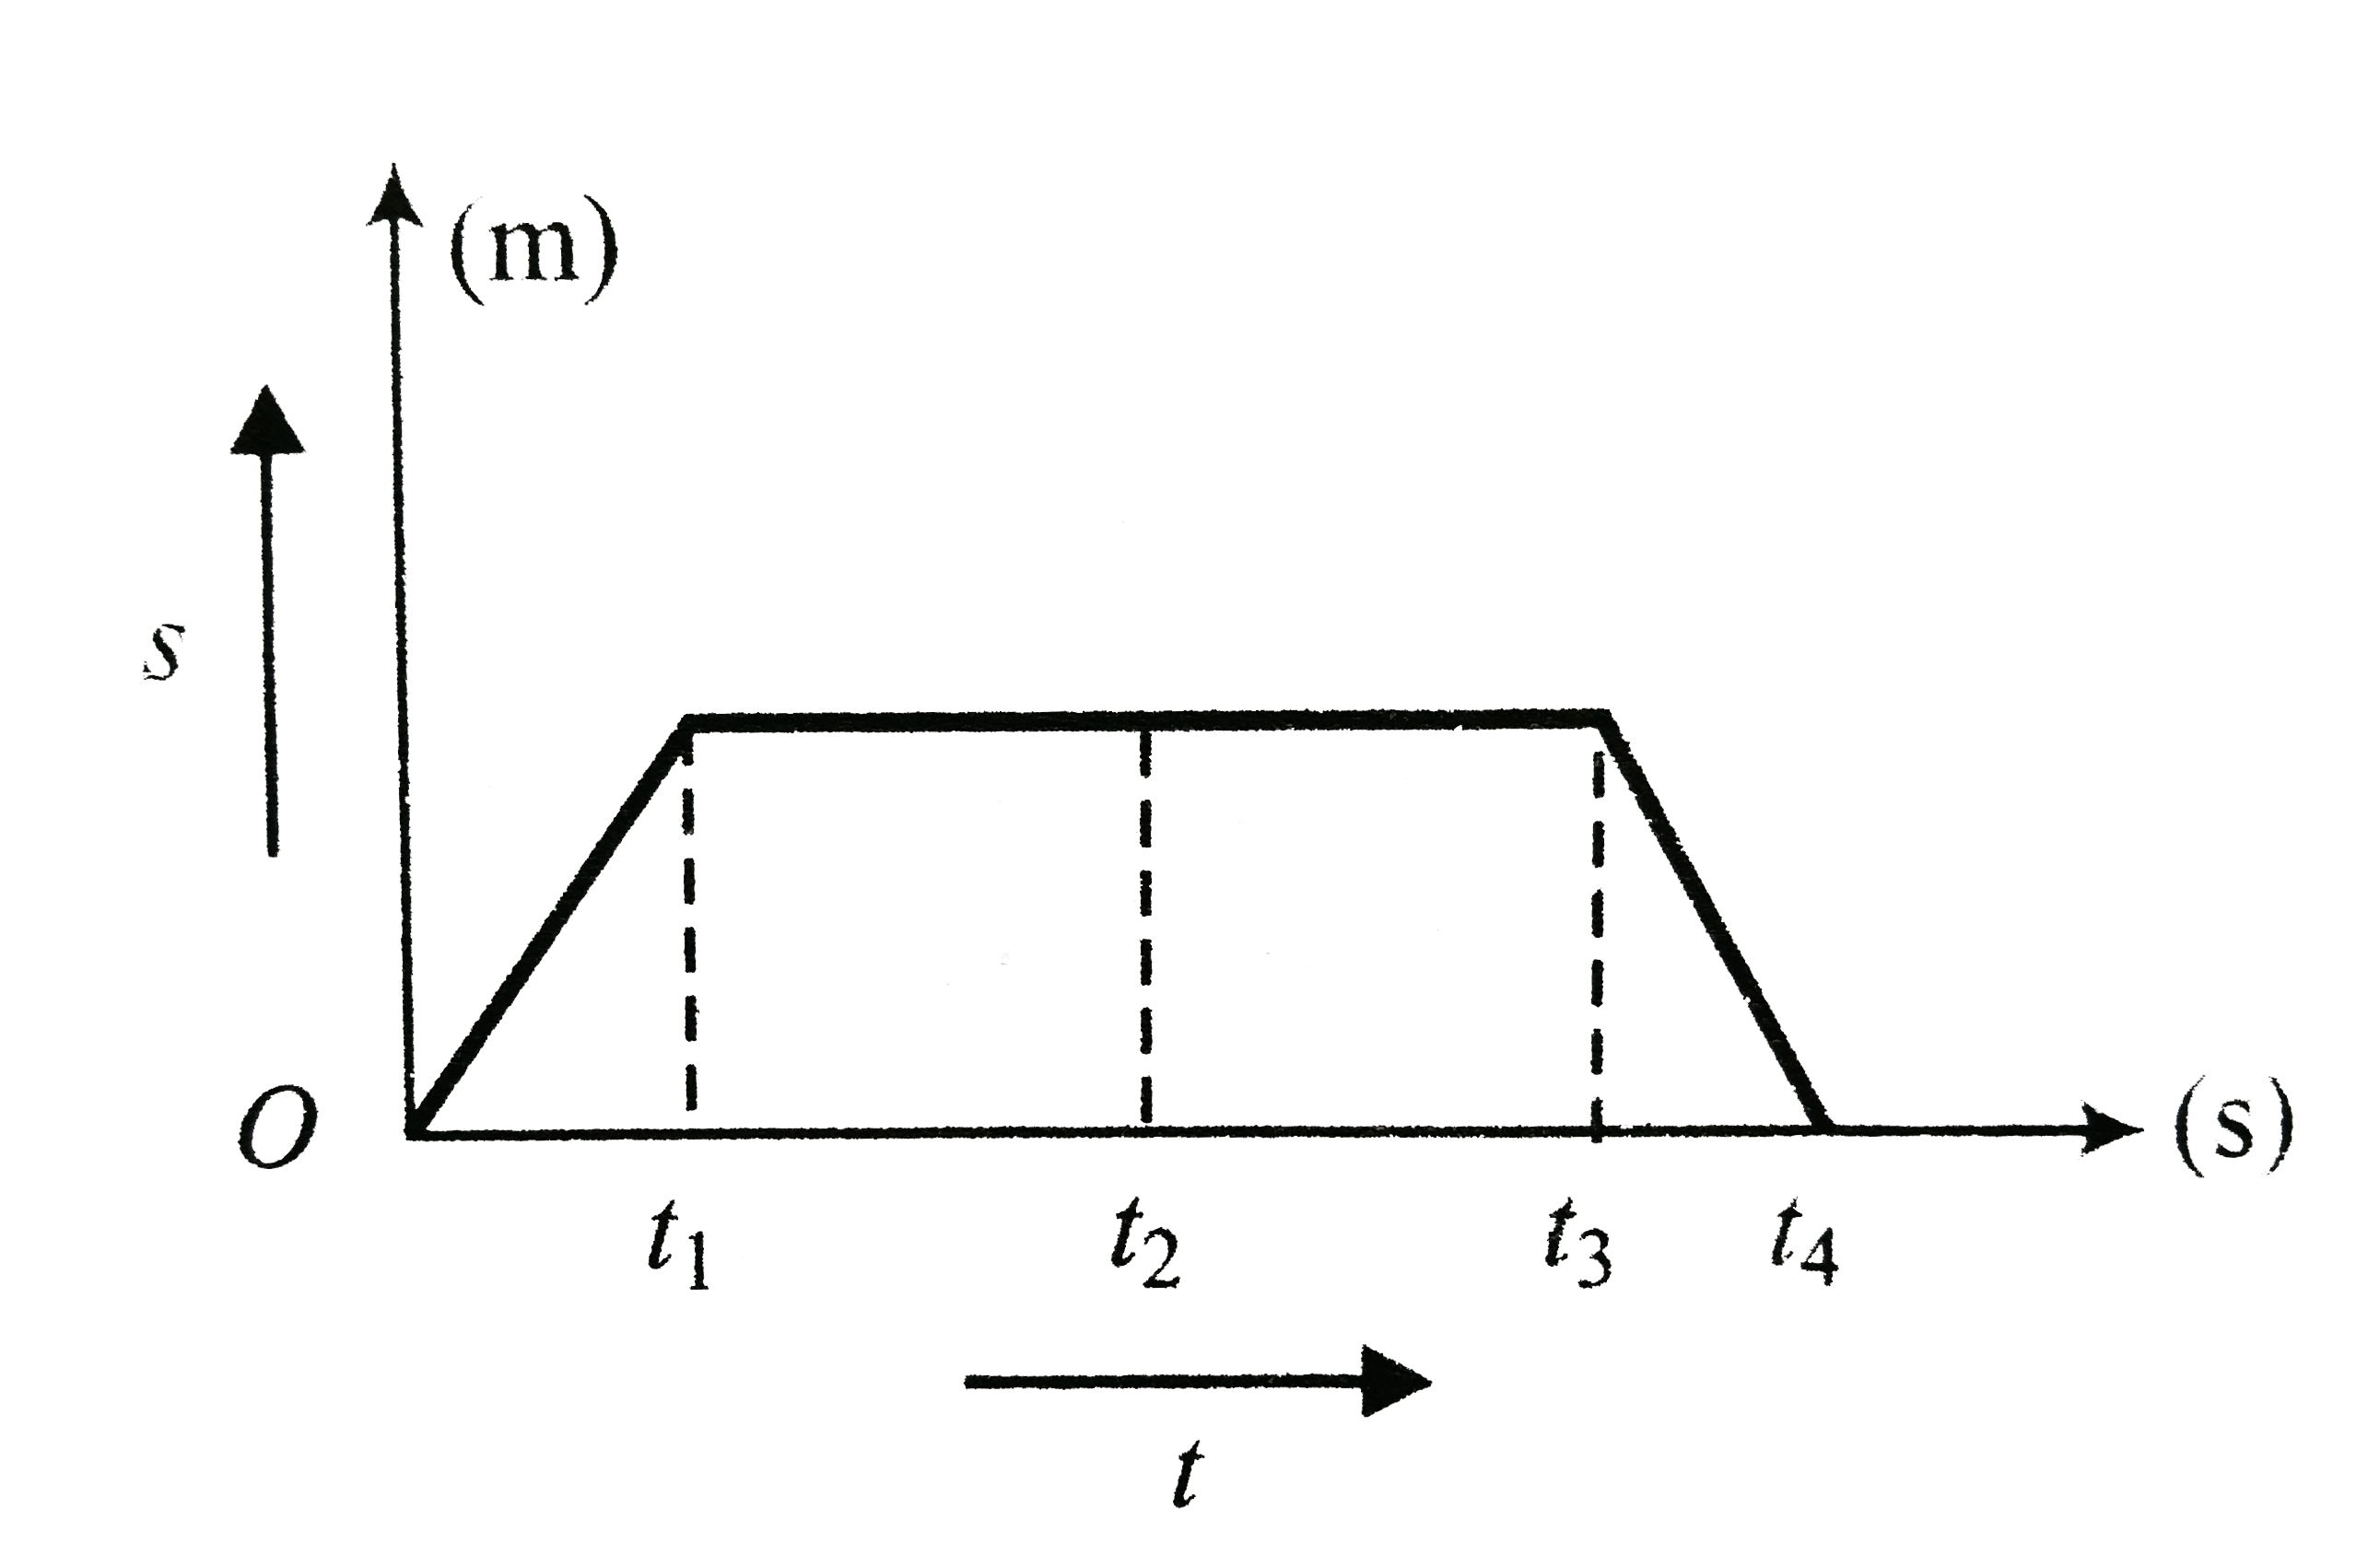
View SolutionThe displacement-time graph of a body is shown in.
 .
.
The velocity-time graph of the motion of the body will be .
View Solution

