A ball is projected vertically up with an initial velocity. Which of the following graphs represents the KE of the ball?
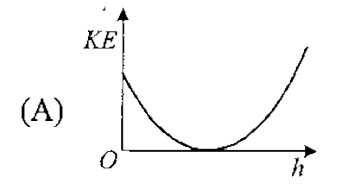
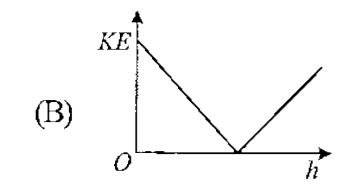
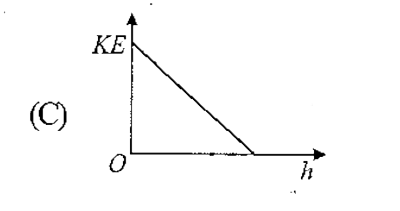
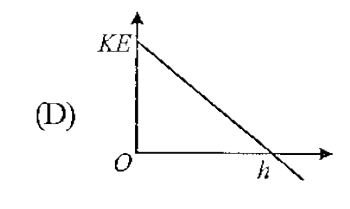
The correct Answer is:C
To solve the problem of determining which graph represents the kinetic energy (KE) of a ball projected vertically upward, we can follow these steps:
Step 1: Understand the motion of the ball
When a ball is projected vertically upward with an initial velocity U0, it will rise to a certain height until its velocity becomes zero at the peak of its motion. After reaching the peak, it will start to fall back down.
Step 2: Analyze kinetic energy
The kinetic energy (KE) of the ball at any height h can be expressed using the formula:
KE=12mv2
where v is the velocity of the ball at height h.
Step 3: Relate velocity to height
Using the kinematic equation:
v2=U20−2gh
where g is the acceleration due to gravity (acting downward), we can express the kinetic energy in terms of height h:
KE=12m(U20−2gh)
This simplifies to:
KE=12mU20−mgh
Step 4: Identify the behavior of KE
1. At the initial point (when h=0), the KE is at its maximum value of 12mU20.
2. As the ball rises, h increases, which means KE decreases because of the −mgh term.
3. At the peak of its motion (maximum height), the velocity v=0 and thus KE=0.
4. As the ball falls back down, h decreases, causing KE to increase again until it reaches the initial value just before hitting the ground.
Step 5: Graphical representation
From the analysis:
- The graph of KE will start at a maximum value when h=0, decrease to zero at the peak height, and then increase again as the ball falls back down.
- This behavior indicates that the graph of KE will be a downward-opening parabola, starting from a positive value, reaching zero, and then increasing again.
Step 6: Identify the correct graph
Based on the characteristics of the kinetic energy as described:
- The graph must start high (maximum KE) at h=0, decrease to zero at the peak height, and then increase again as the ball descends.
Thus, the correct option that represents the kinetic energy of the ball is Option C.
When a ball is projected vertically upward with an initial velocity U0, it will rise to a certain height until its velocity becomes zero at the peak of its motion. After reaching the peak, it will start to fall back down.
The kinetic energy (KE) of the ball at any height h can be expressed using the formula:
KE=12mv2
where v is the velocity of the ball at height h.
Using the kinematic equation:
v2=U20−2gh
where g is the acceleration due to gravity (acting downward), we can express the kinetic energy in terms of height h:
KE=12m(U20−2gh)
This simplifies to:
KE=12mU20−mgh
1. At the initial point (when h=0), the KE is at its maximum value of 12mU20.
2. As the ball rises, h increases, which means KE decreases because of the −mgh term.
3. At the peak of its motion (maximum height), the velocity v=0 and thus KE=0.
4. As the ball falls back down, h decreases, causing KE to increase again until it reaches the initial value just before hitting the ground.
From the analysis:
- The graph of KE will start at a maximum value when h=0, decrease to zero at the peak height, and then increase again as the ball falls back down.
- This behavior indicates that the graph of KE will be a downward-opening parabola, starting from a positive value, reaching zero, and then increasing again.
Based on the characteristics of the kinetic energy as described:
- The graph must start high (maximum KE) at h=0, decrease to zero at the peak height, and then increase again as the ball descends.
Topper's Solved these Questions
- KINEMATICSBook:PHYSICS GALAXY - ASHISH ARORAChapter:KINEMATICSExercise:Numerical
Explore 111 Videos
- KINEMATICSBook:PHYSICS GALAXY - ASHISH ARORAChapter:KINEMATICSExercise:Advance MCQs with One or More Options Correct
Explore 17 Videos
- KINEMATICSBook:PHYSICS GALAXY - ASHISH ARORAChapter:KINEMATICSExercise:Discussion Question
Explore 18 Videos
- GRAVITATIONBook:PHYSICS GALAXY - ASHISH ARORAChapter:GRAVITATIONExercise:Unsolved Numerical
Explore 94 Videos
- LINEAR MOMENTUM & ITS CONSERVATIONBook:PHYSICS GALAXY - ASHISH ARORAChapter:LINEAR MOMENTUM & ITS CONSERVATIONExercise:exercise 1.3
Explore 3 Videos
Similar Questions
A ball is thrown vertically upwards. Which of the following plots represent the speed graph of the ball during its flight if the air resistence is not ignored?
View SolutionA ball is projected vertically down with an initial velocity from a height of 20m onto a horizontal floor. During the impact it loses 50% of its energy and rebounds to the same height. The initial velocity of its projection is
View Solution
Knowledge Check
A ball thrown vertically upward with initial velocity u. Which of the following graphs represent the velocity of ball correctly as function of time?
(Take upward direction as positive)ABCDA ball is thrown vertically upwards. Which of the following graph/graphs represent velocity time graph of the ball during its flight ( air resistance is neglected).
A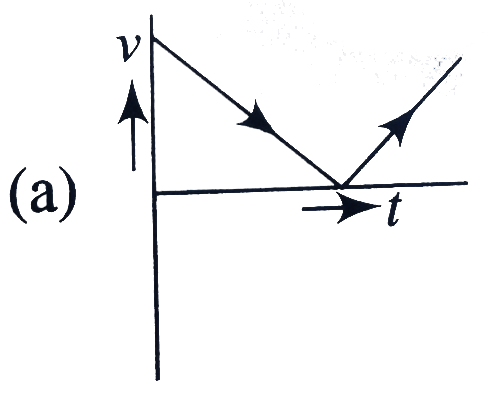 B
B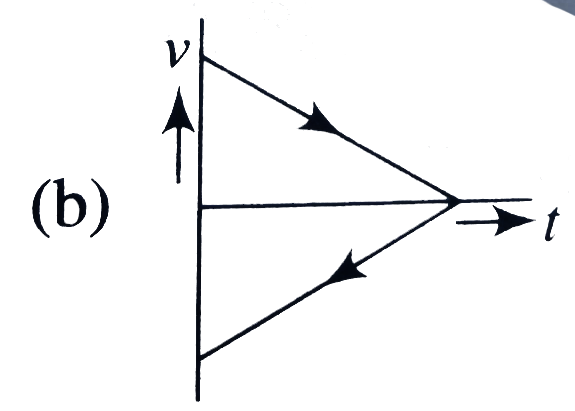 C
C D
D
A ball is thrown vertically upwards. Which of the following plots represents the speed-time graph of the ball during its height if the air resistance is not ingnored ?
A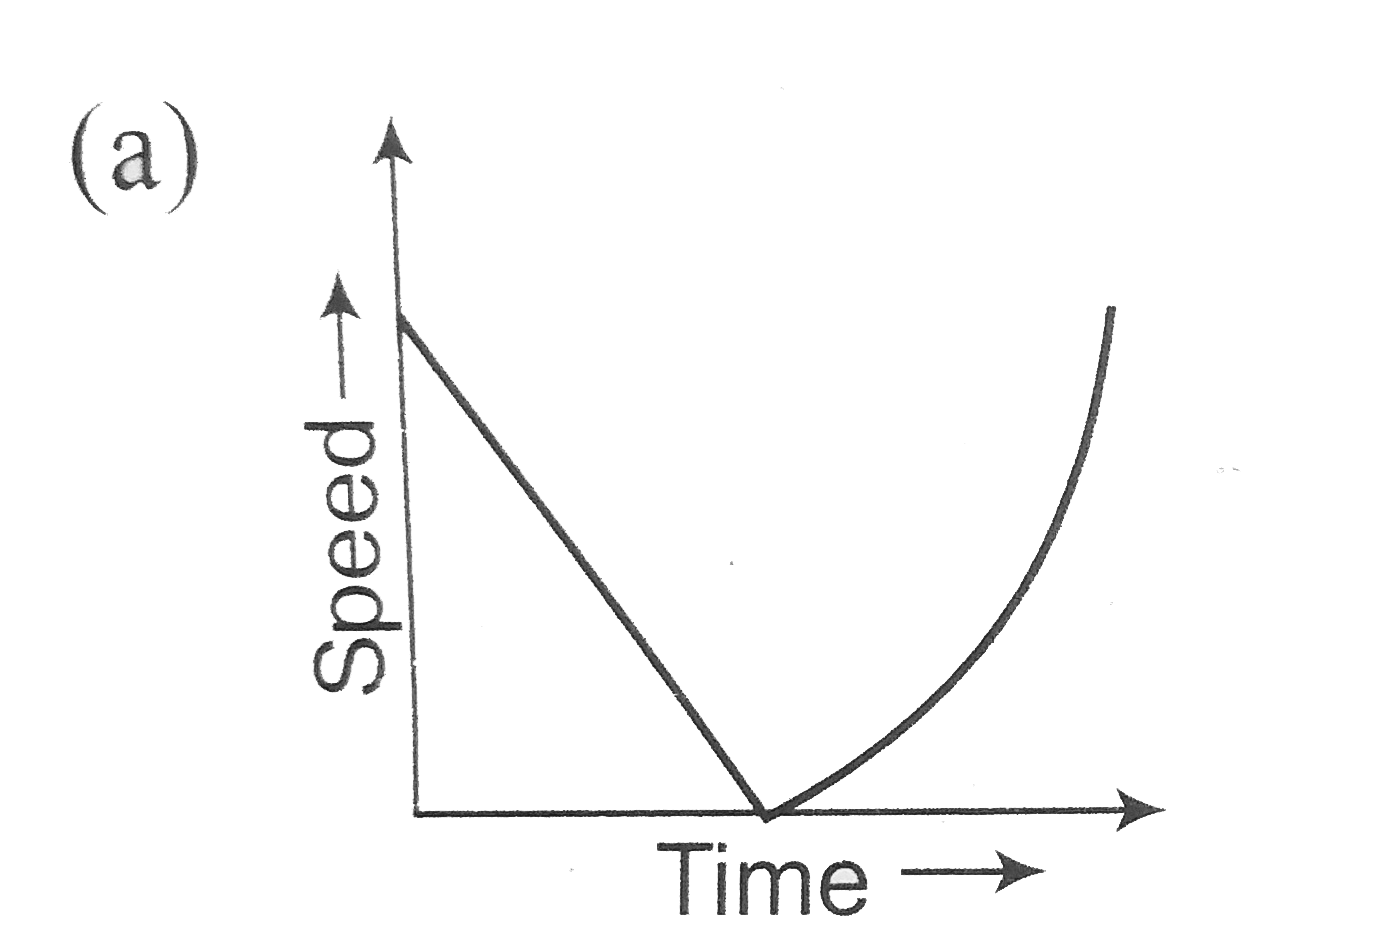 .B
.B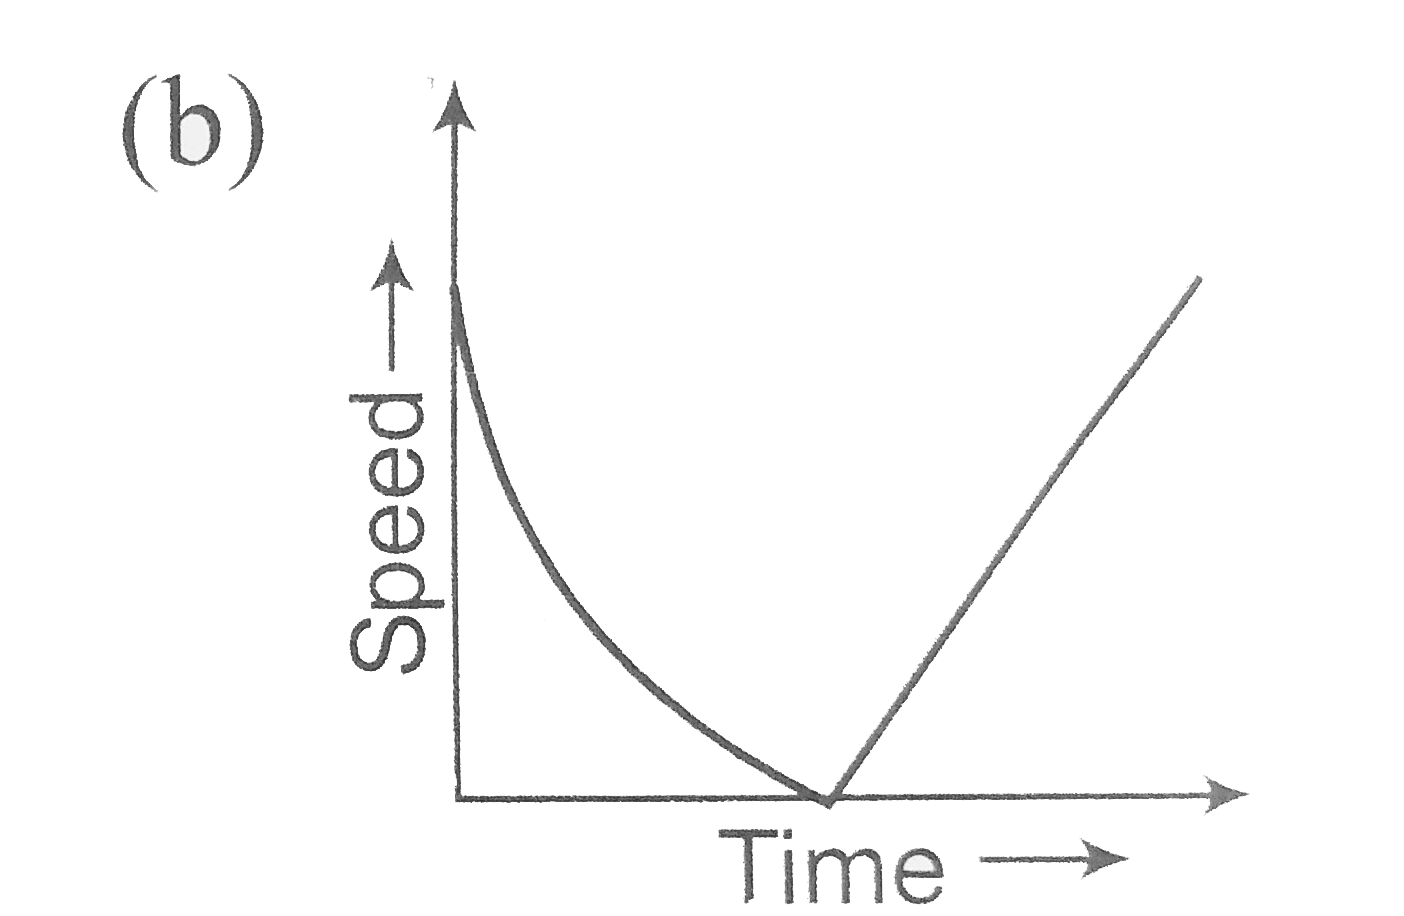 .C
.C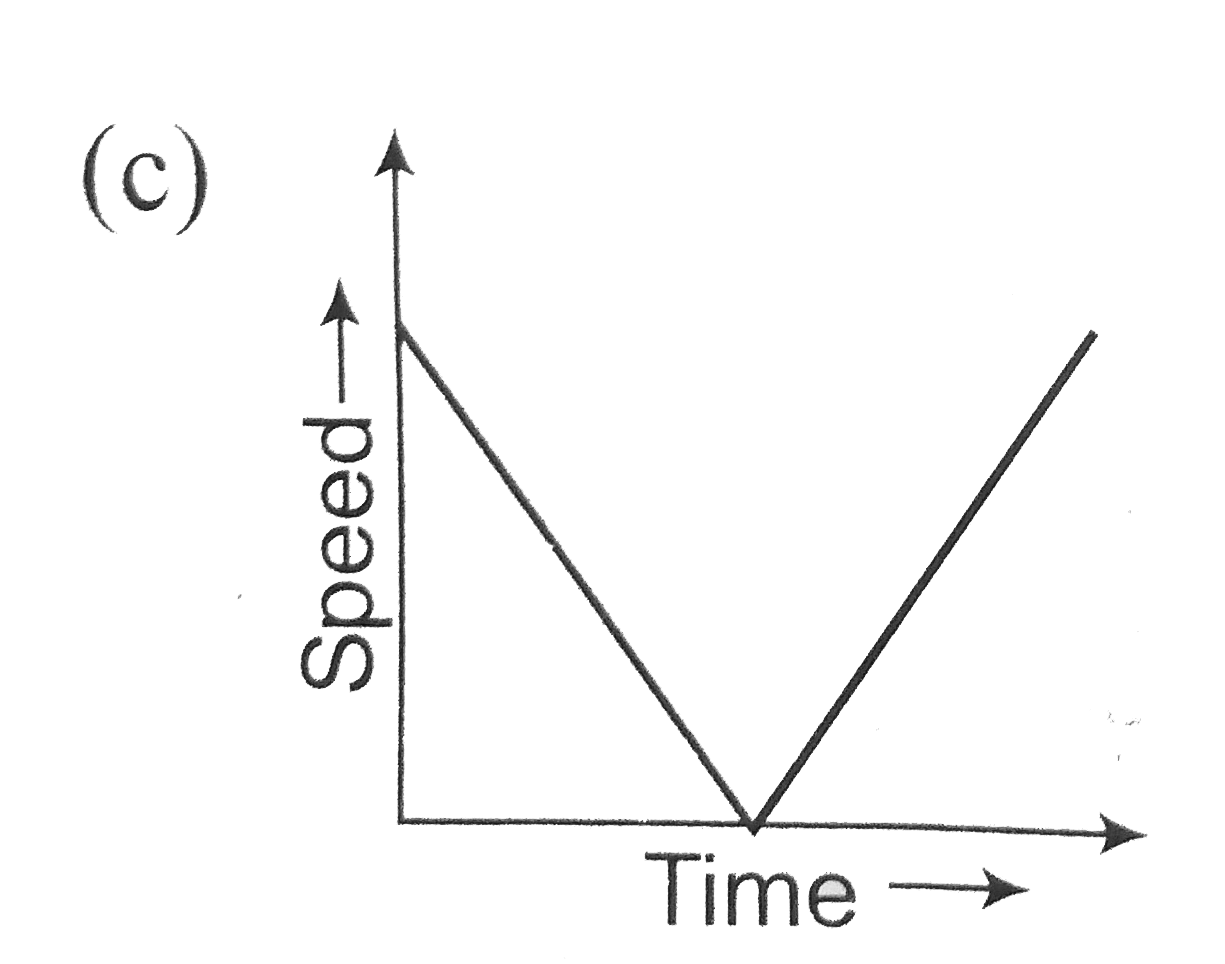 .D
.D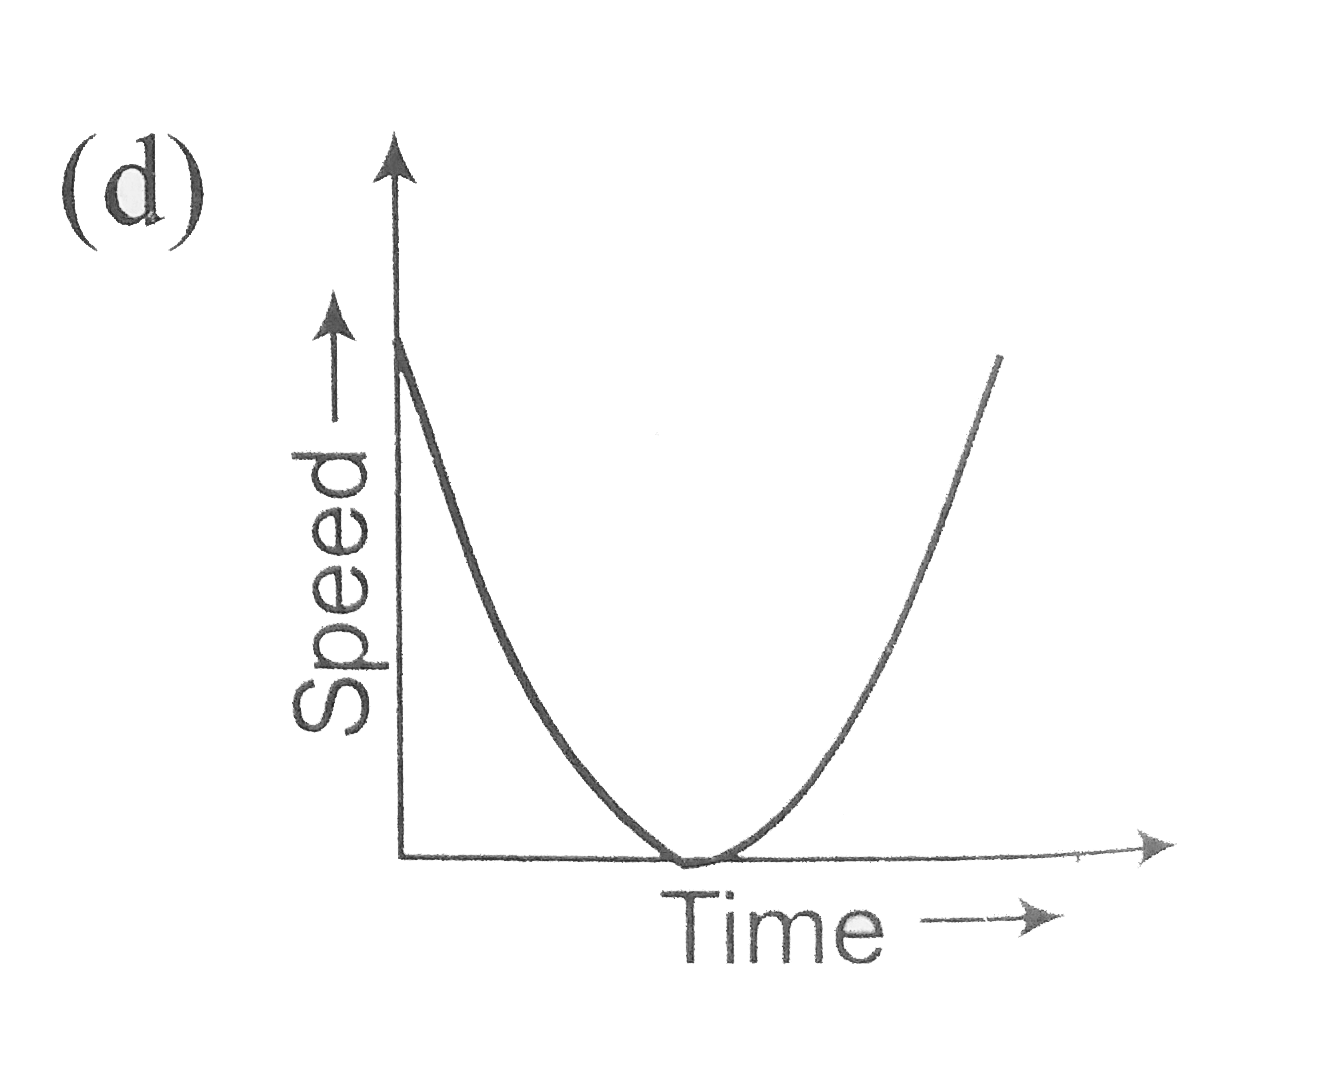 .
.
Which one is a ball and socket joint
View SolutionA ball thrown vertically upwards with an initial velocity of 1.4 m/s returns in 2s. The total dispalcement of the ball is
View SolutionA ball thrown vertically upwards with an initial velocity of 1.4m/s. The total displcement of the ball is
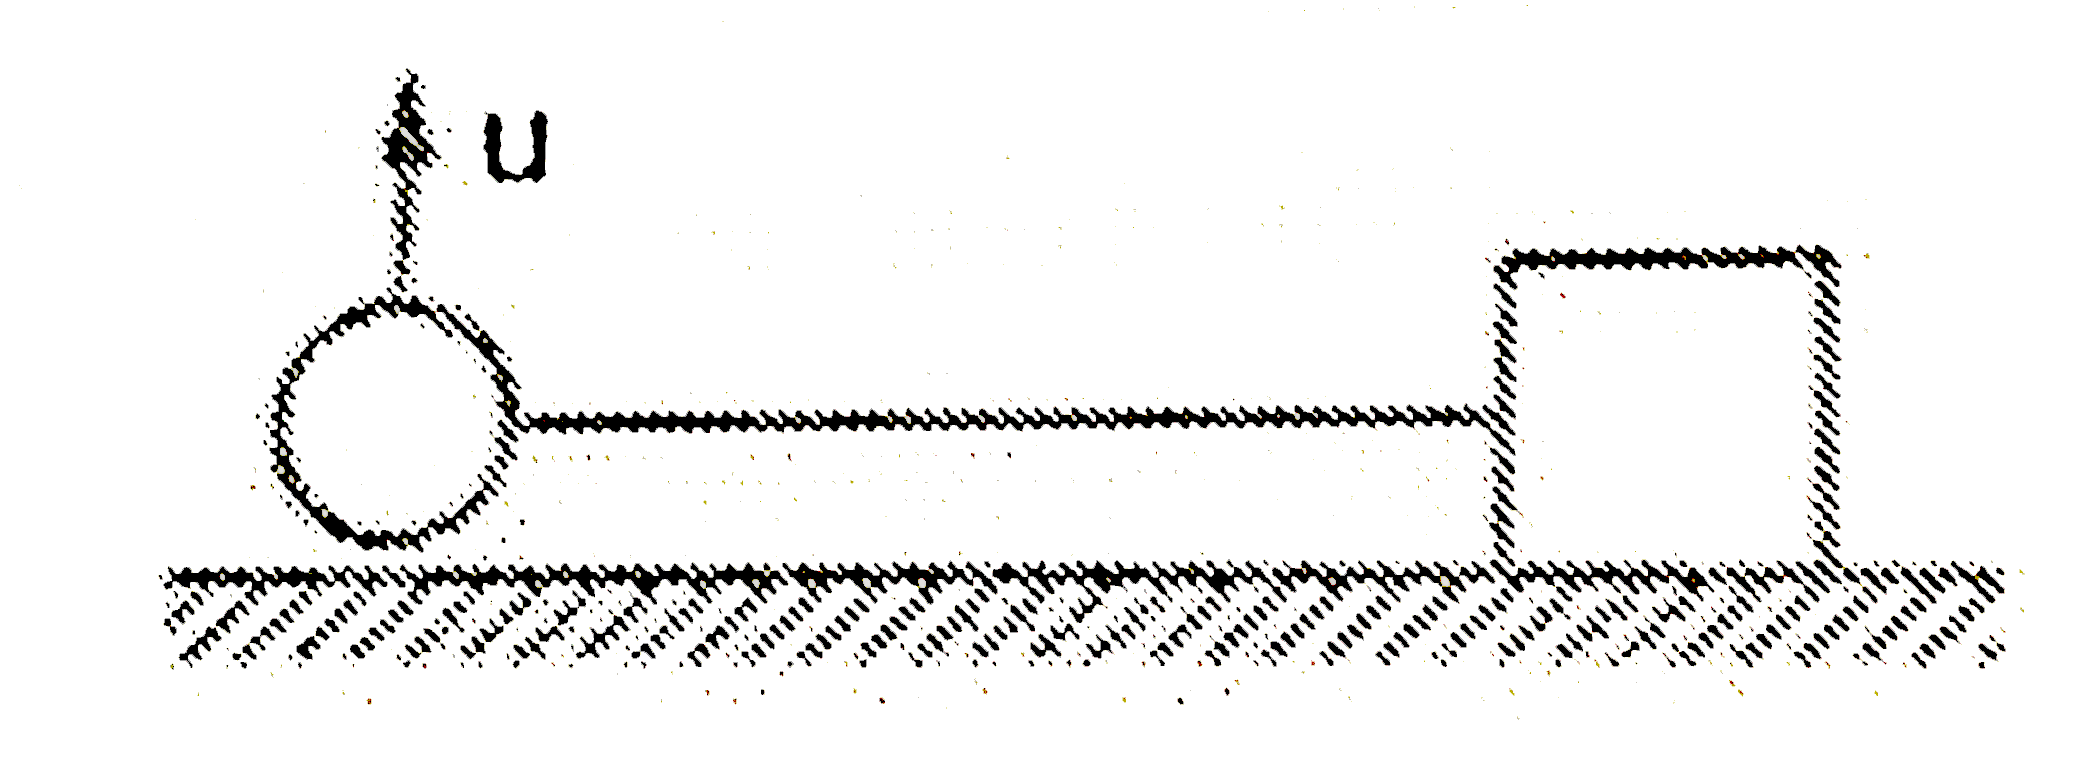
View SolutionA small ball is connected to a block by a light string of length l. Both are initially on the ground. There is sufficient friction on the ground to prevent the block from slipping. The ball is projected vertically up with a velocity u, where 2gl<u2<3gl. The centre of mass of the block + ball' system is C.
View SolutionA ball is projected vertically up with speed 20 m/s. Take g=10m/s2
View Solution


