The variation in the speed of a car during its two hour journey is shown in the graph of the figure-1.106. The magnitude of the maximum acceleration of the car occupies an interval of:
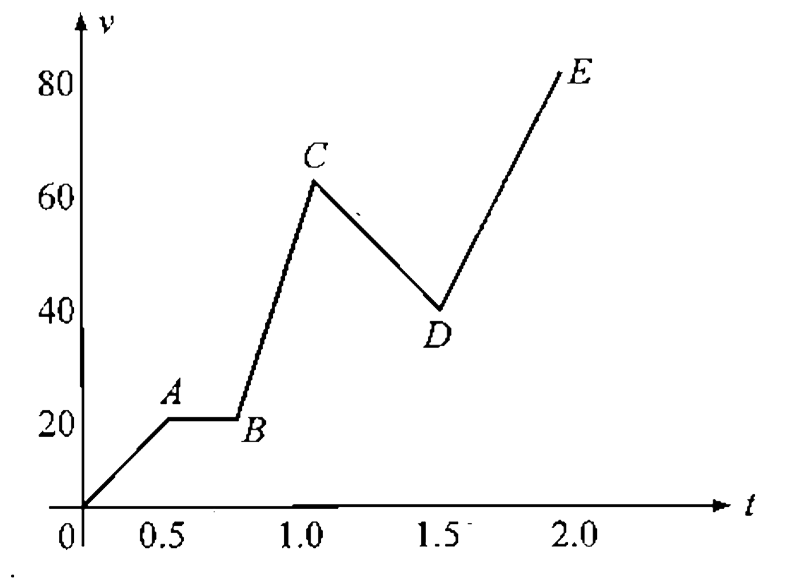
OA
BC
CD
DE
The correct Answer is:B
Step by step video, text & image solution for The variation in the speed of a car during its two hour journey is shown in the graph of the figure-1.106. The magnitude of the maximum acceleration of the car occupies an interval of: by Physics experts to help you in doubts & scoring excellent marks in Class 11 exams.
Updated on:21/07/2023Topper's Solved these Questions
- KINEMATICSBook:PHYSICS GALAXY - ASHISH ARORAChapter:KINEMATICSExercise:Numerical
Explore 111 Videos
- KINEMATICSBook:PHYSICS GALAXY - ASHISH ARORAChapter:KINEMATICSExercise:Advance MCQs with One or More Options Correct
Explore 17 Videos
- KINEMATICSBook:PHYSICS GALAXY - ASHISH ARORAChapter:KINEMATICSExercise:Discussion Question
Explore 18 Videos
- GRAVITATIONBook:PHYSICS GALAXY - ASHISH ARORAChapter:GRAVITATIONExercise:Unsolved Numerical
Explore 94 Videos
- LINEAR MOMENTUM & ITS CONSERVATIONBook:PHYSICS GALAXY - ASHISH ARORAChapter:LINEAR MOMENTUM & ITS CONSERVATIONExercise:exercise 1.3
Explore 3 Videos
Similar Questions
A train moves from one station to another in two hours time. Its speed during the motion is shown in the graph Calculate
(i) Maximum acceleration during the journey.
(ii) Distance covered during the time interval from 0.75 hour to 1 hour
View SolutionA train moves from one station to another in 2 hours time. Its speed-time graph during this motion is shown in the figure. The maximum acceleration during the journey is
View Solution
Knowledge Check
The magnitude of maximum acceleration of car occurs at
 AOABBCCCDDDE
A car runs at constant speed around the horizontal race track shown in the figure. Over which portion of the track is the magnitude of the acceleration the greatest?
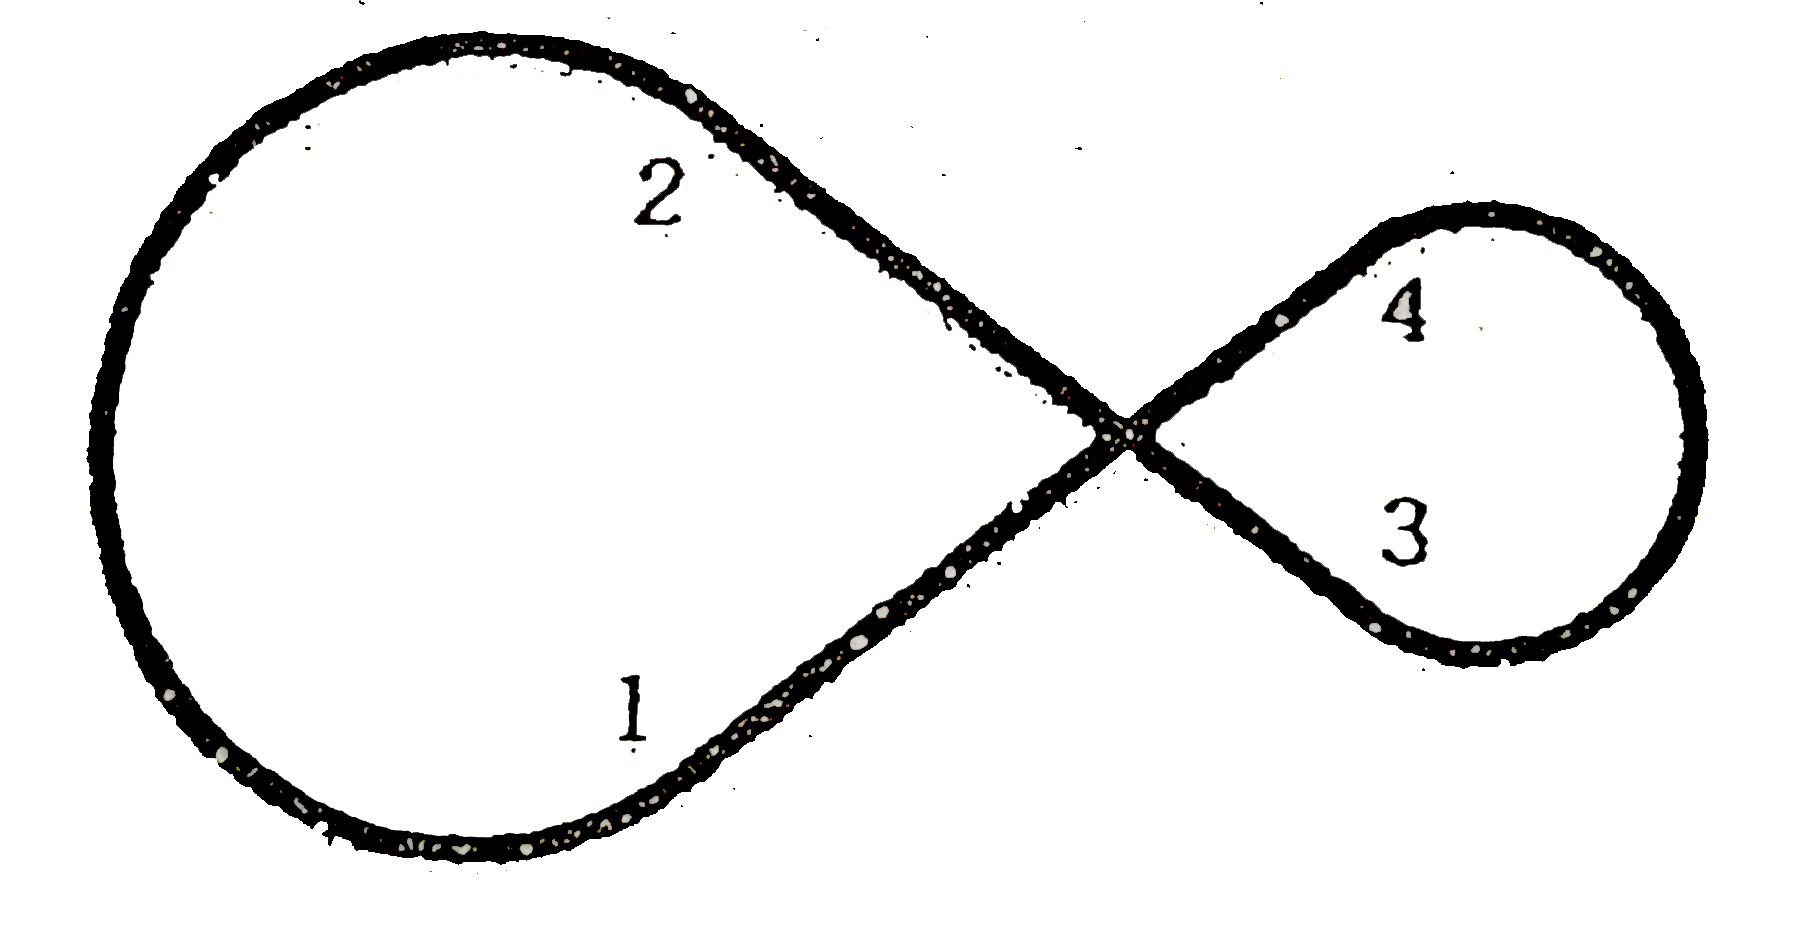 AFrom 1 to 2BFrom 2 to 3CFrom 3 to 4DFrom 4 to 1
Two racing cars 'A' and 'B' having masses 'M' and '2m' respectively start running from the starting line on a horizontal plane.Both cars 'A' and B' have same speed 'V' which is constant through out the journey. The track of the two cars are the arcs of concentric circle having centres O1 and O2 as shwon in figure with data. The friction coefficient of the two cars with the road is same. There is a finishing line at the end of the arc. Using these informations solve the following questions.
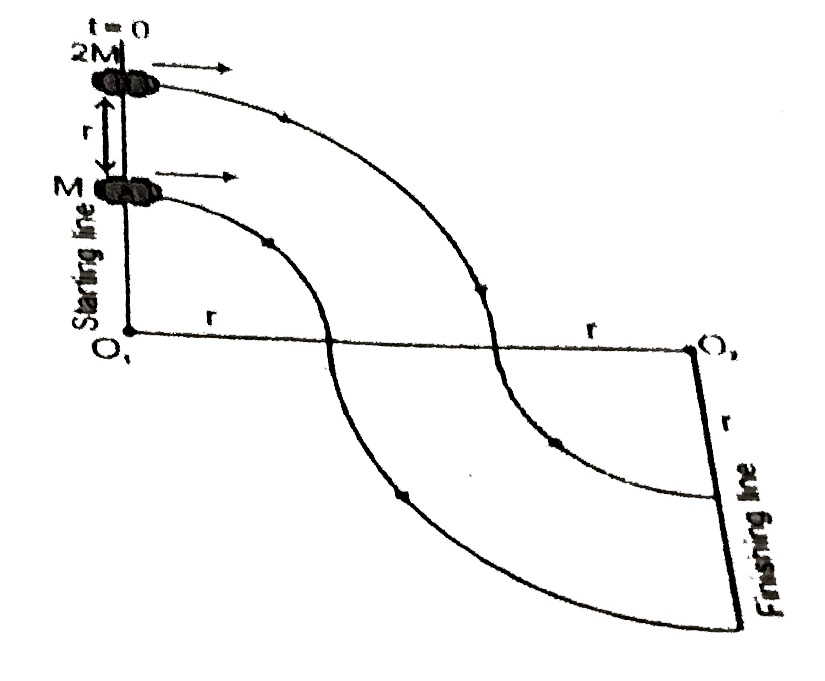
The magnitude of relative acceleration of two cars when car 'A' just reaches the end of circular arc of radius Y.A0B(√5−2)V22rC√2V2rDV2r
The speed of a car as a function of time is shown in figure.
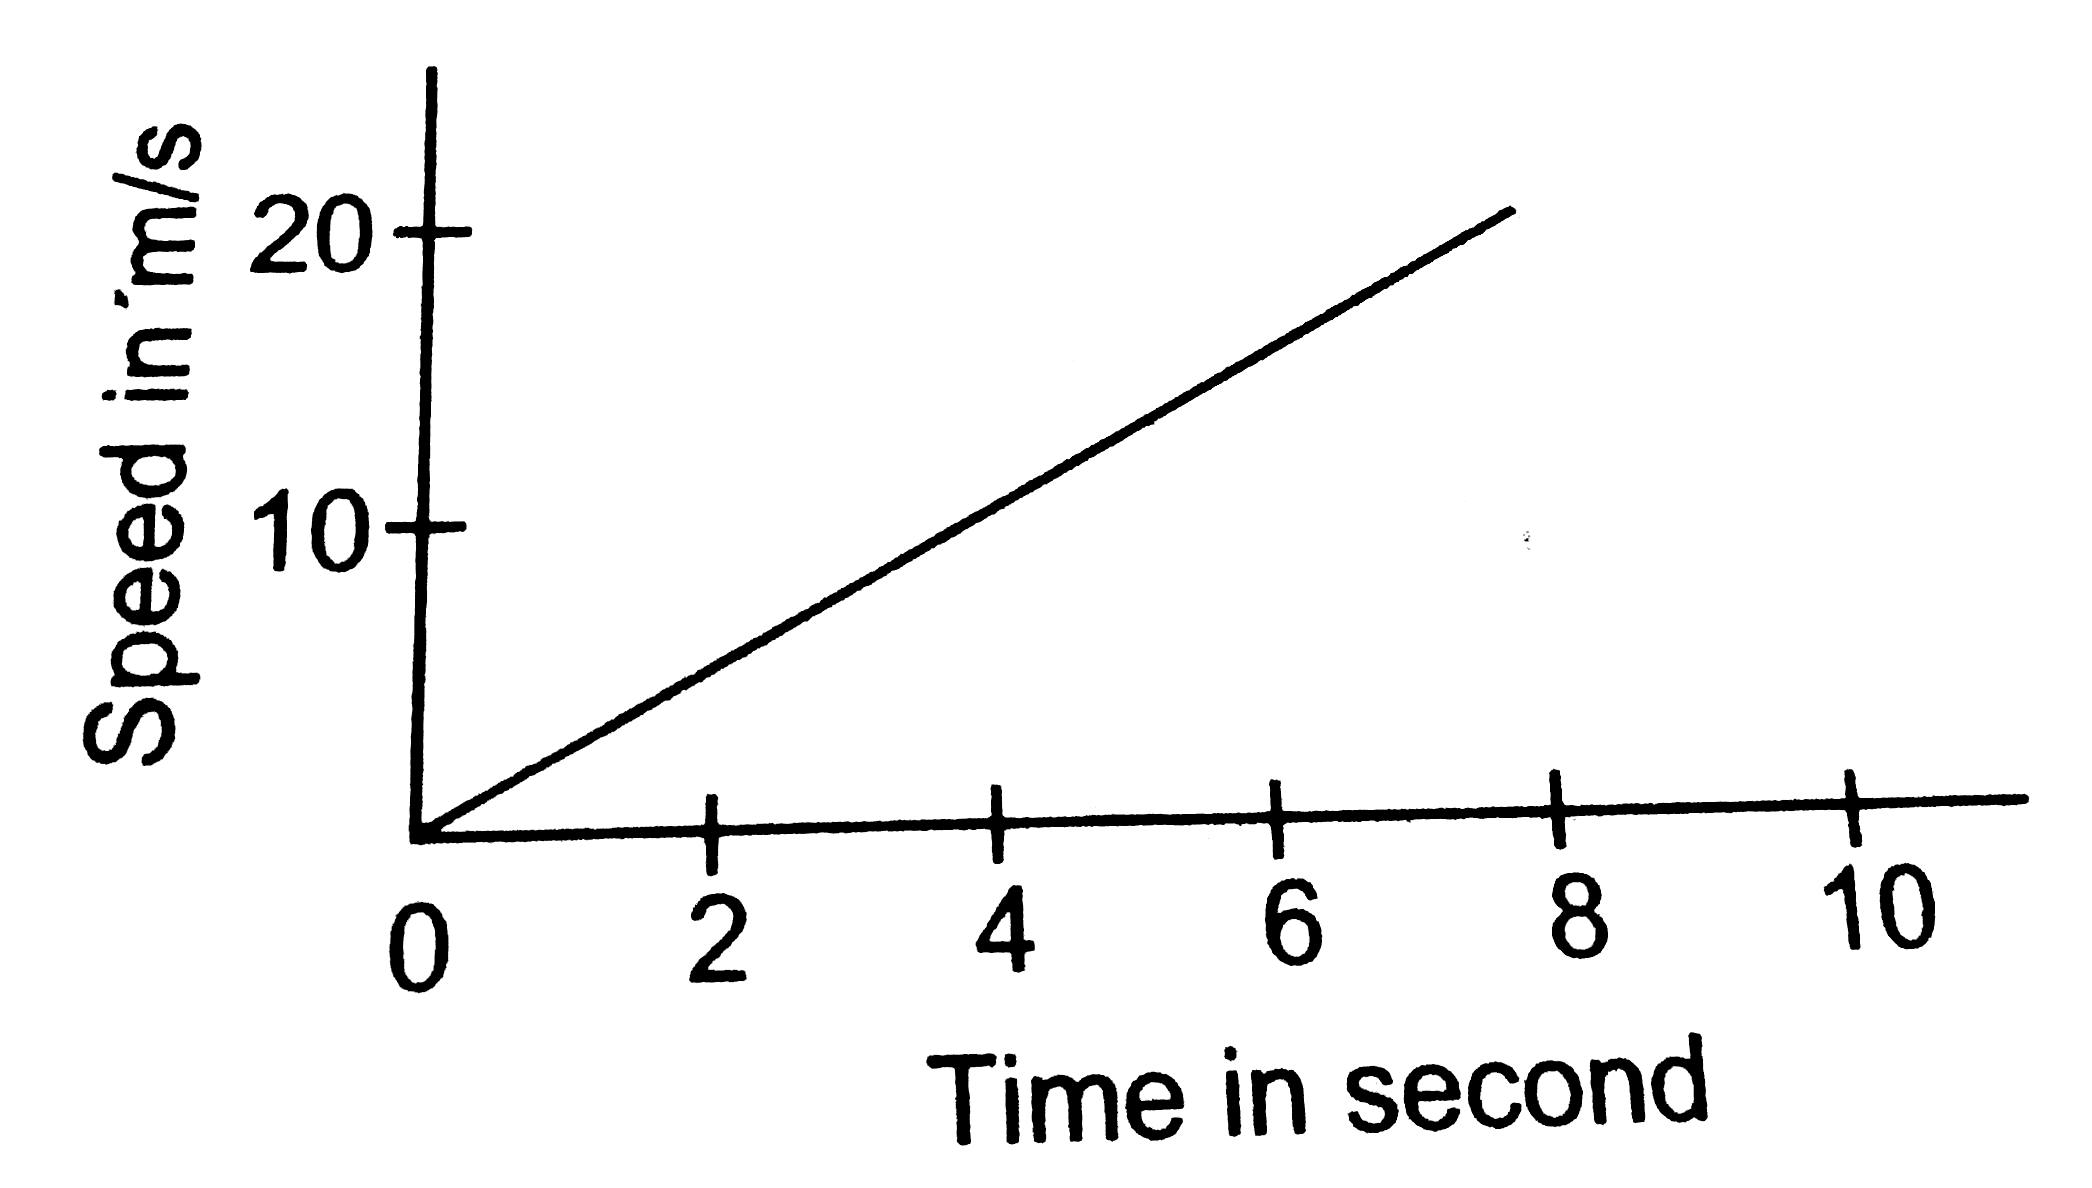
Find the distance travelled by the car in 8 seconds and its acceleration.
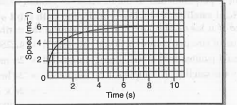
View SolutionSpeed - time graph for a car is show in the fig 1.13:Which part of the graph represents uniform motion of the car ?
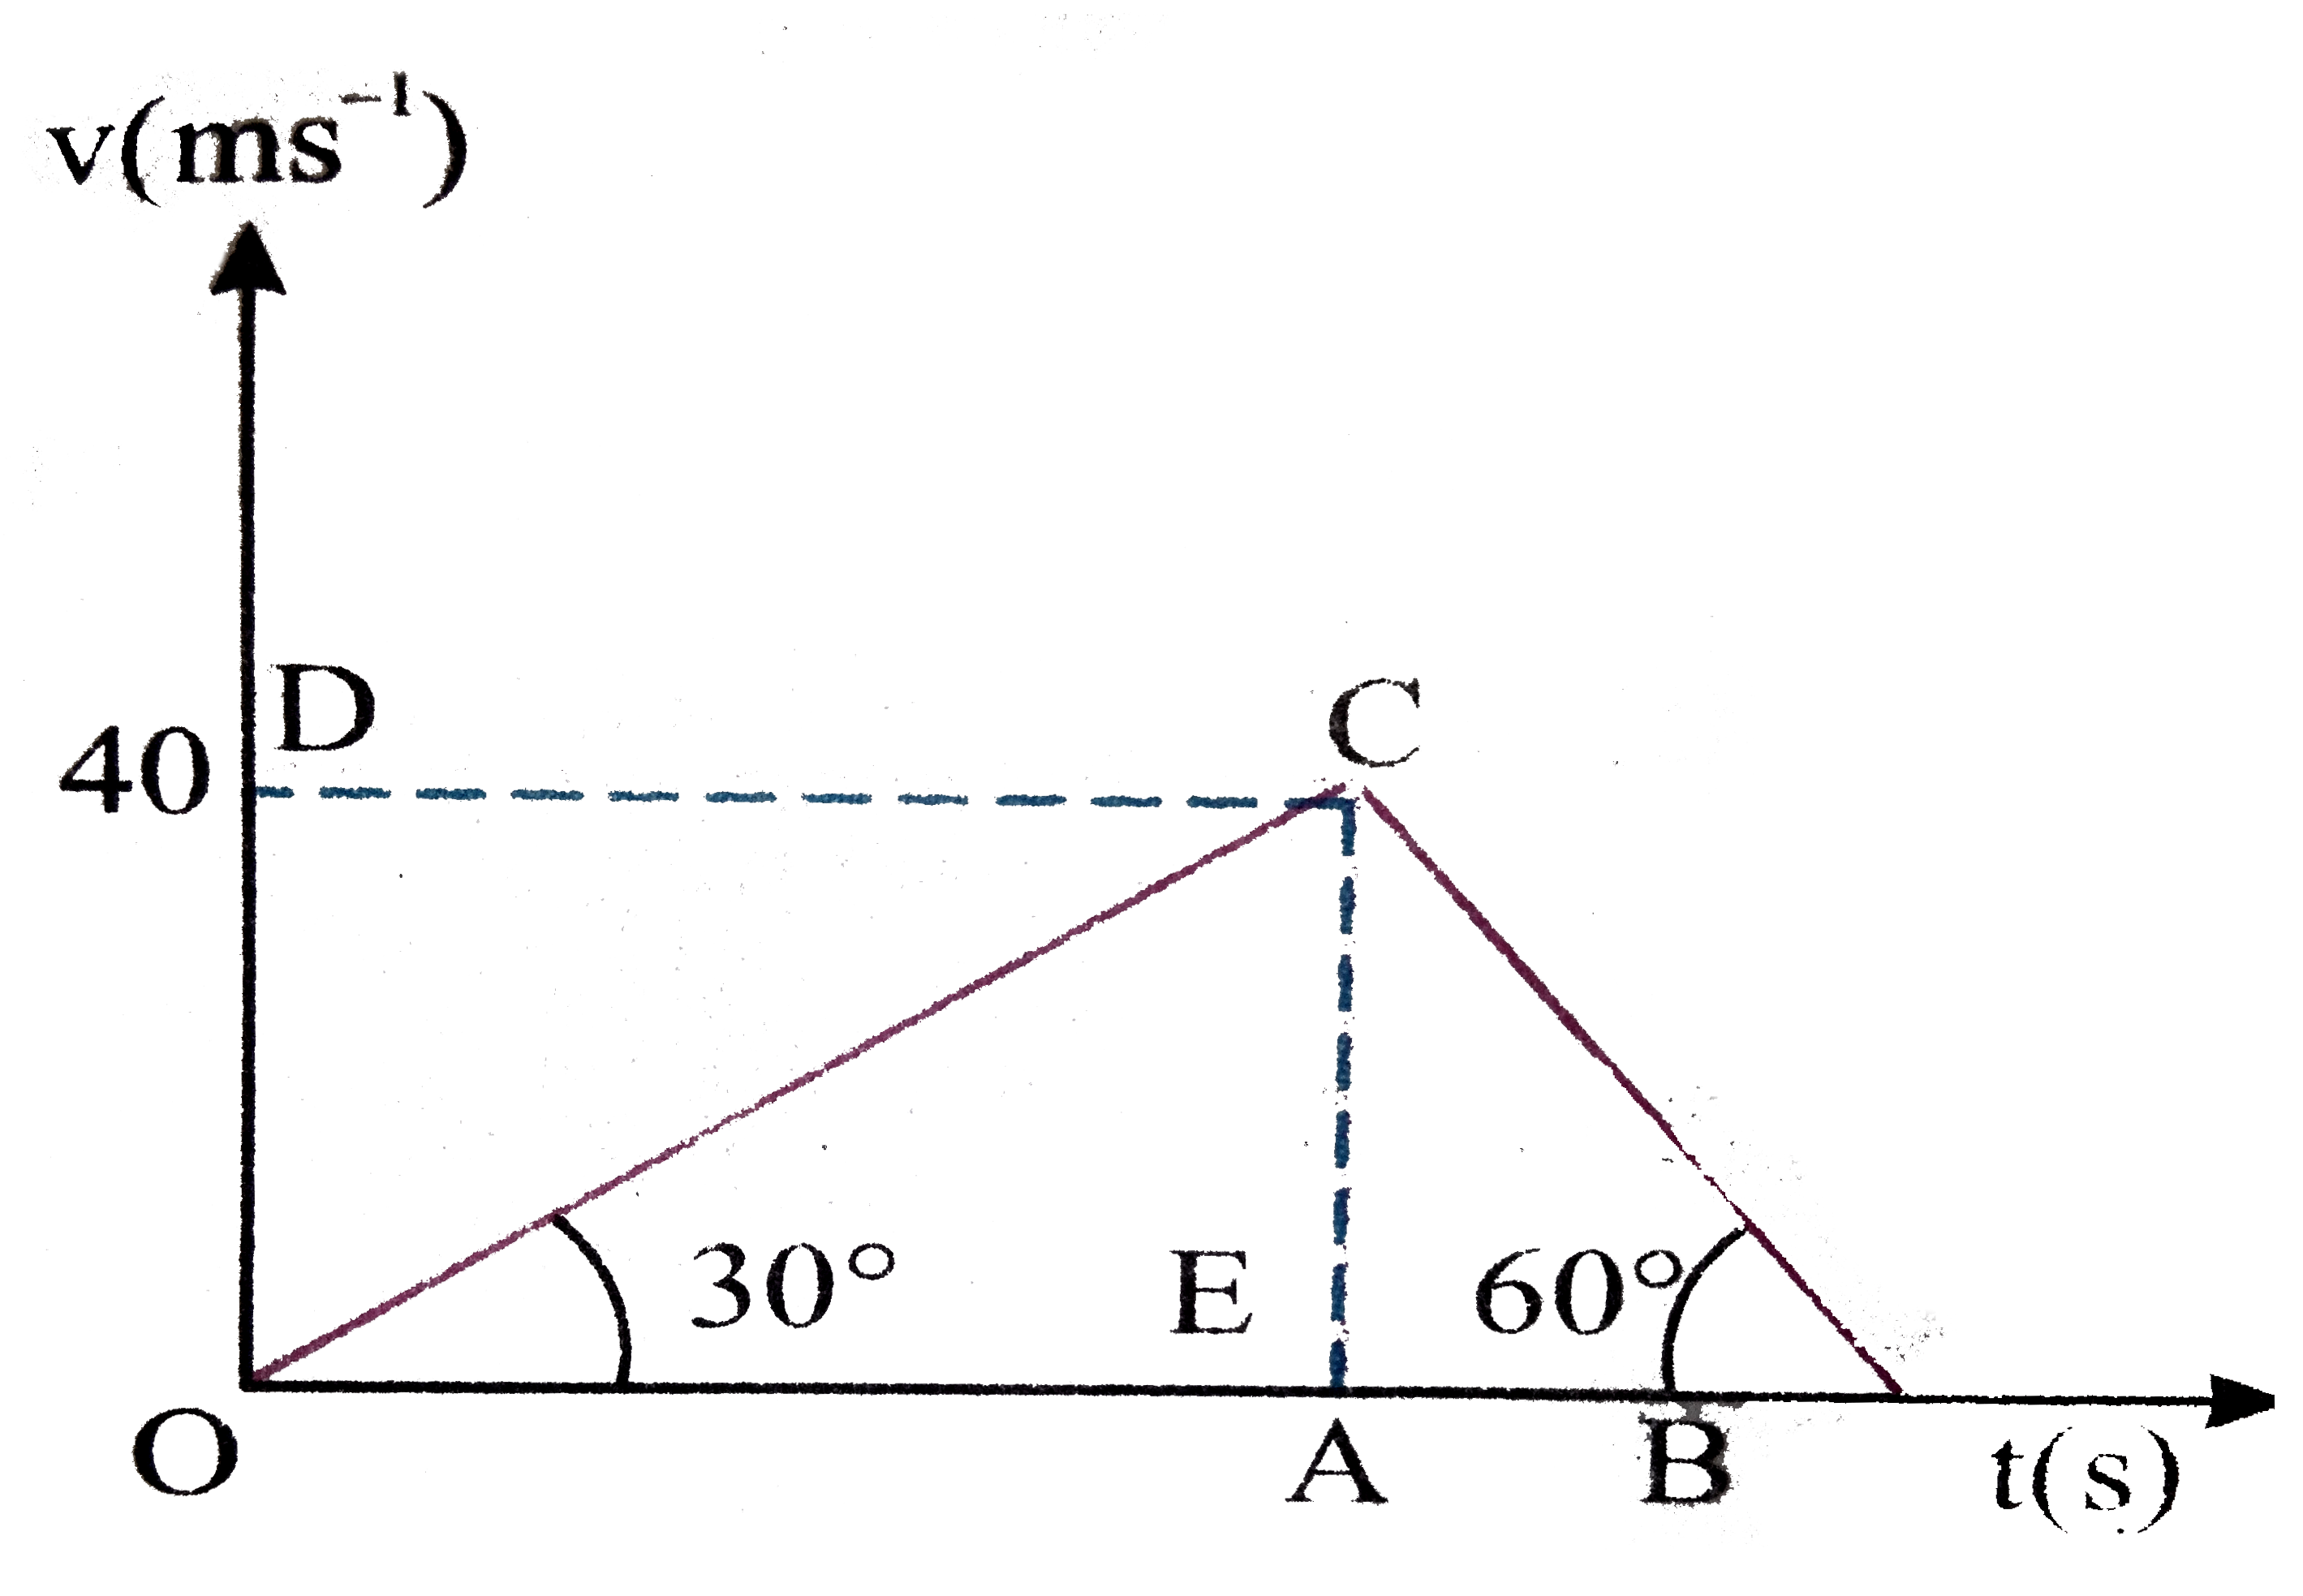
View SolutionThe velocity-time graph of a body is shown in figure. The ratio of magnitude of average acceleration during the intervals OA and AB is
View SolutionA car is moving with speed 20ms−1 on a circular path of radius 100 m. Its speed is increasing at a rate of 3ms−2 . The magnitude of the acceleration of the car at that moment is
View SolutionA car speeds up in a circular path. Which of the following figures illustrates the acceleration of the car?
View Solution

