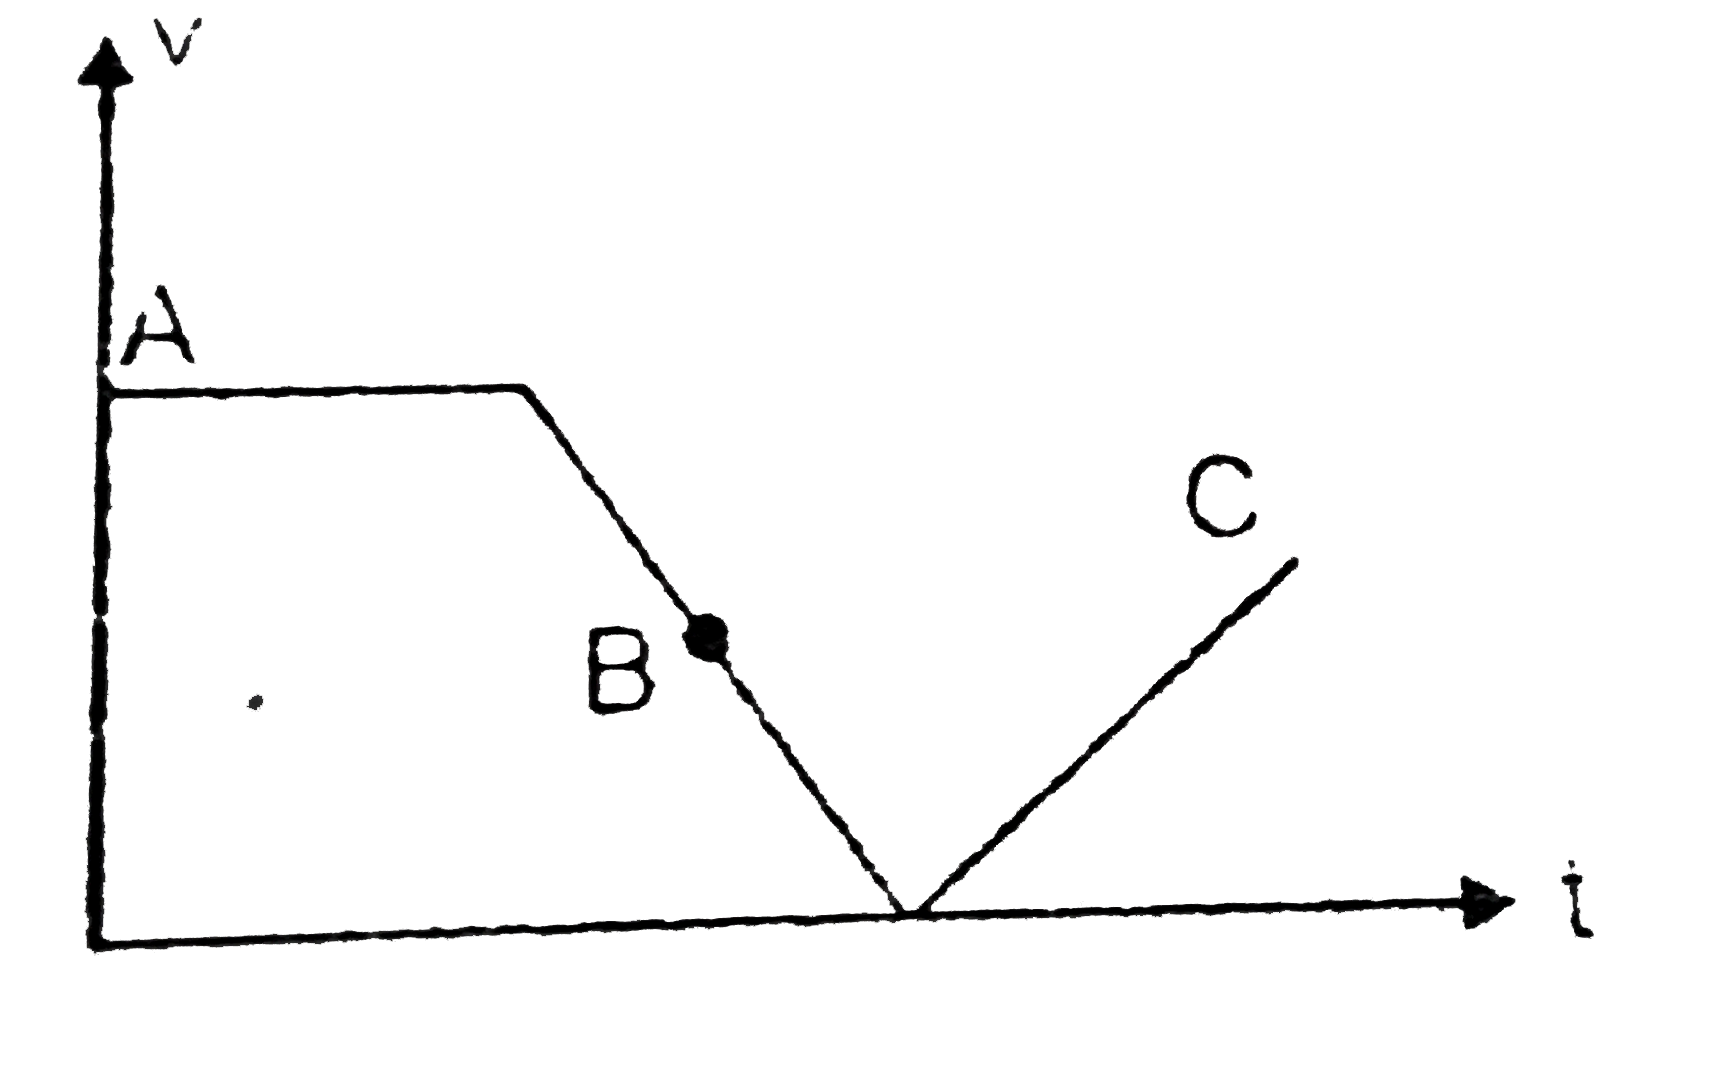
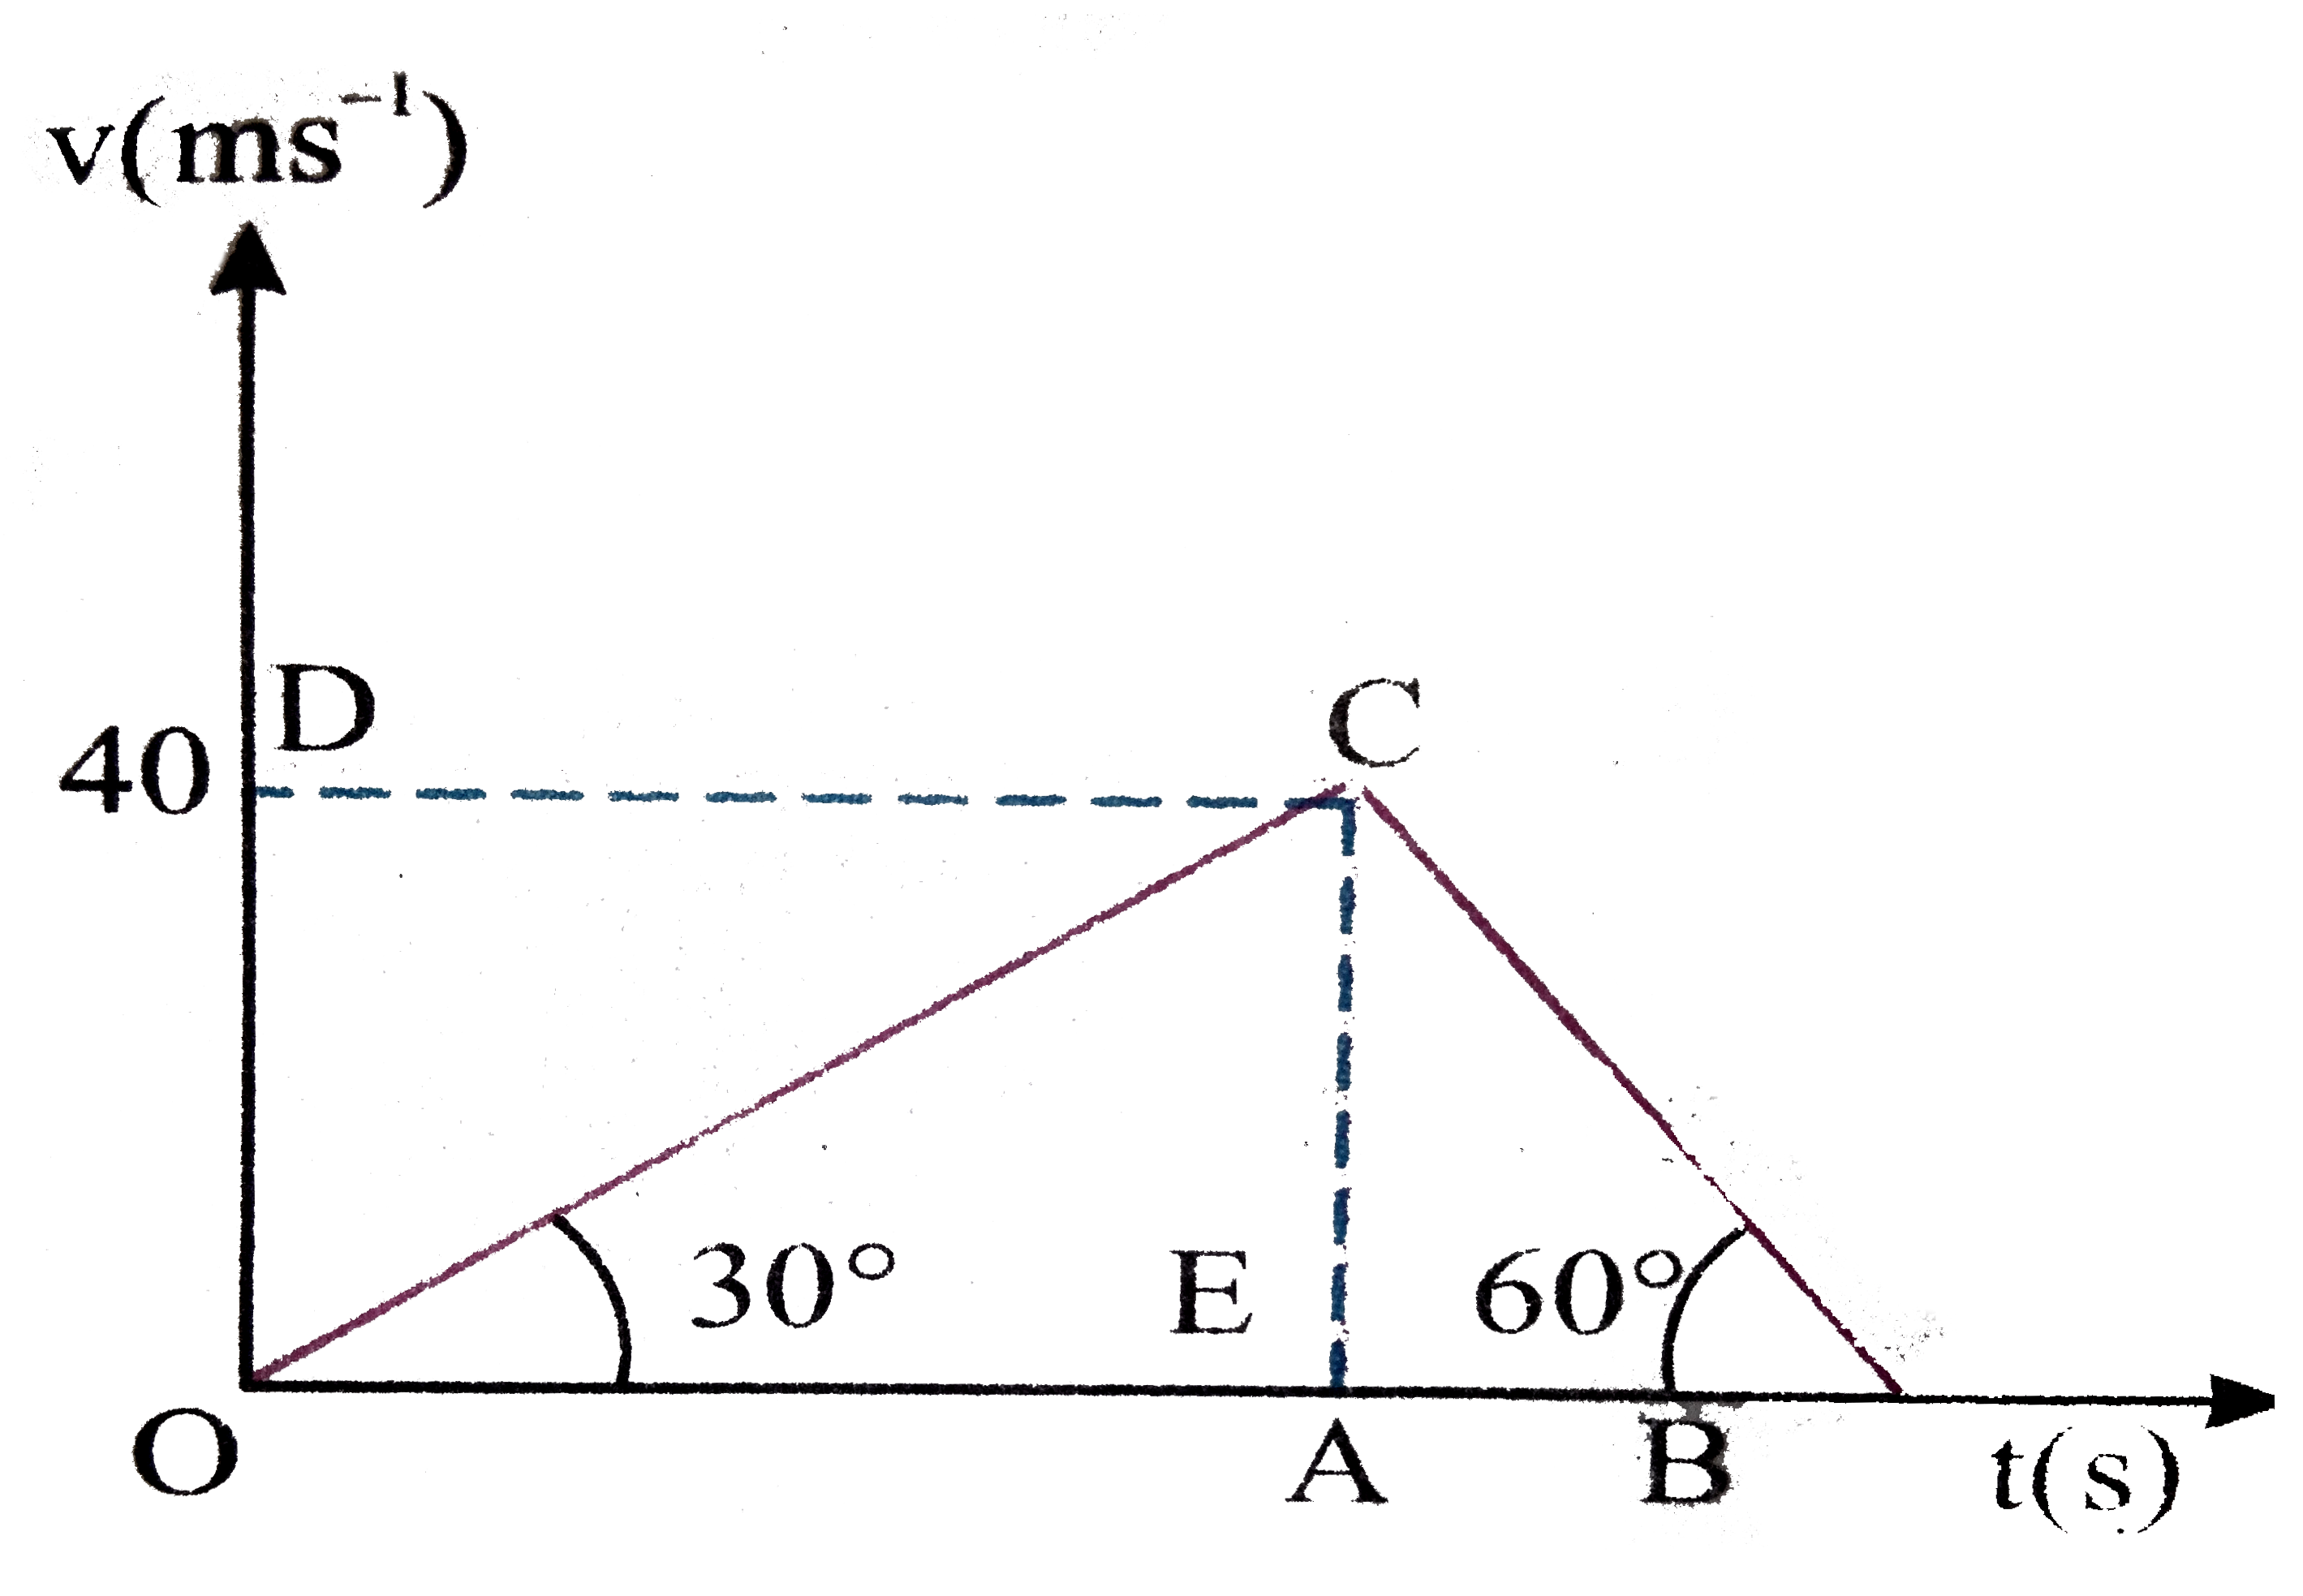
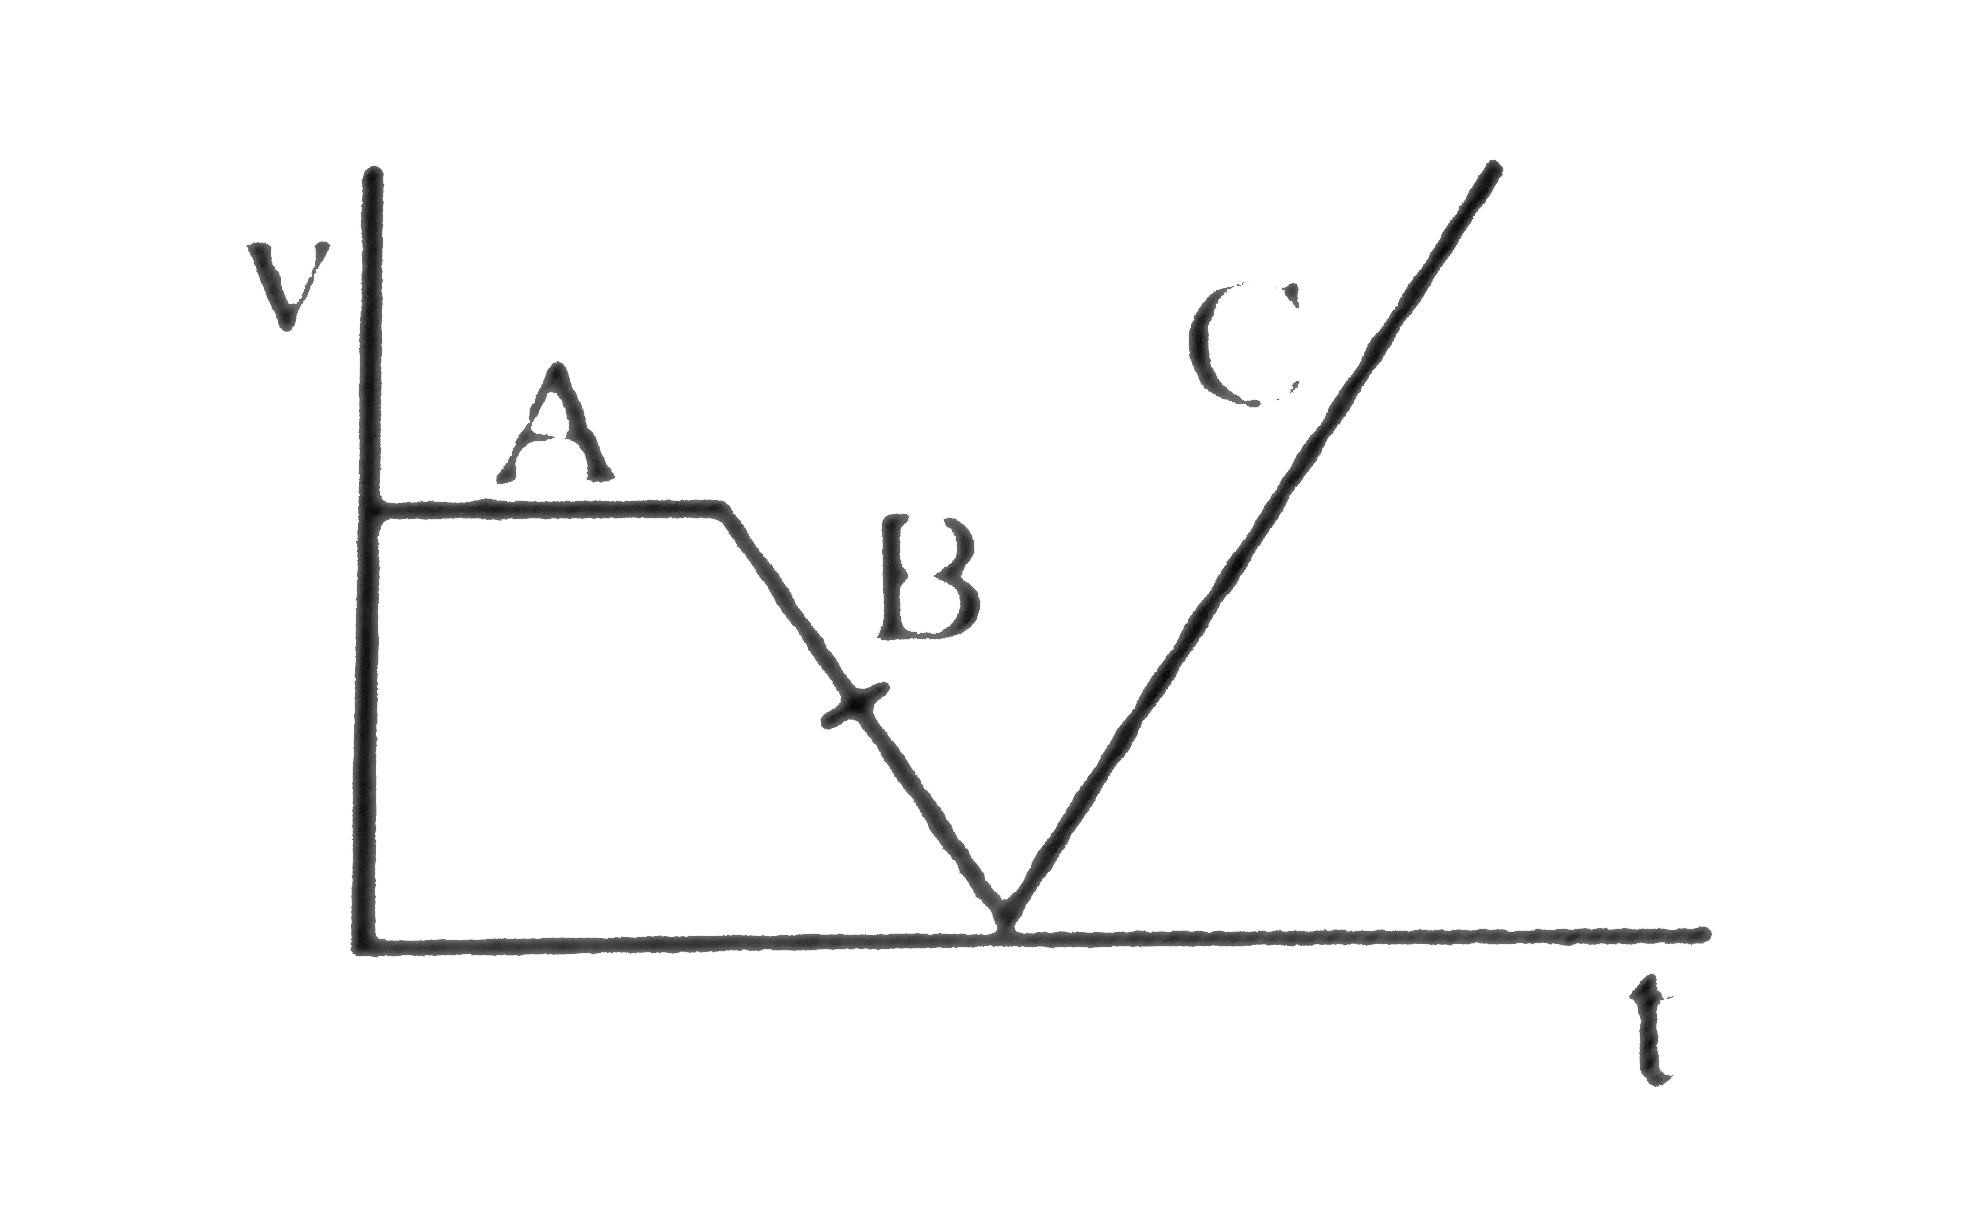
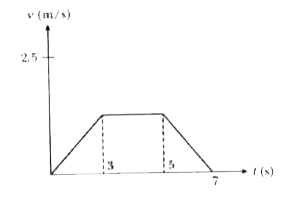
The velocity-time graph of a body is shown in figure. The ratio of magnitude of average acceleration during the intervals OA and AB is
A
1
B
12
C
13
D
3
Video Solution
Text Solution
The correct Answer is:C
During OA, acceleration =tan30∘=1√3ms−2
During AB, acceleration =−tan60∘=−√3ms−2
requried ratio =1/√3√3=13
|
Topper's Solved these Questions
- MOTION IN A STRAIGHT LINEBook:NARAYNAChapter:MOTION IN A STRAIGHT LINEExercise:Comprehension Question
Explore 5 Videos
- MOTION IN A STRAIGHT LINEBook:NARAYNAChapter:MOTION IN A STRAIGHT LINEExercise:Level 1 H.W
Explore 23 Videos
- MOTION IN A STRAIGHT LINEBook:NARAYNAChapter:MOTION IN A STRAIGHT LINEExercise:Integer Type Question
Explore 13 Videos
- MOTION IN A PLANEBook:NARAYNAChapter:MOTION IN A PLANEExercise:Level-II(H.W)
Explore 31 Videos
- NEWTONS LAWS OF MOTIONBook:NARAYNAChapter:NEWTONS LAWS OF MOTIONExercise:PASSAGE TYPE QUESTION
Explore 6 Videos
Similar Questions
Knowledge Check
The velocity − time graph of a particle is as shown in figure
 AIt moves with a constant acceleration throughoutBIt moves with an acceleration of constant magnitude but changing direction at the end of every two secondCThe displacement of the particle is zeroDThe velocity becomes zero at t=4 second
The velocity-time graph of a body is shown in the figure, it implies that at point B
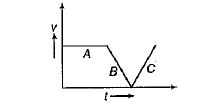 Athe force Is zeroBthere is a force toward motionCthere Is a force which opposes motionDthere is only gravitational force
The velocity-time graph of a body is shown in .
The displacement of the body in 8s is.
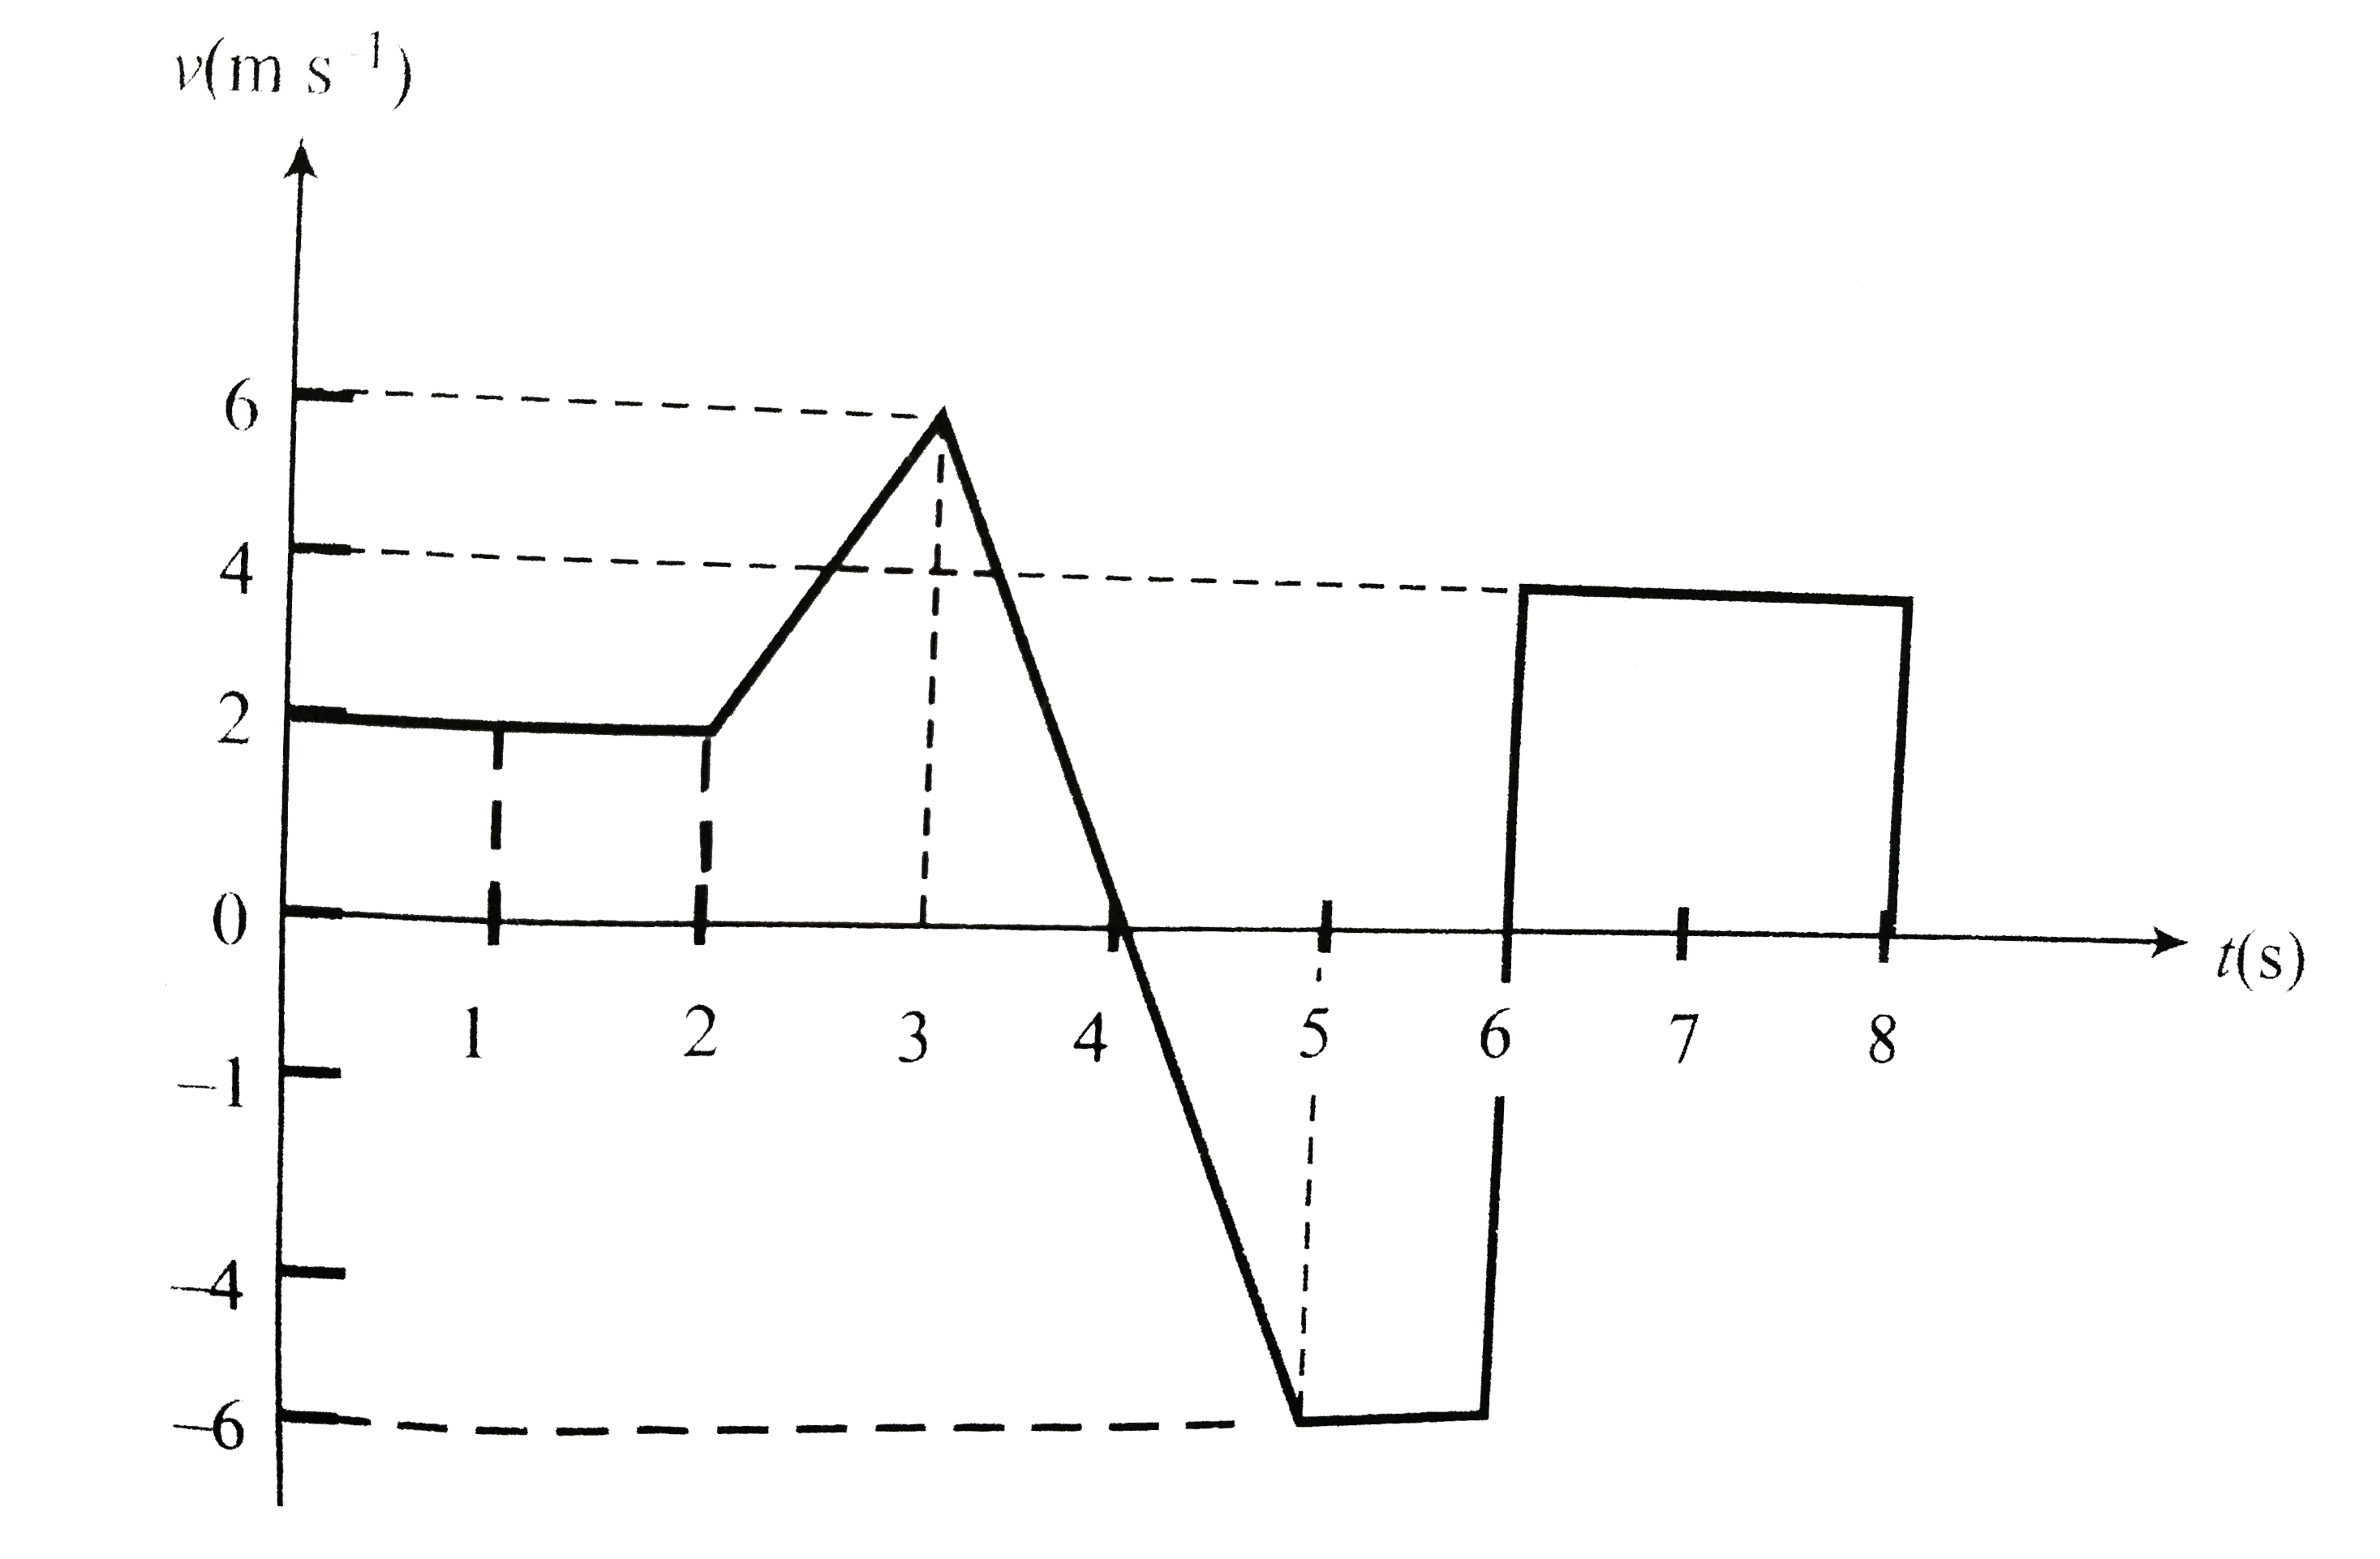 .A9mB12mC10mD28m
Velocity versus time graph of a body is shown in figure. It explains that
View SolutionThe velocity time graph of a body is as showh in
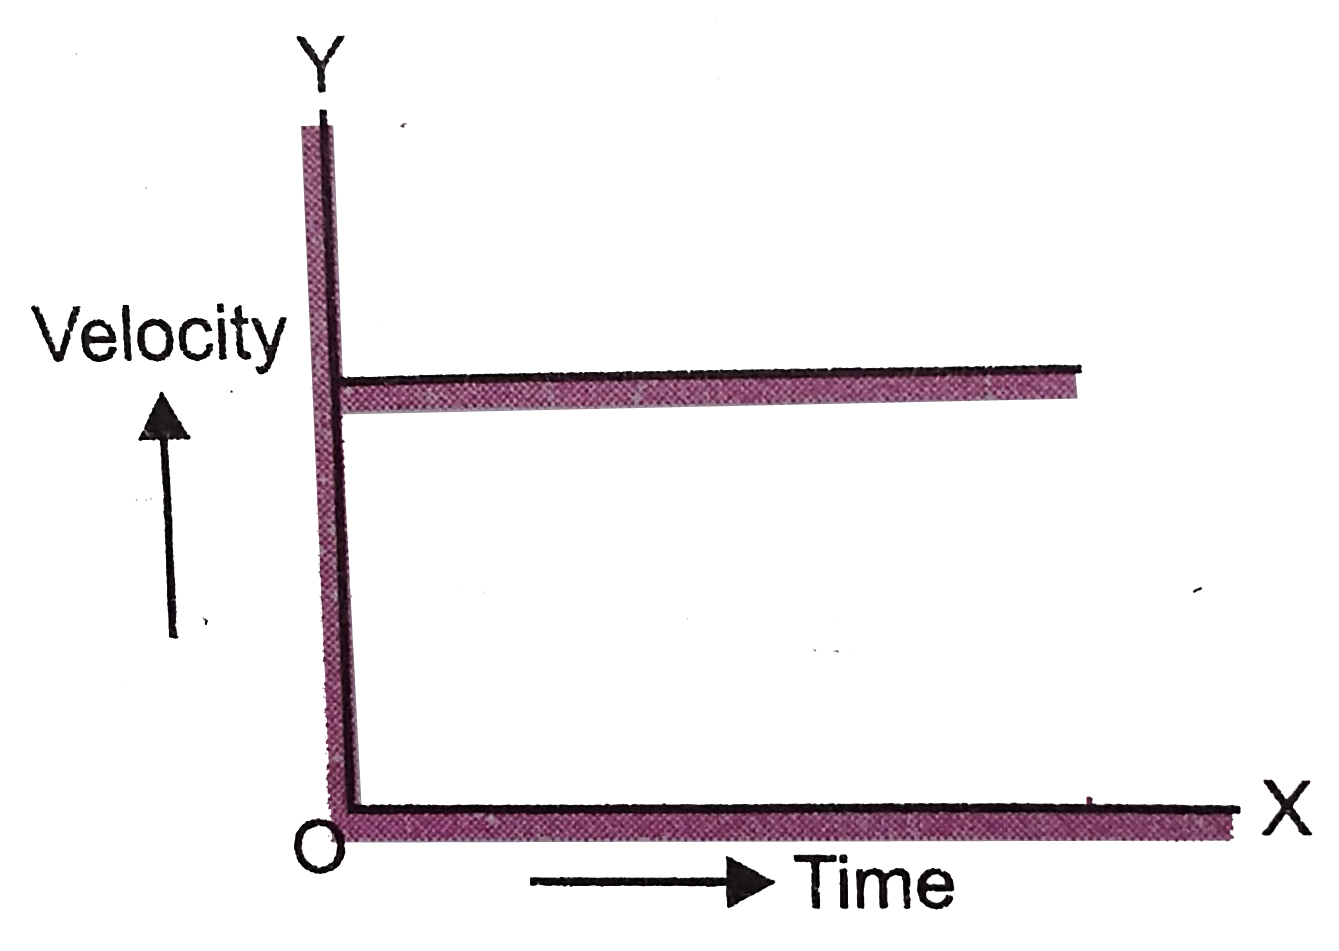
what would be the acceleration of the body ?
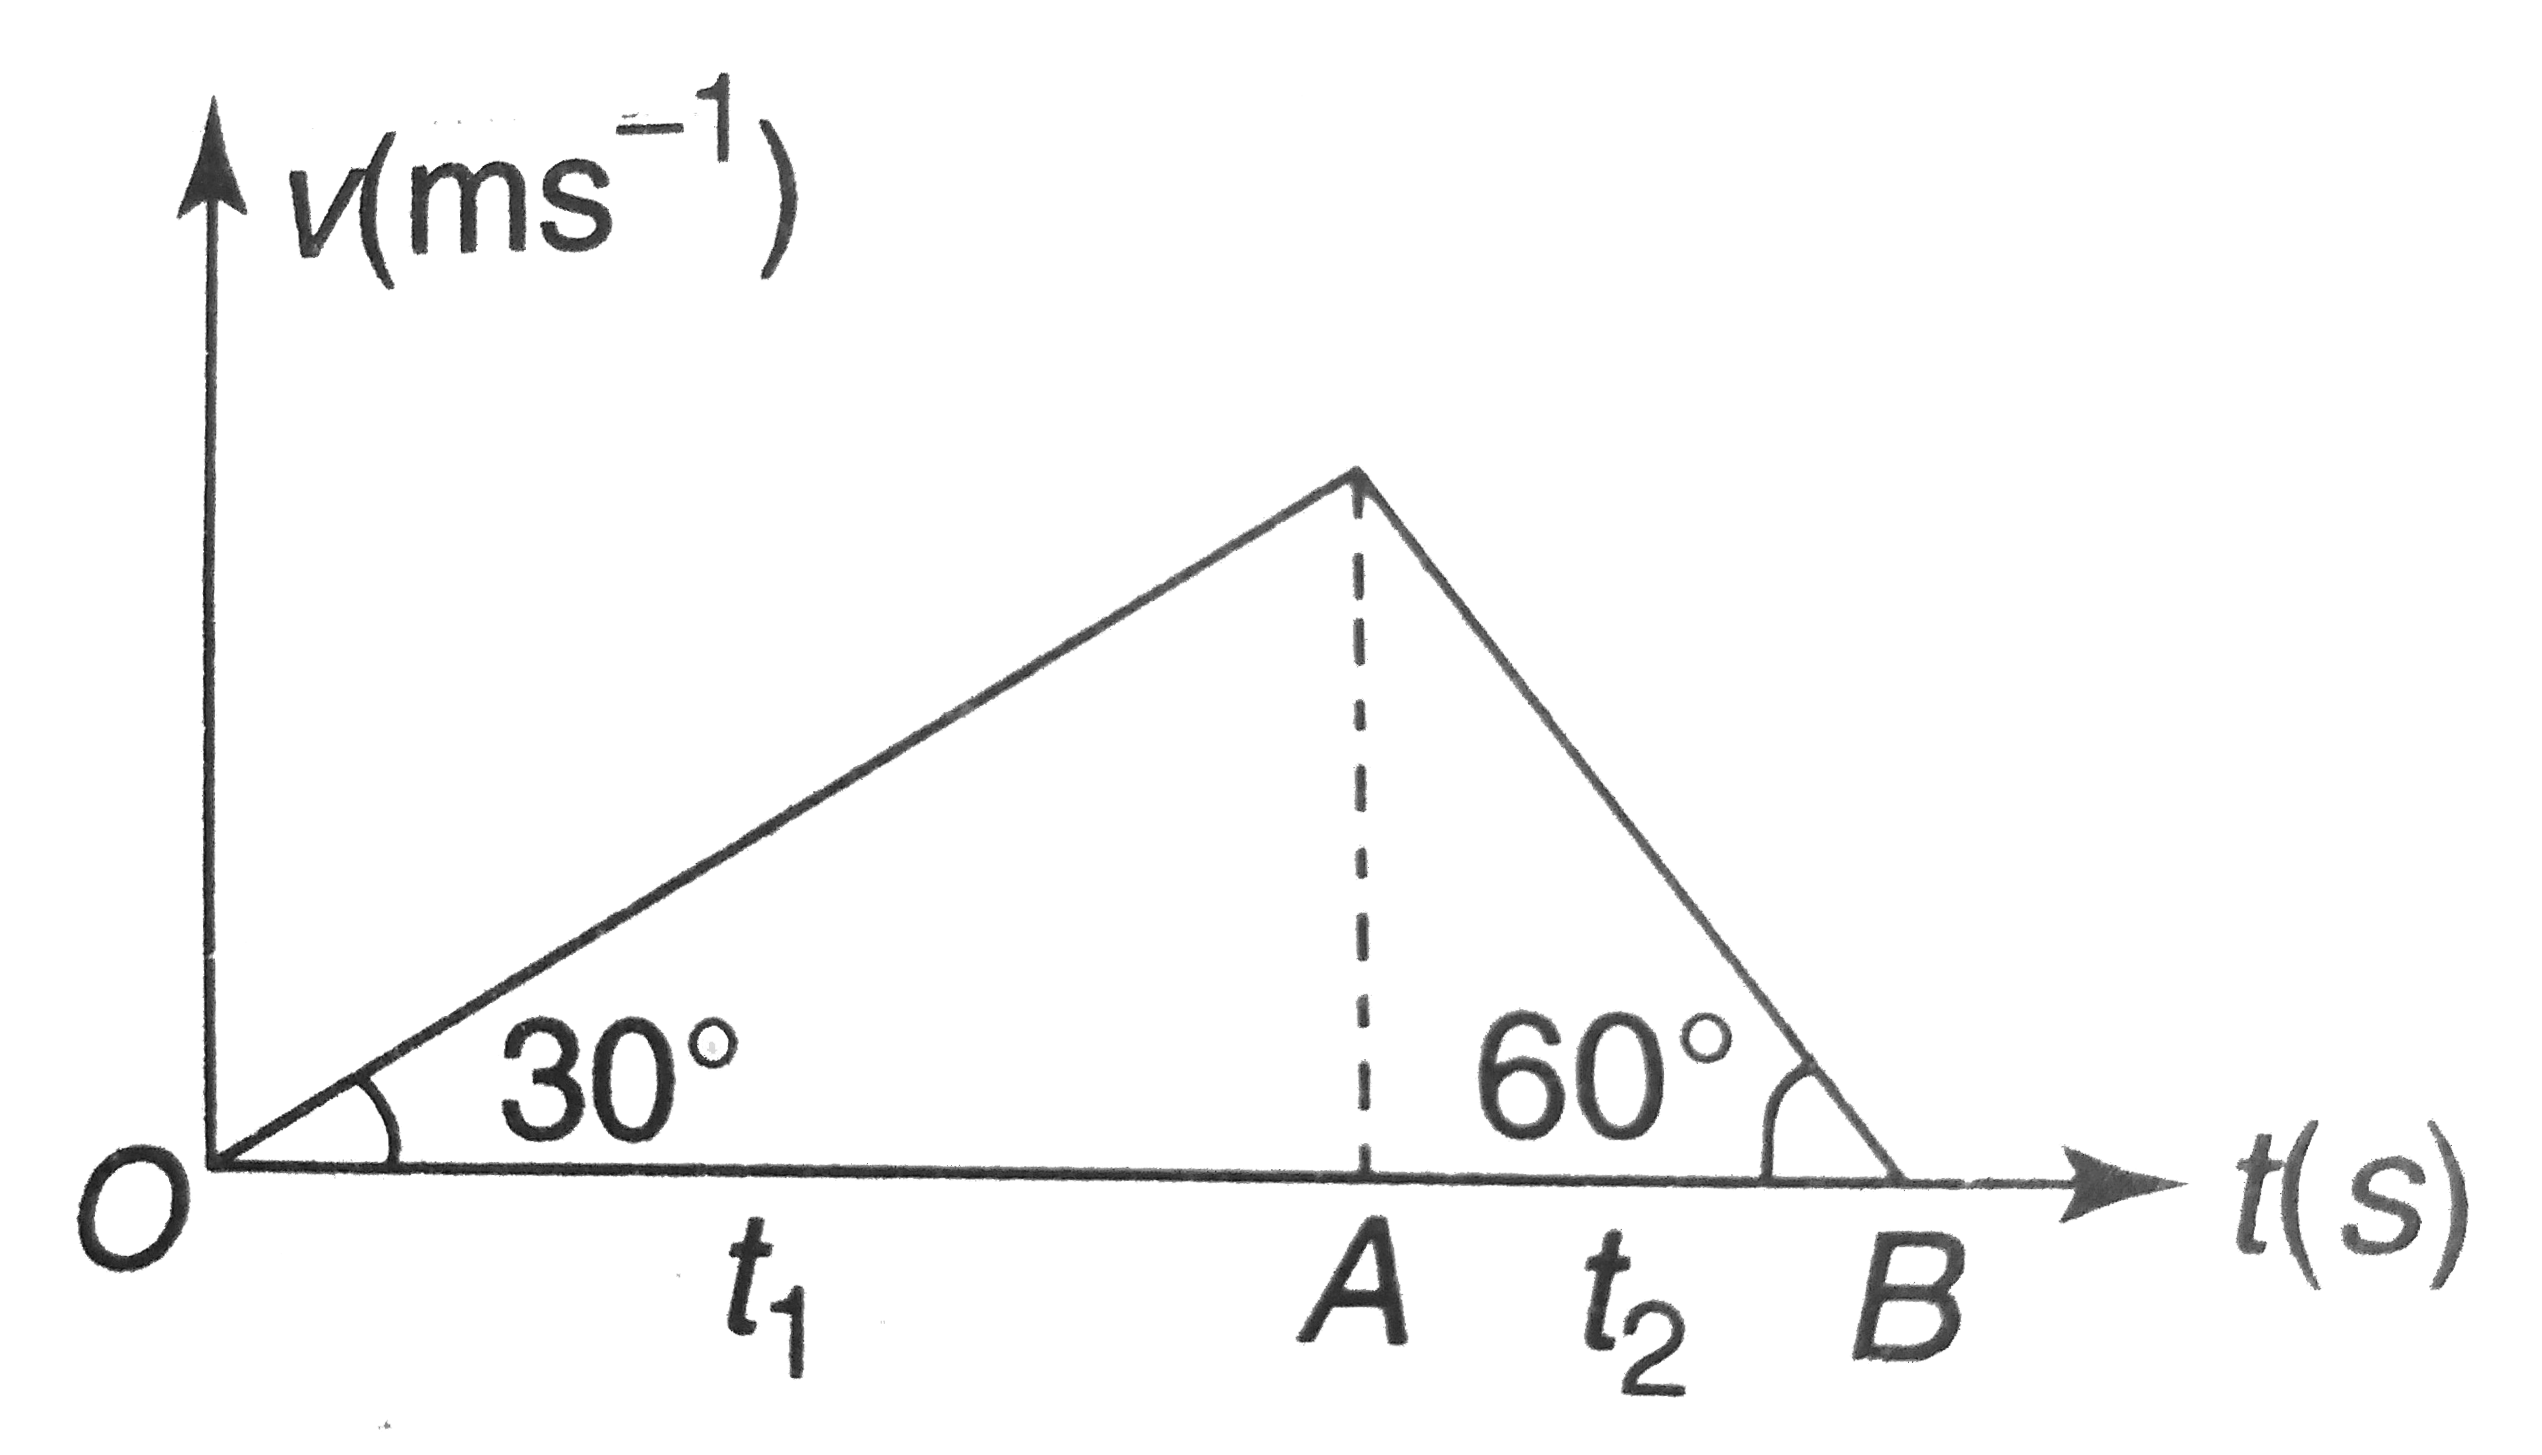
View SolutionThe velocity time graph of a body moving along a straight line is shown in figure. The ratio of the average velocities during the time t1 and t2 is.
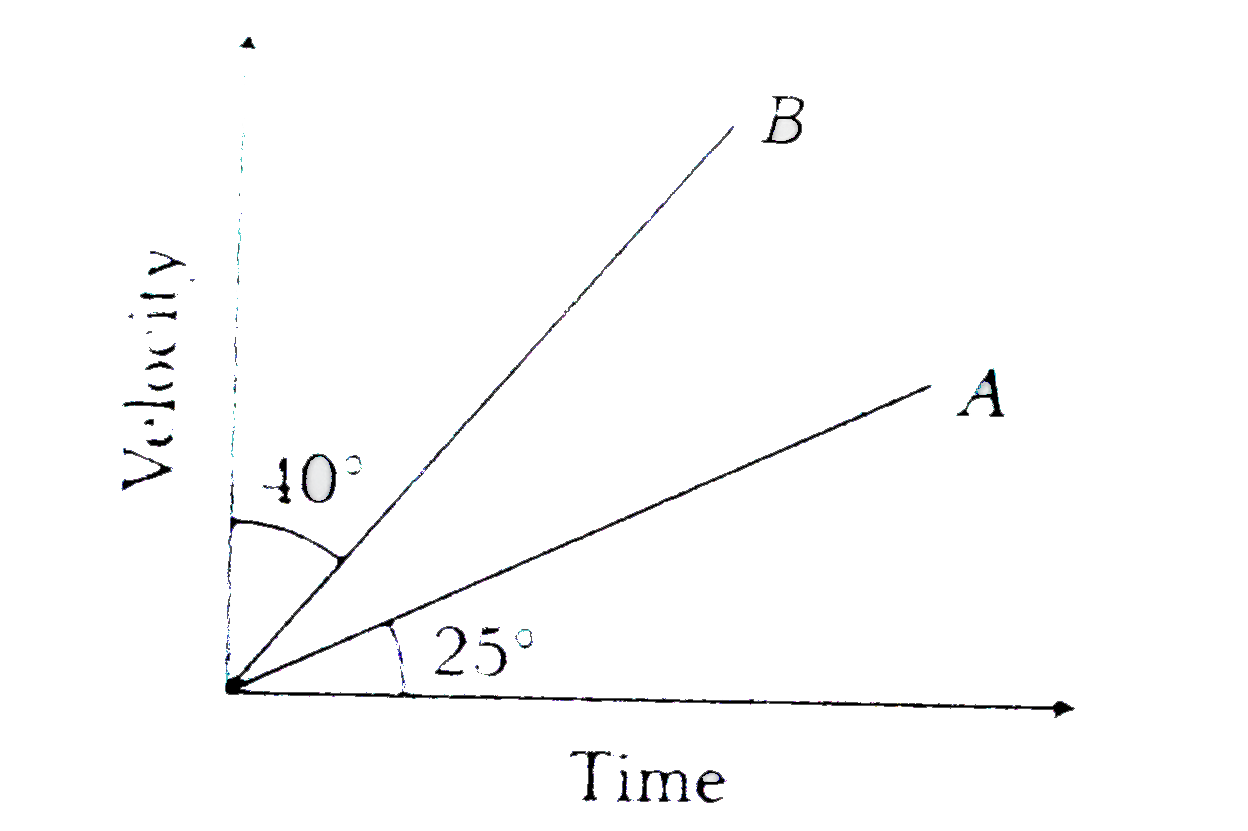
View SolutionThe velocity - time graph for two bodies A and B are shown in figure. Then, the acceleration of A and B are in the ratio
View SolutionThe velocity - time graph of a body is given in figure below .
The acceleration-time graph of the motion of the body is
View Solution


