A ball is thrown vertically upwards. Which of the following graph/graphs represent velocity time graph of the ball during its flight ( air resistance is neglected).
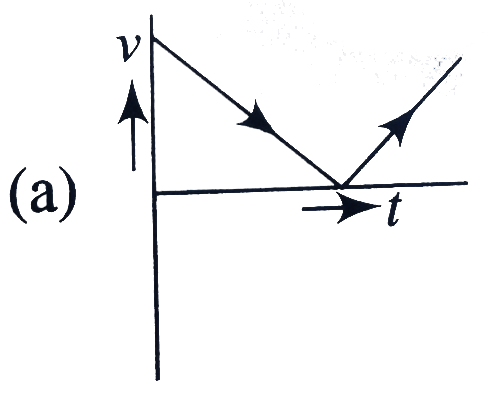
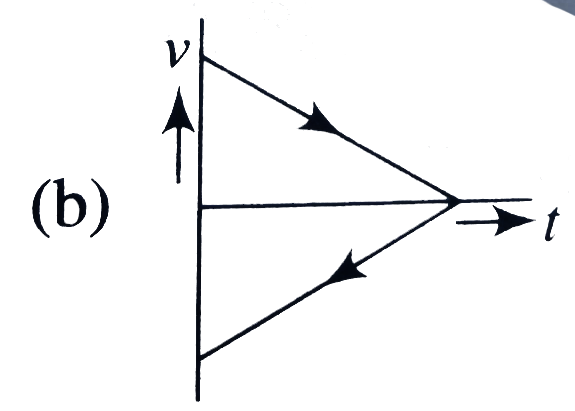


The correct Answer is:D
To solve the problem of determining the velocity-time graph for a ball thrown vertically upwards, we can analyze the motion step by step.
1. Understanding the Motion:
- When a ball is thrown vertically upwards, it initially moves upwards with a positive velocity. As it rises, it slows down due to the acceleration of gravity acting in the opposite direction.
2. Velocity at the Highest Point:
- At the highest point of its trajectory, the ball's velocity becomes zero. This is the point where it stops moving upwards before it starts descending.
3. Velocity During Descent:
- After reaching the highest point, the ball starts to fall back down. During this phase, the velocity increases in the negative direction (downwards) as it accelerates due to gravity.
4. Graph Characteristics:
- The velocity-time graph will start from a positive value (initial velocity when thrown upwards), decrease linearly to zero at the highest point, and then continue to decrease into the negative region as the ball falls back down, indicating increasing speed in the downward direction.
5. Acceleration:
- The acceleration due to gravity is constant and acts downwards throughout the motion. This means the slope of the velocity-time graph will be negative (indicating a decrease in velocity while going up and an increase in velocity while coming down).
6. Final Graph:
- The resulting graph will be a straight line that starts from a positive value, slopes down to zero, and then continues into the negative region, forming a straight line with a negative slope.
Conclusion:
The correct velocity-time graph for a ball thrown vertically upwards (neglecting air resistance) will show a linear decrease to zero at the peak and then a linear increase into the negative region as it falls back down.
- When a ball is thrown vertically upwards, it initially moves upwards with a positive velocity. As it rises, it slows down due to the acceleration of gravity acting in the opposite direction.
- At the highest point of its trajectory, the ball's velocity becomes zero. This is the point where it stops moving upwards before it starts descending.
- After reaching the highest point, the ball starts to fall back down. During this phase, the velocity increases in the negative direction (downwards) as it accelerates due to gravity.
- The velocity-time graph will start from a positive value (initial velocity when thrown upwards), decrease linearly to zero at the highest point, and then continue to decrease into the negative region as the ball falls back down, indicating increasing speed in the downward direction.
- The acceleration due to gravity is constant and acts downwards throughout the motion. This means the slope of the velocity-time graph will be negative (indicating a decrease in velocity while going up and an increase in velocity while coming down).
- The resulting graph will be a straight line that starts from a positive value, slopes down to zero, and then continues into the negative region, forming a straight line with a negative slope.
The correct velocity-time graph for a ball thrown vertically upwards (neglecting air resistance) will show a linear decrease to zero at the peak and then a linear increase into the negative region as it falls back down.
Similar Questions
Knowledge Check
A ball is thrown vertically upwards. Which of the following plots represent the speed graph of the ball during its flight if the air resistence is not ignored?
A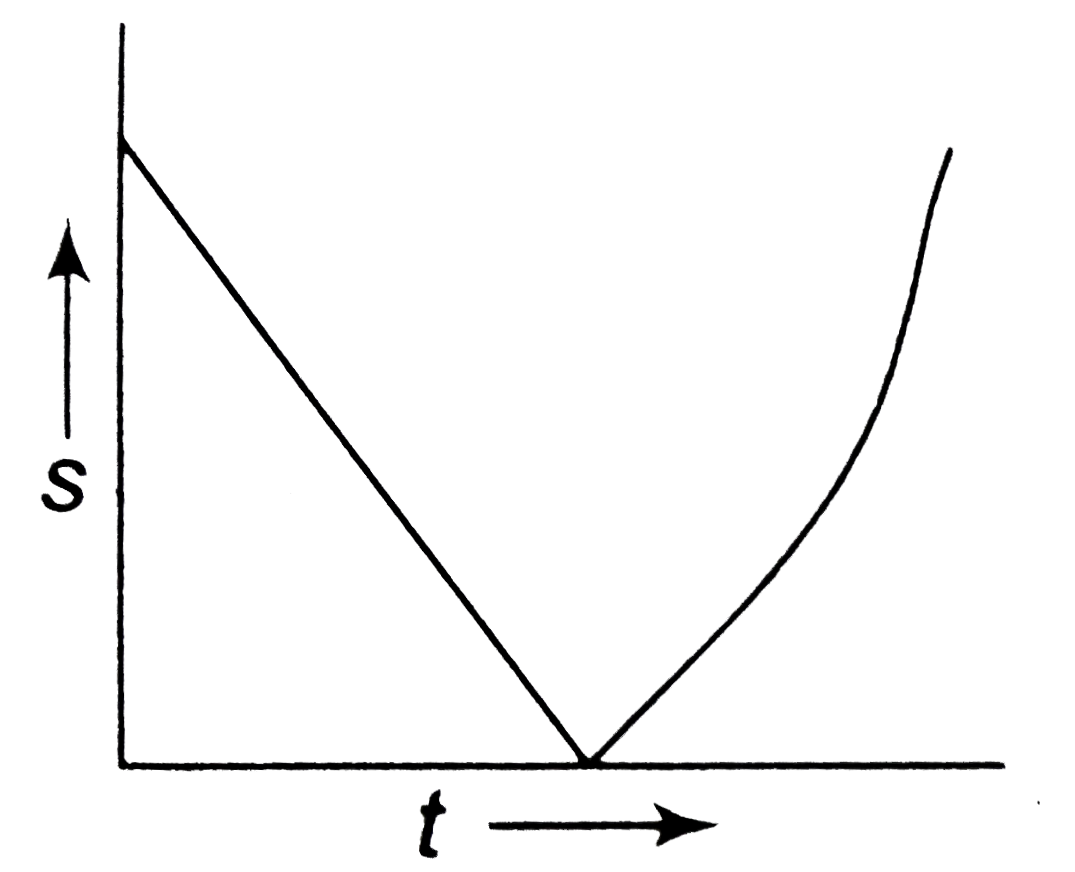 B
B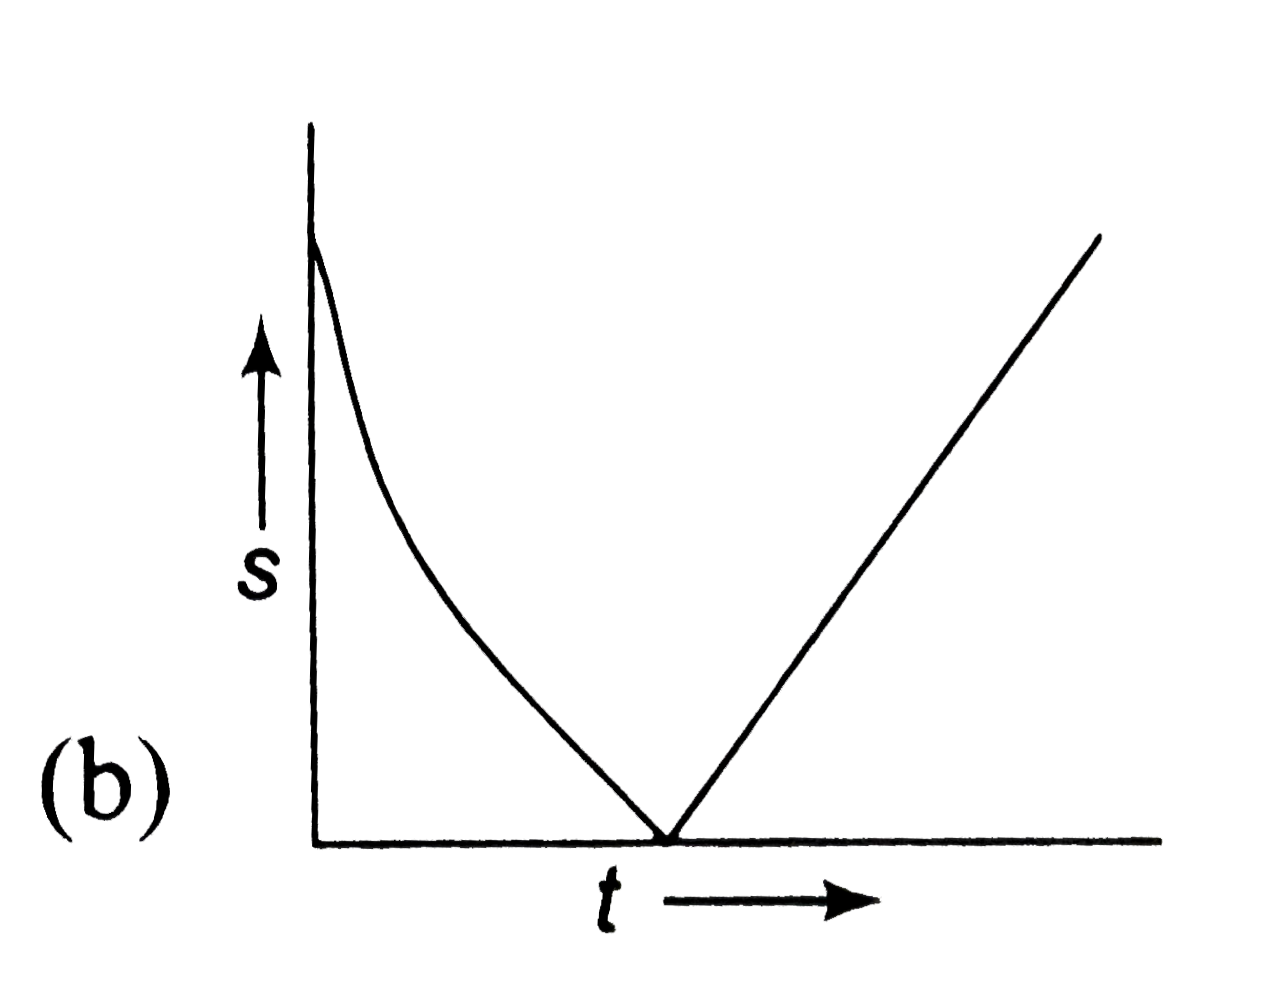 C
C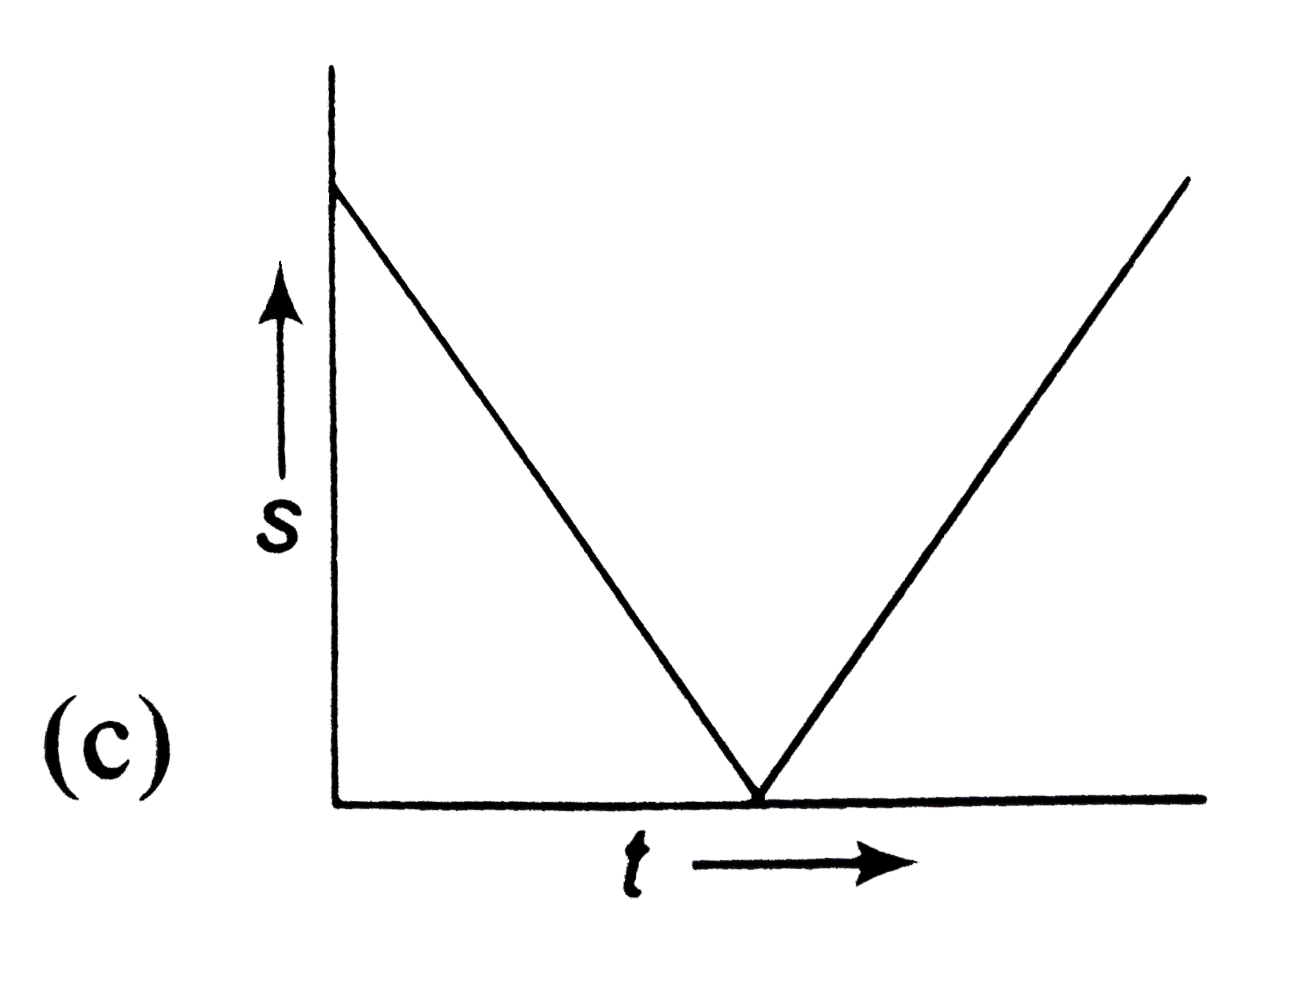 D
D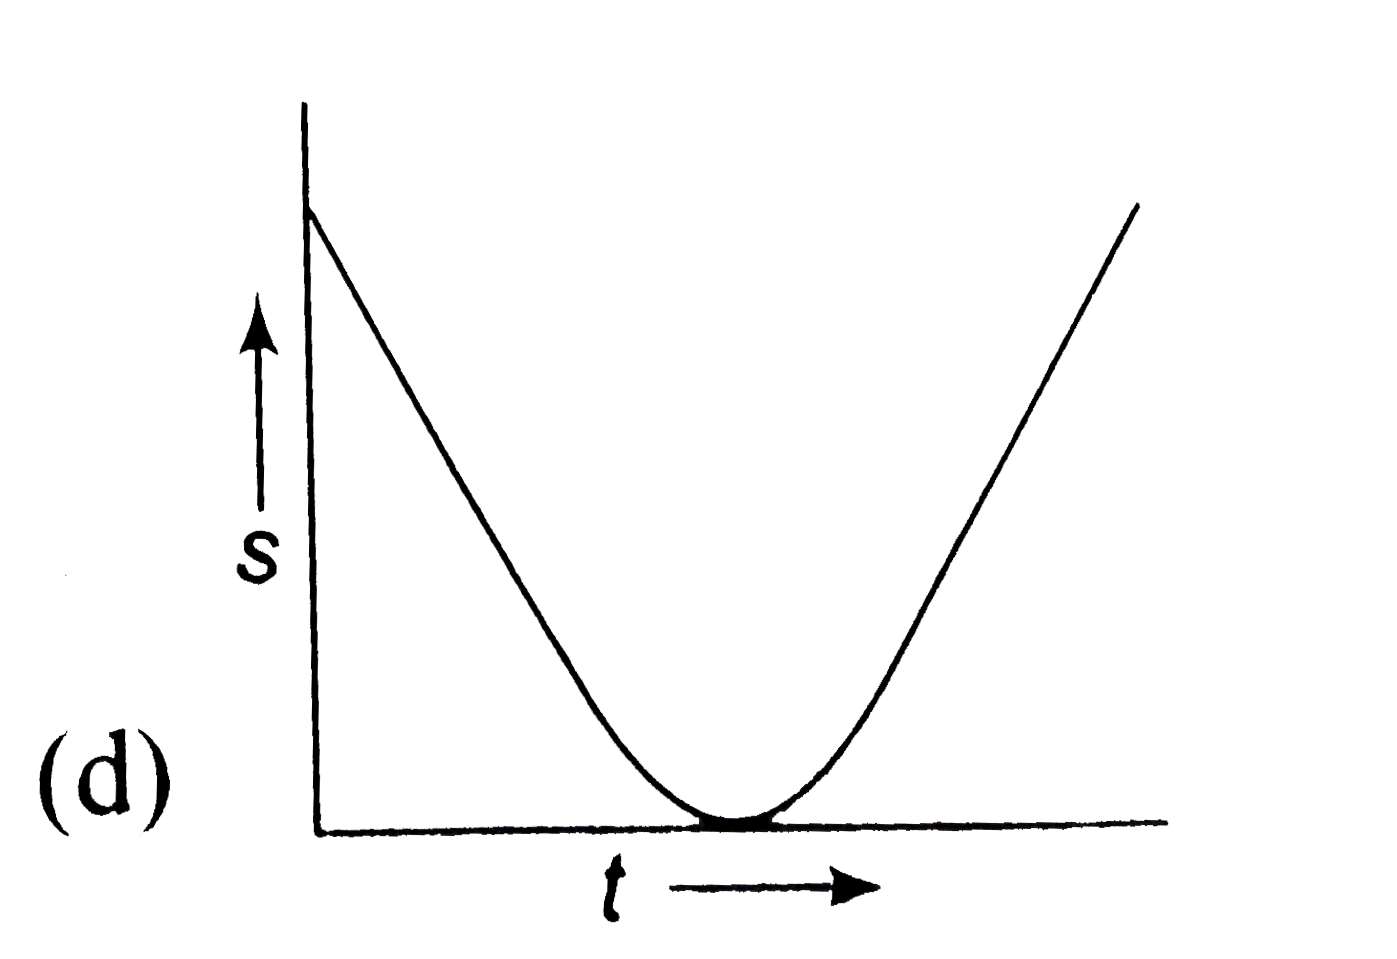
A ball is thrown vertically upwards. Which of the following plots represents the speed-time graph of the ball during its height if the air resistance is not ingnored ?
A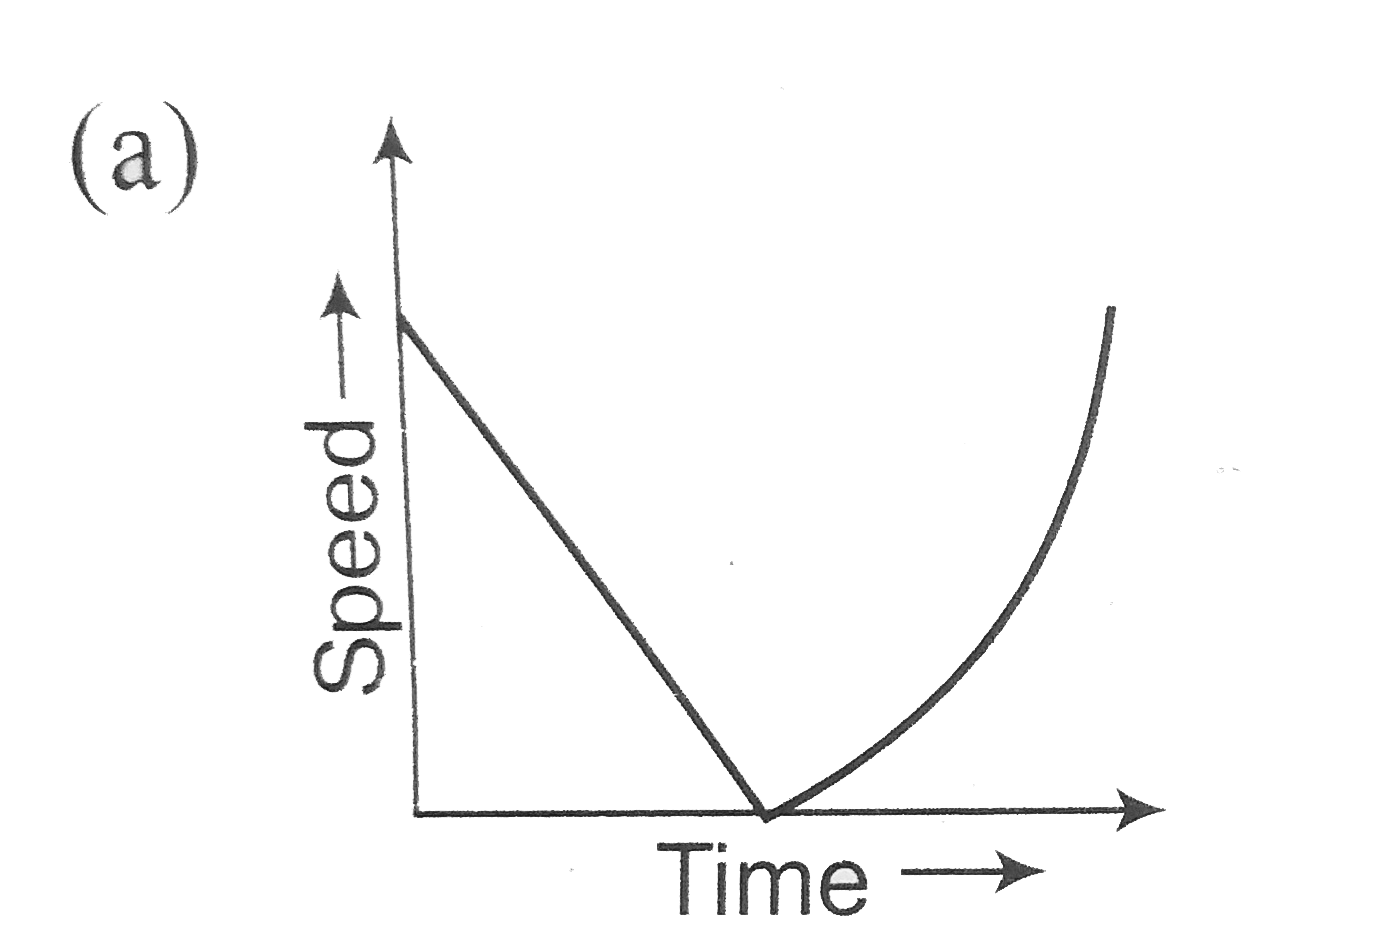 .B
.B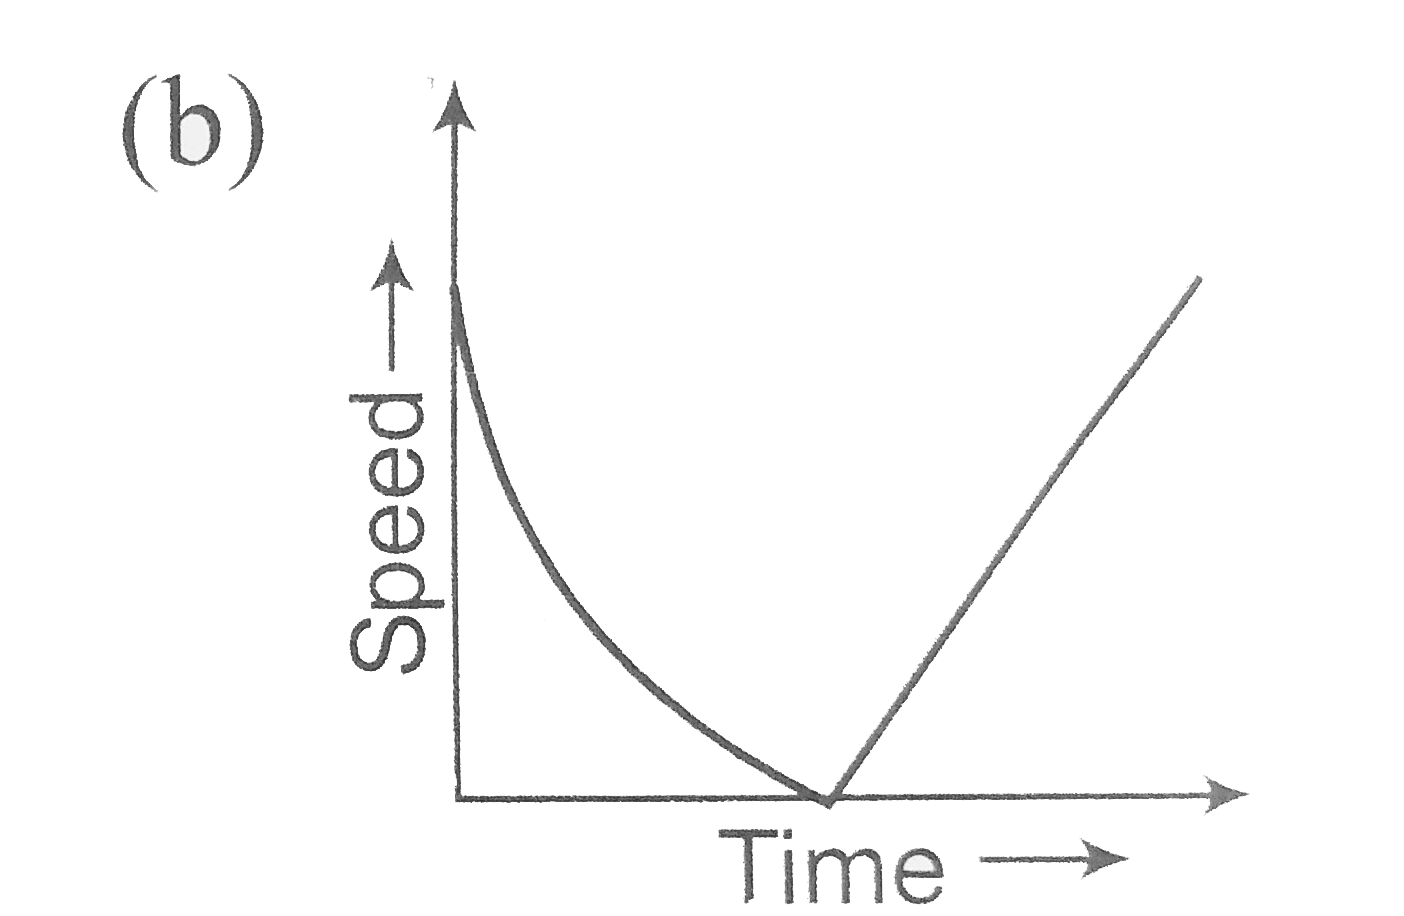 .C
.C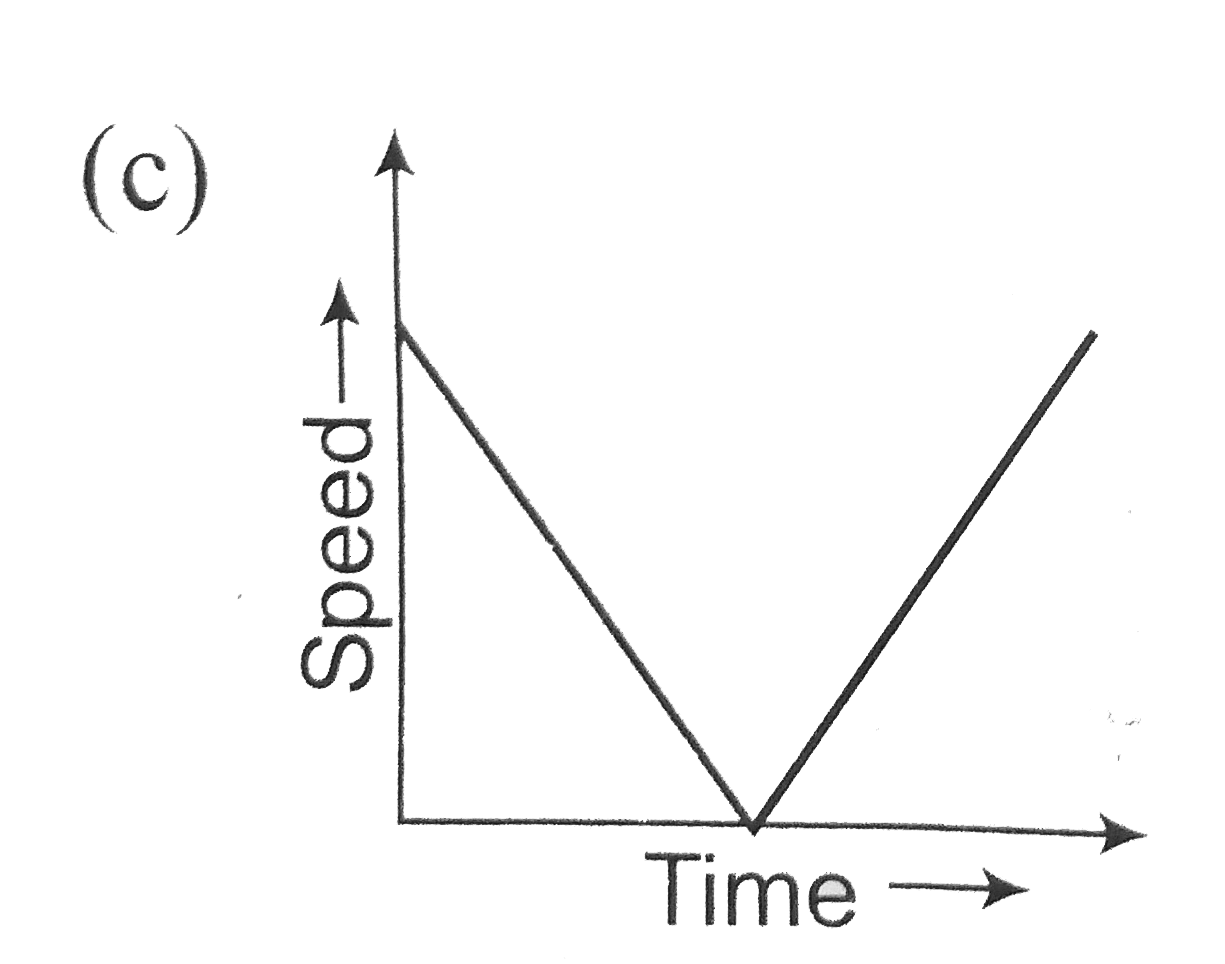 .D
.D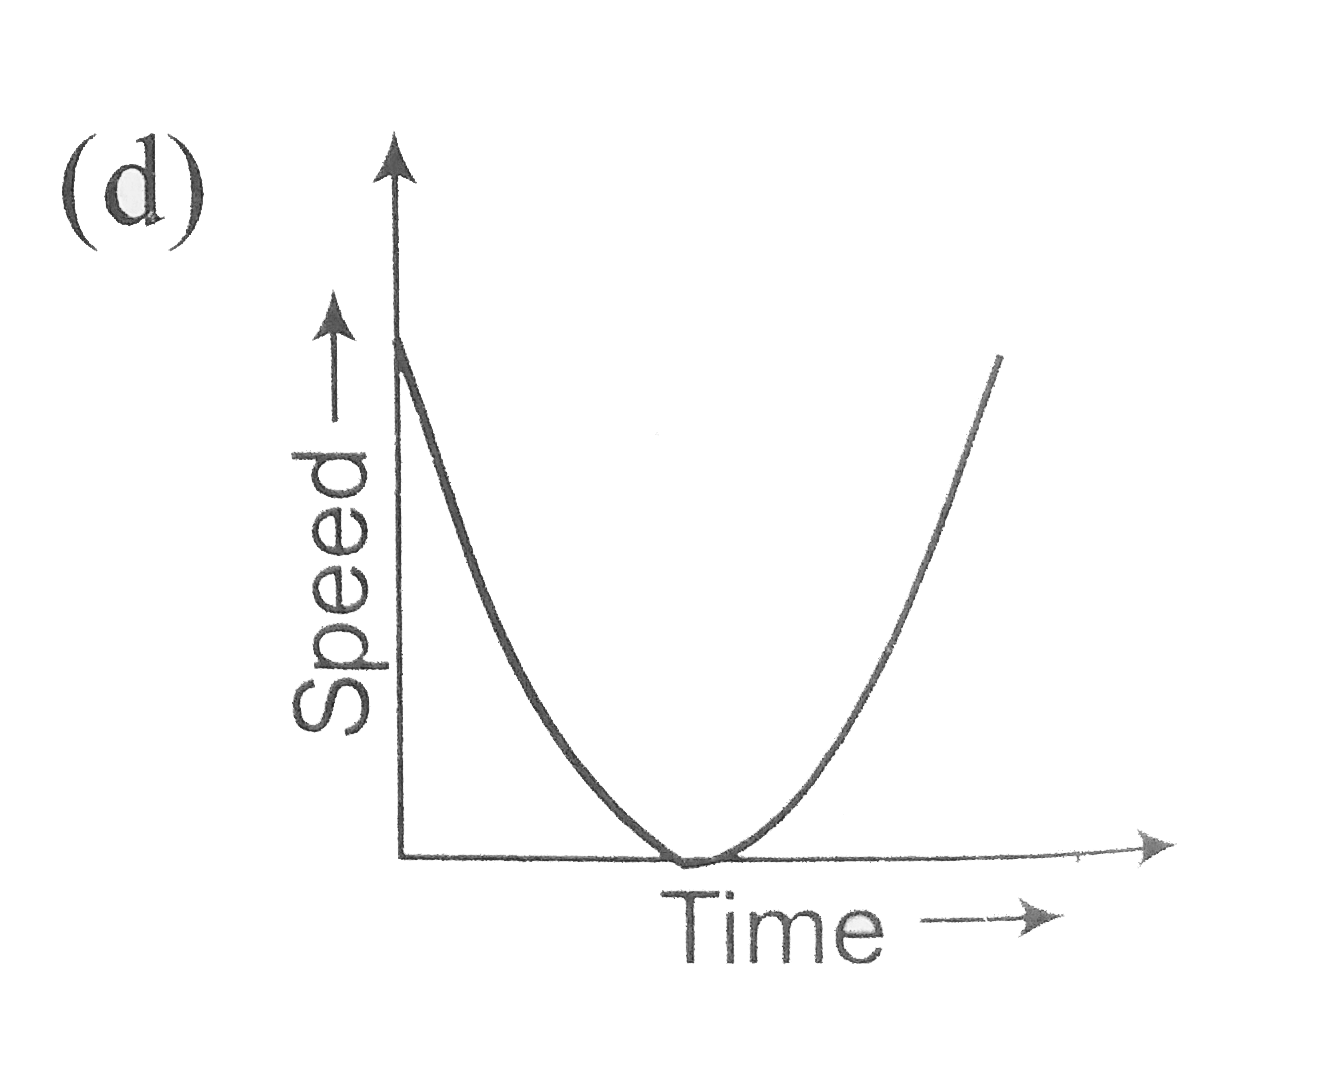 .
.A body is thrown vertically upwards. Which one of the following graphs correctly represent the velocity vs time?
A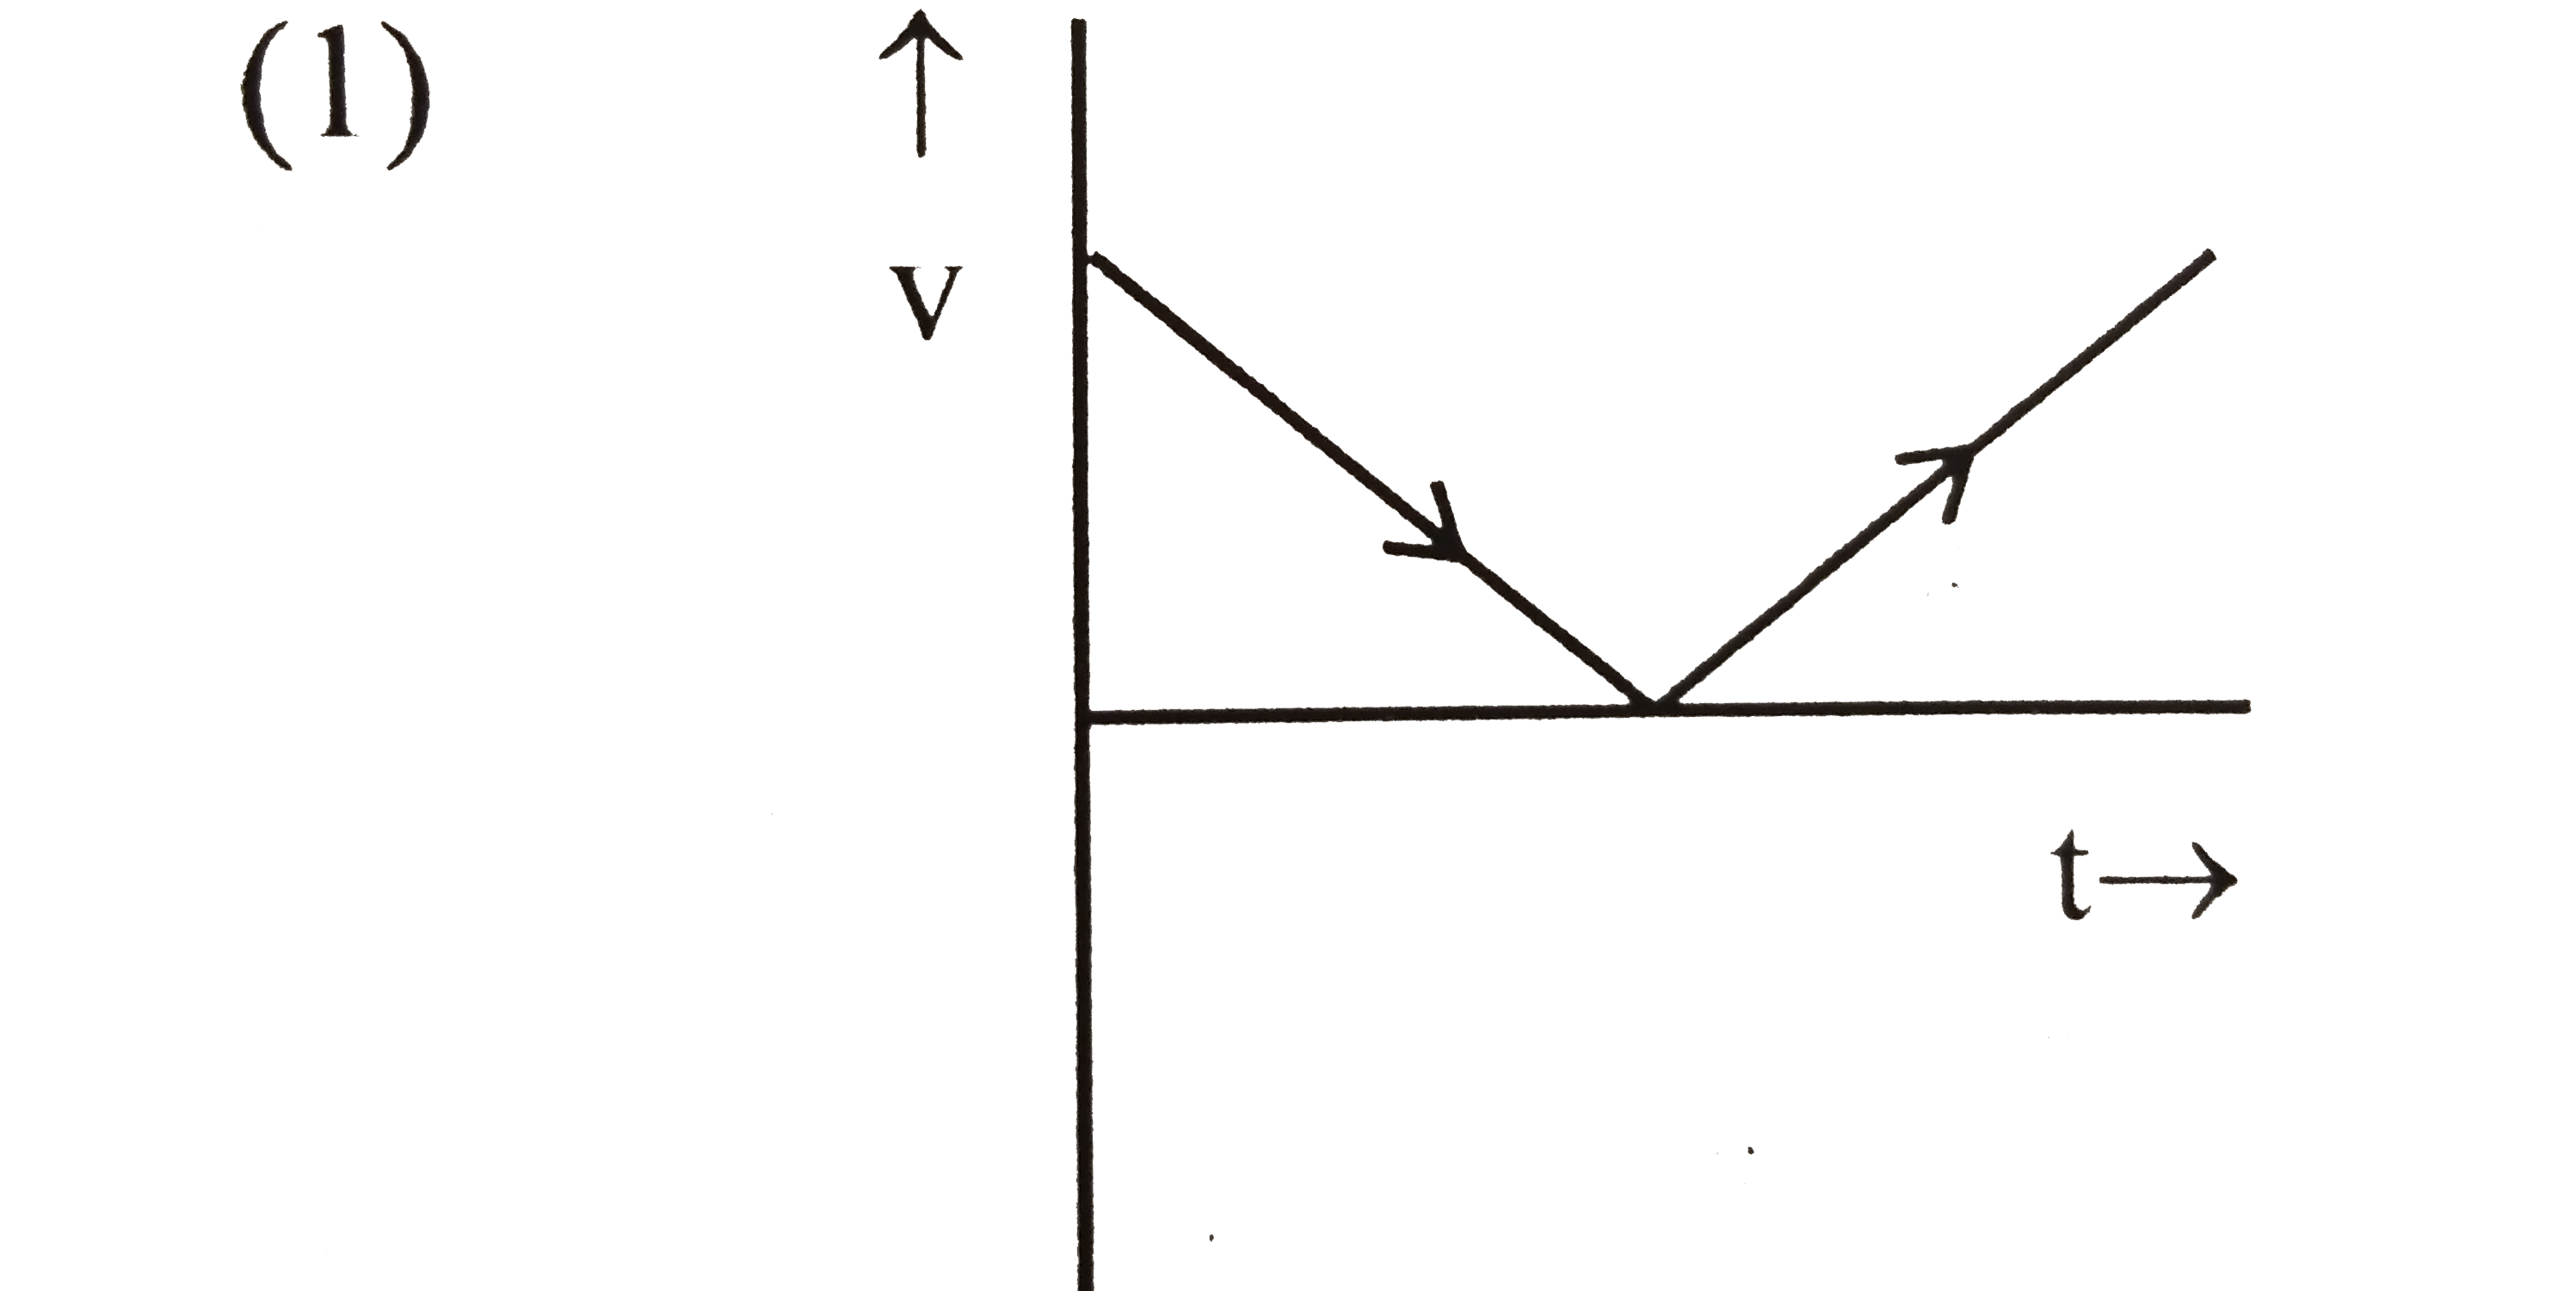 B
B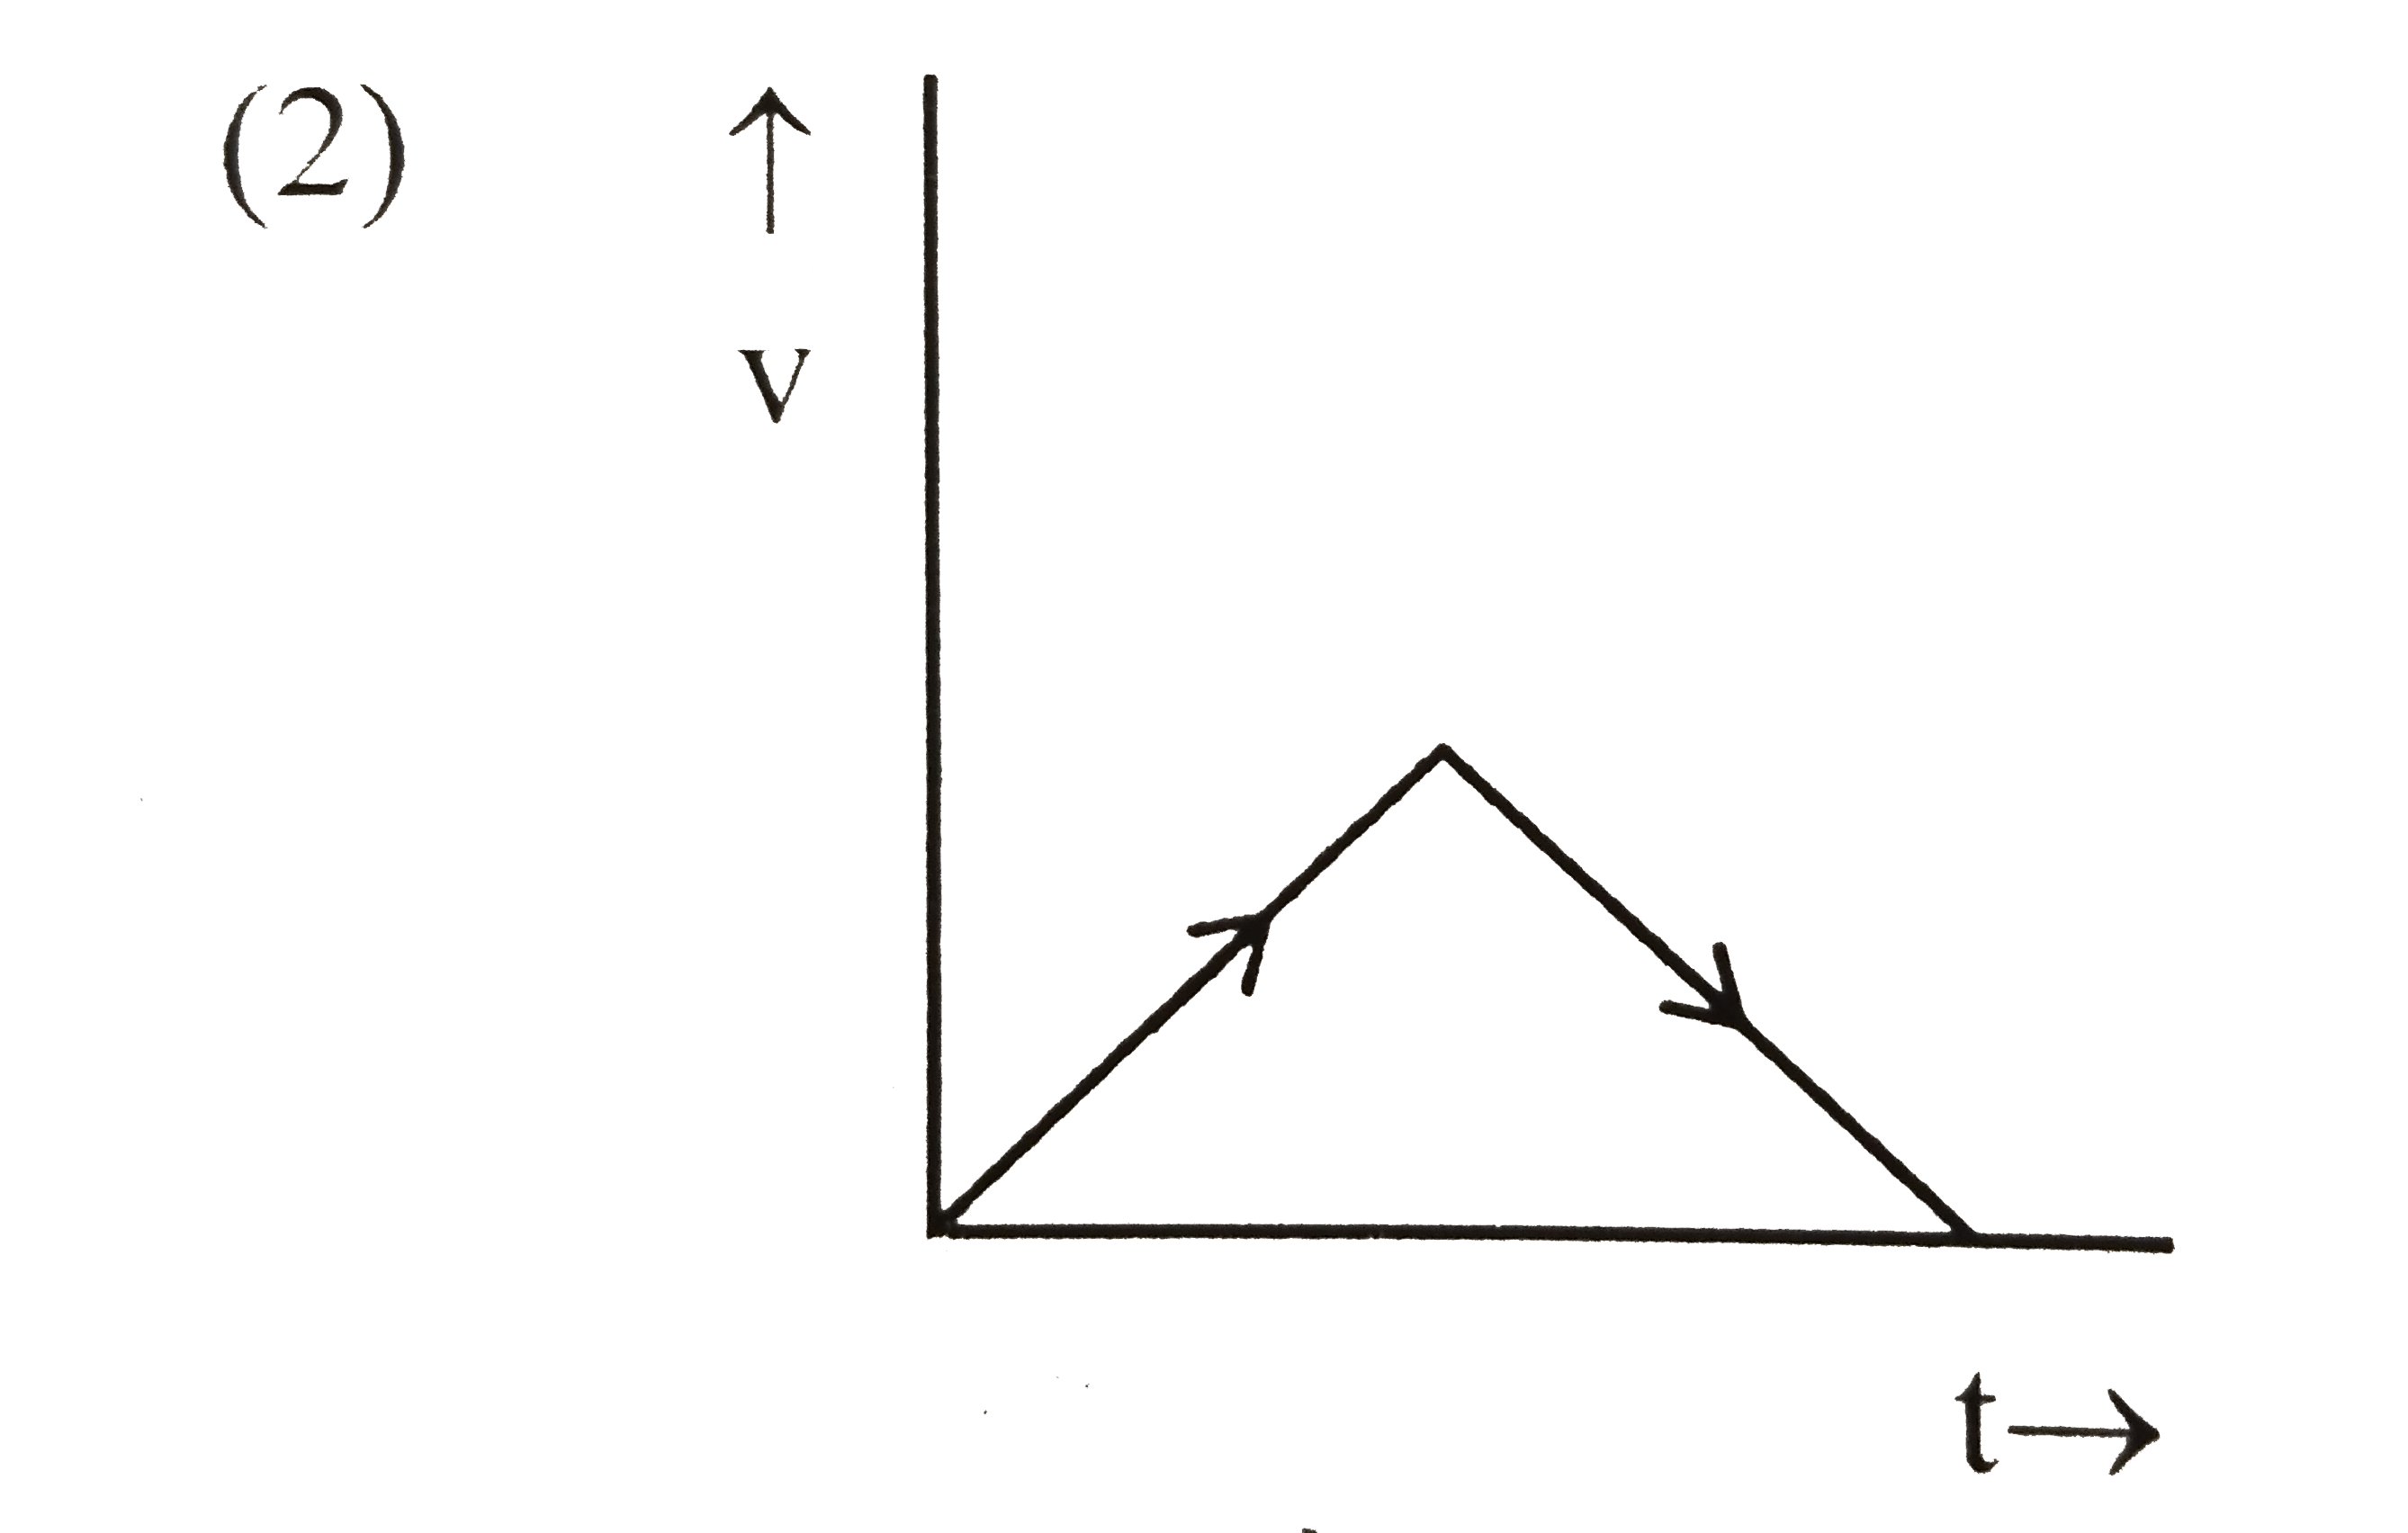 C
C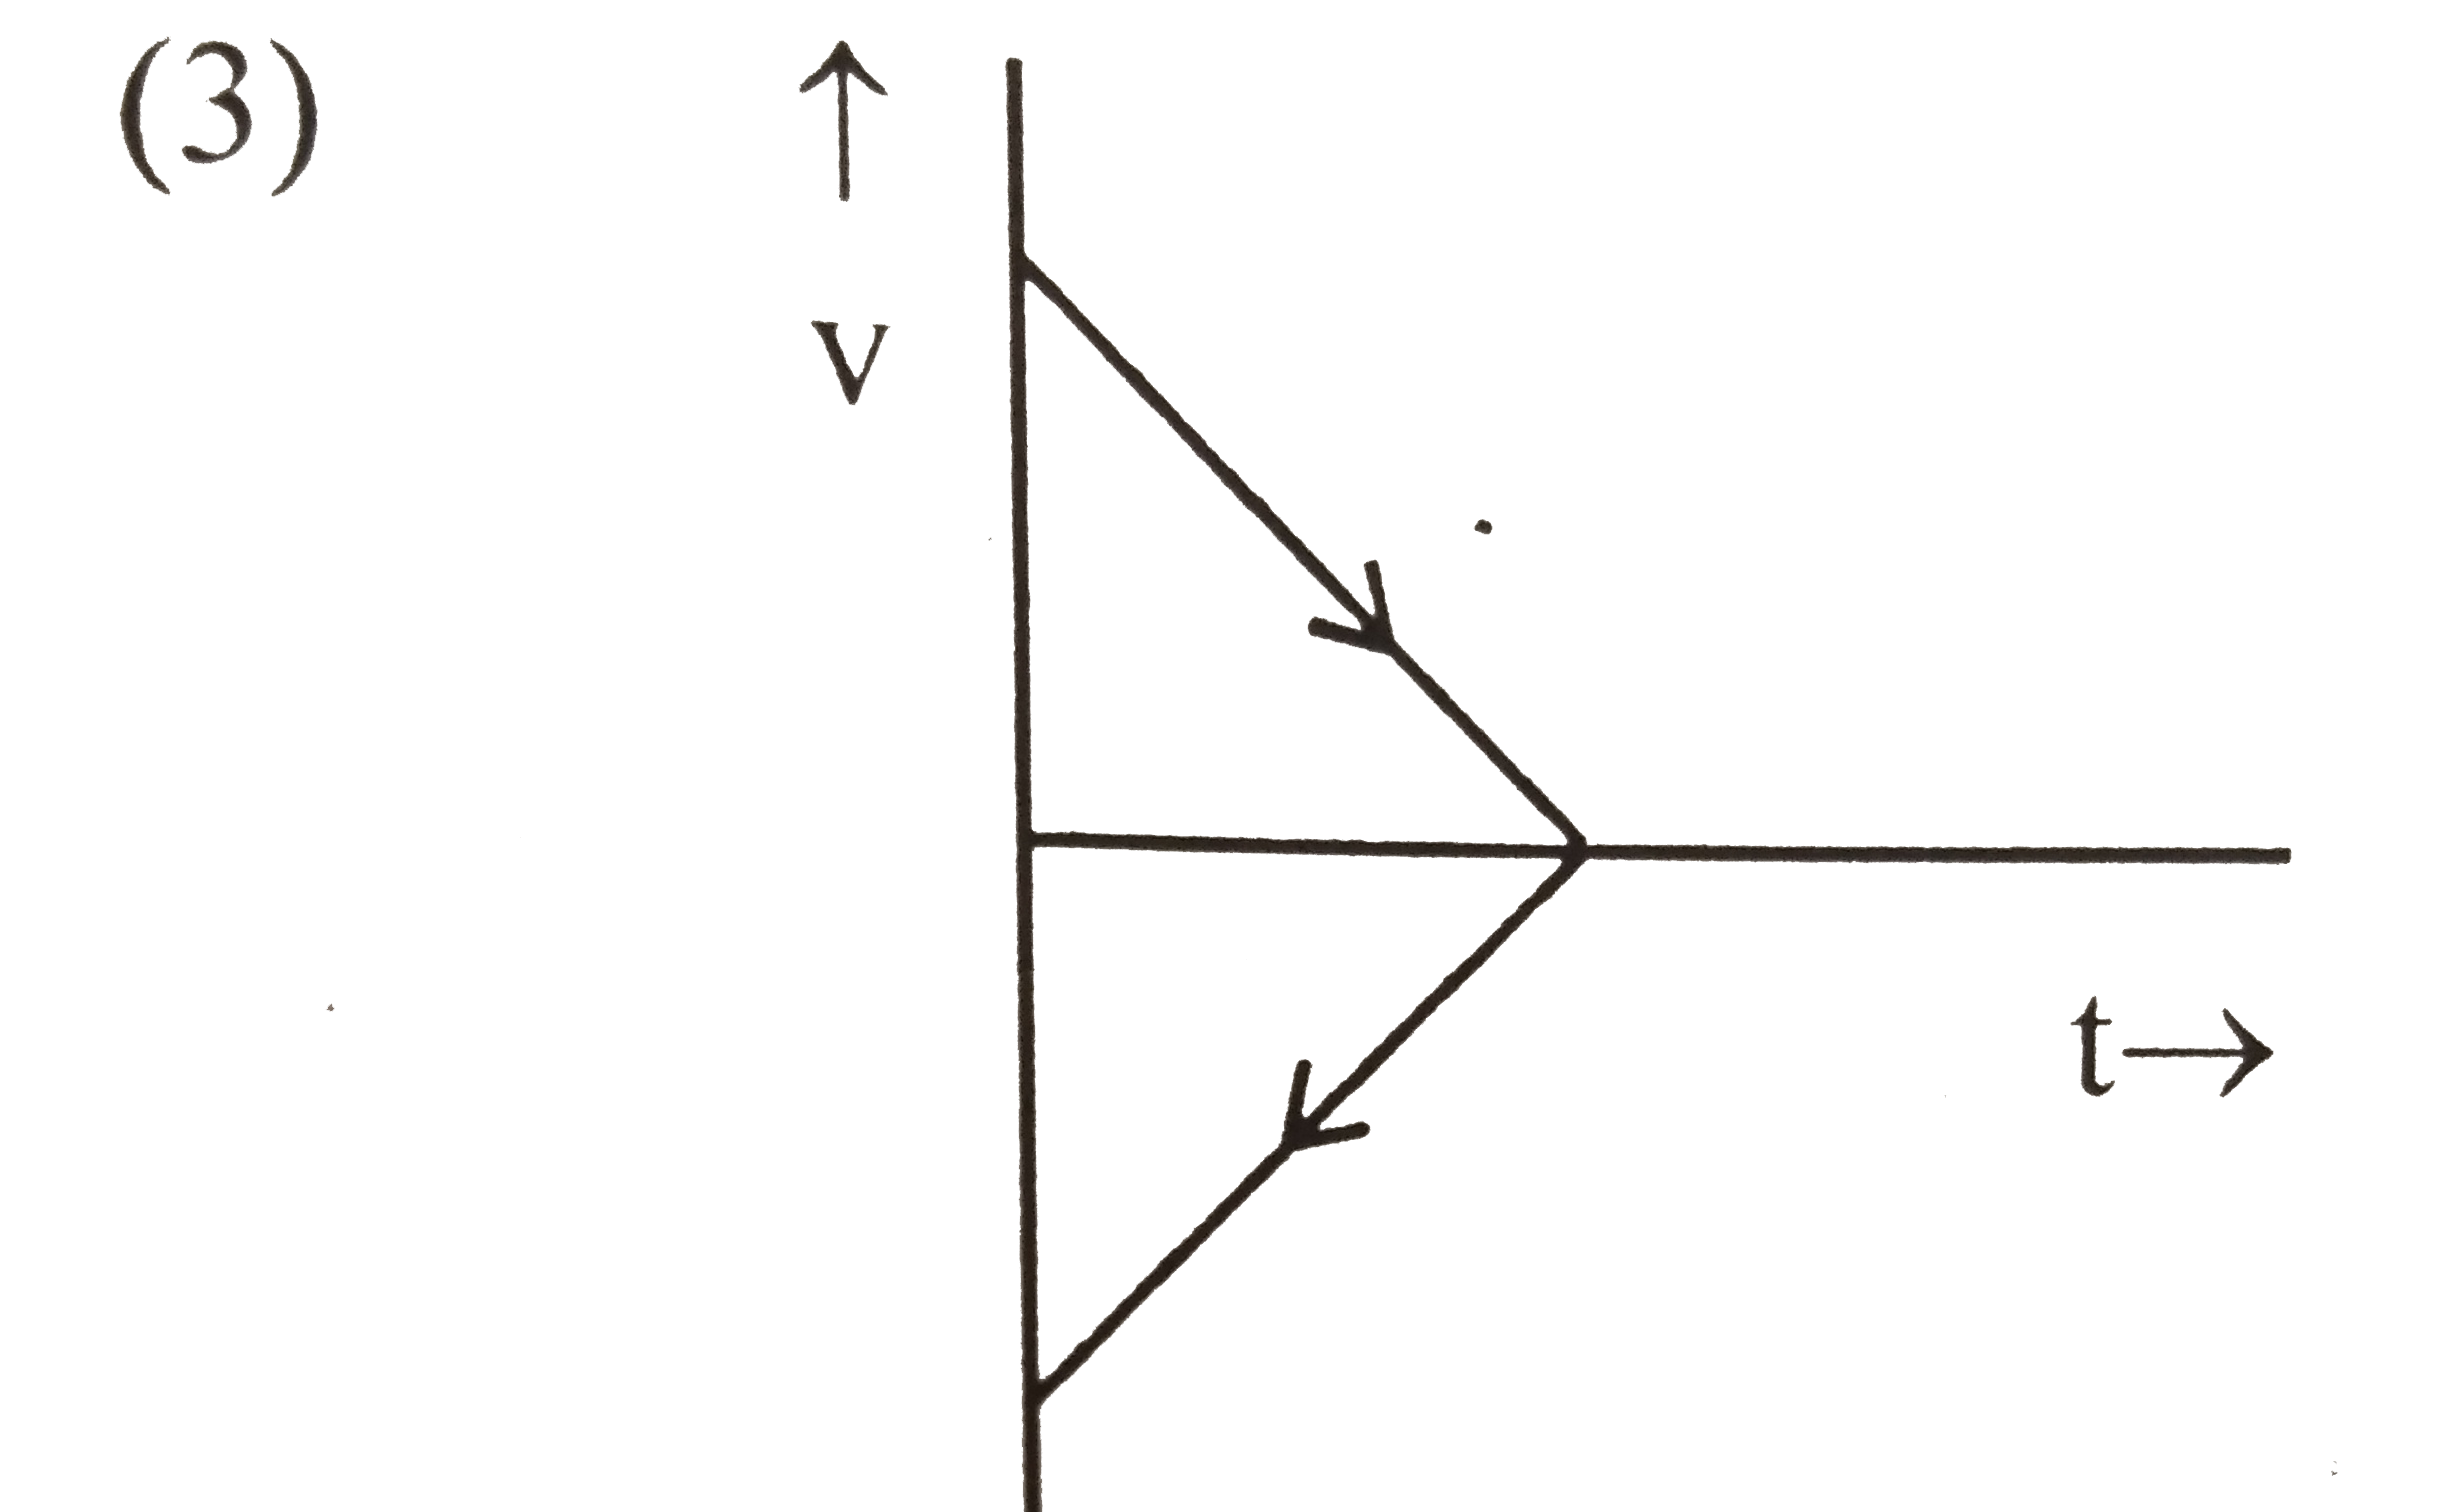 D
D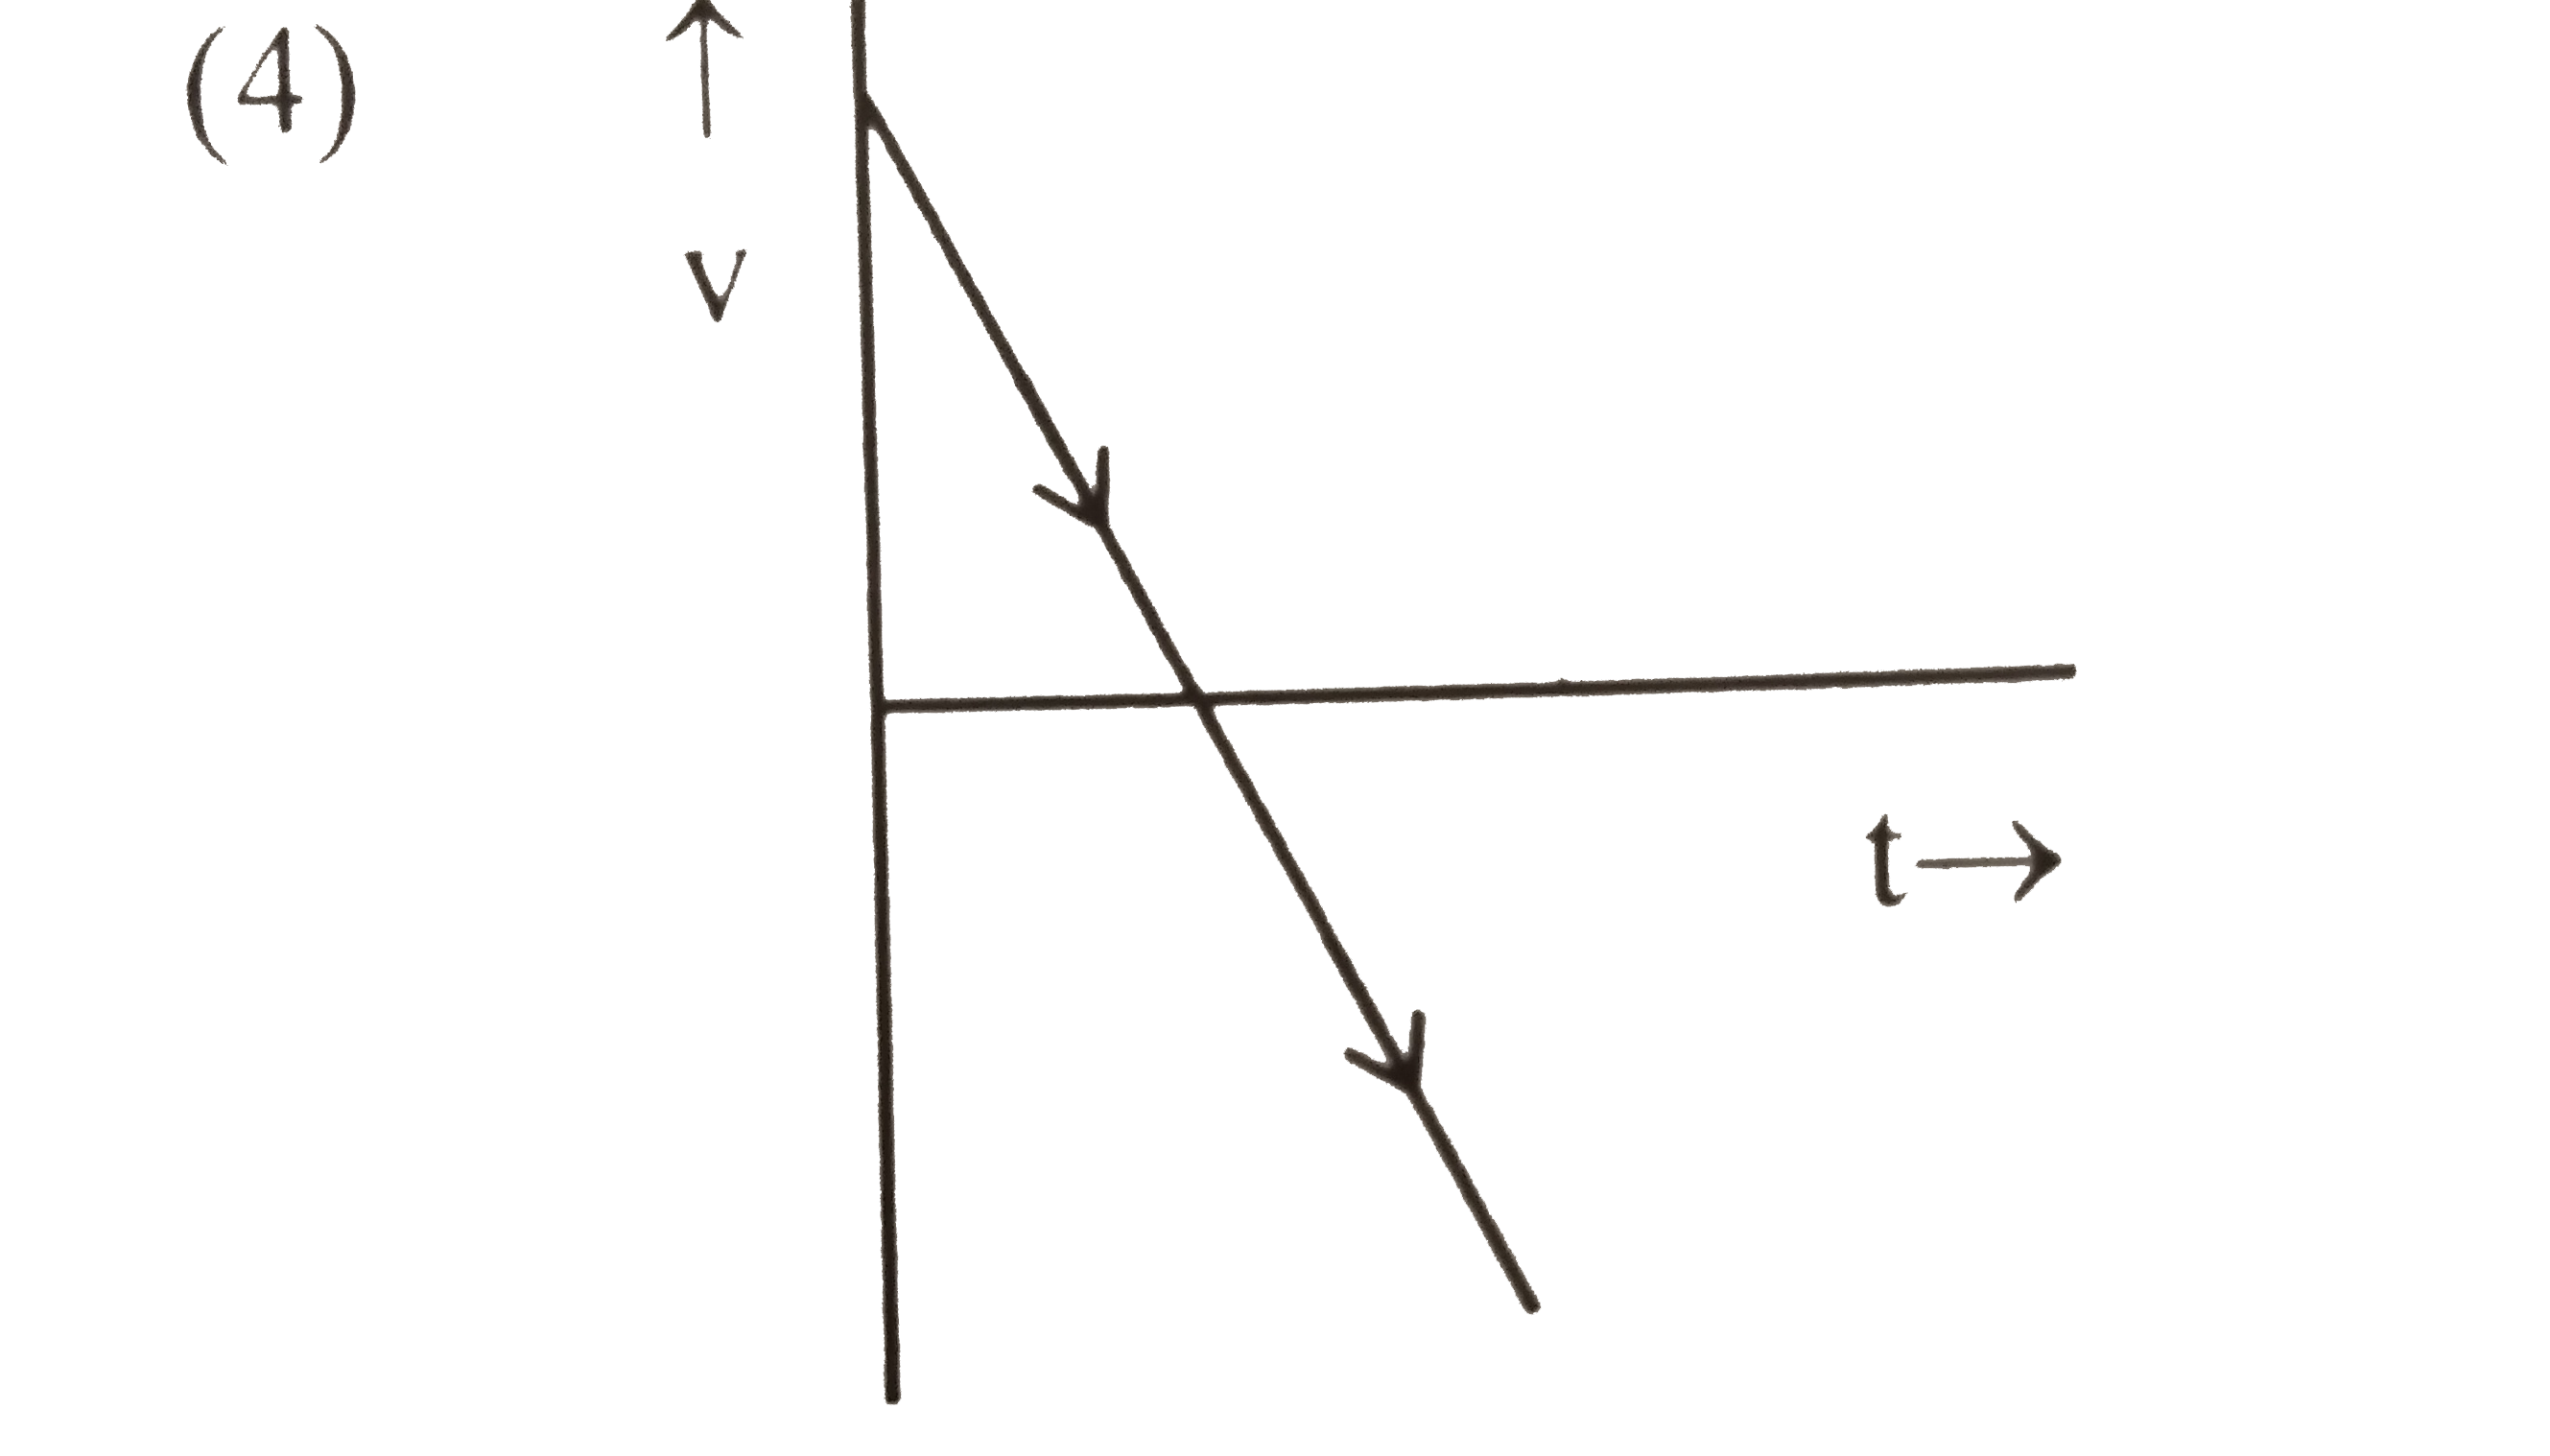
Which of the following graphs represents ohmic resistance?
View SolutionWhich of the following graphs represents the velocity-time relationship for a falling apple?
View SolutionA ball is projected vertically up with an initial velocity. Which of the following graphs represents the KE of the ball?
View SolutionWhich of the following graphs represents the position time-graph of a particle moving with negative velocity?
View SolutionA body is thrown vertically upwards which graph represents variation of velocity w.r.t time
View Solution

