A ball is thrown vertically upward. Draw its (i) velocity -time graph (ii) acceleration -time graph. Solution in Bengali
For the upward motion, the velocity decreases uniformly with retardation g , where g is the acceleration due to gravity. The line AB in Fig represents this motion.

Then for the downward motion the velocity increases g. The line BC in the same figure represents this motion.
(ii) The entire motion is under the acceleration due to gravity (g) which is a constant . So the acceleration-time graph is a horizontal straight line Fig.
Topper's Solved these Questions
- ONE - DIMENSIONAL MOTION BOOK - CHHAYA PUBLICATIONCHAPTER - ONE - DIMENSIONAL MOTION EXERCISE - EXAMINATION ARCHIVE with solutions ( NEET)
1 Videos
- NEWTONIAN GRAVITATION AND PLANETARY MOTIONBOOK - CHHAYA PUBLICATIONCHAPTER - NEWTONIAN GRAVITATION AND PLANETARY MOTIONEXERCISE - CBSE SCANNER
19 Videos
- QUESTION PAPERS OF NEET -2017BOOK - CHHAYA PUBLICATIONCHAPTER - QUESTION PAPERS OF NEET -2017EXERCISE - QUESTION
32 Videos
Similar Questions
If the velocity of a particle is v = At+Bt2, where A and B are constant then the distance travelled by it between 1 s and 2 s is -
(A) (3A+7B)
(B) 32A+73B
(C) A2+B3
(D) 32A+4B
View SolutionWhat is the reason for absence of atmosphere in some planets?
View SolutionA molecule of a substance has permanent dipole moment p . A mole of this substance is polarised by applying a storg electrostatic field E . The direction of the field is suddenly changed of 60∘ . If N is the avogadro's number the amount of work done by the field is
View Solutiona. A ball is thrown vertically upwards. Aftre some time it trturns to the throuer. Draw the velocity-time graph and speed-time graph.
b. A ball is dropped from some height. After rebounding from the floor, it ascends to the same height. Draw the velocity-time graph and speed-time graph.
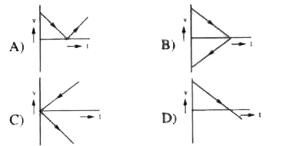
View SolutionA ball is thrown vertically upwards. Which of the following graph/graphs represent velocity time graph of the ball during its flight ( air resistance is neglected).
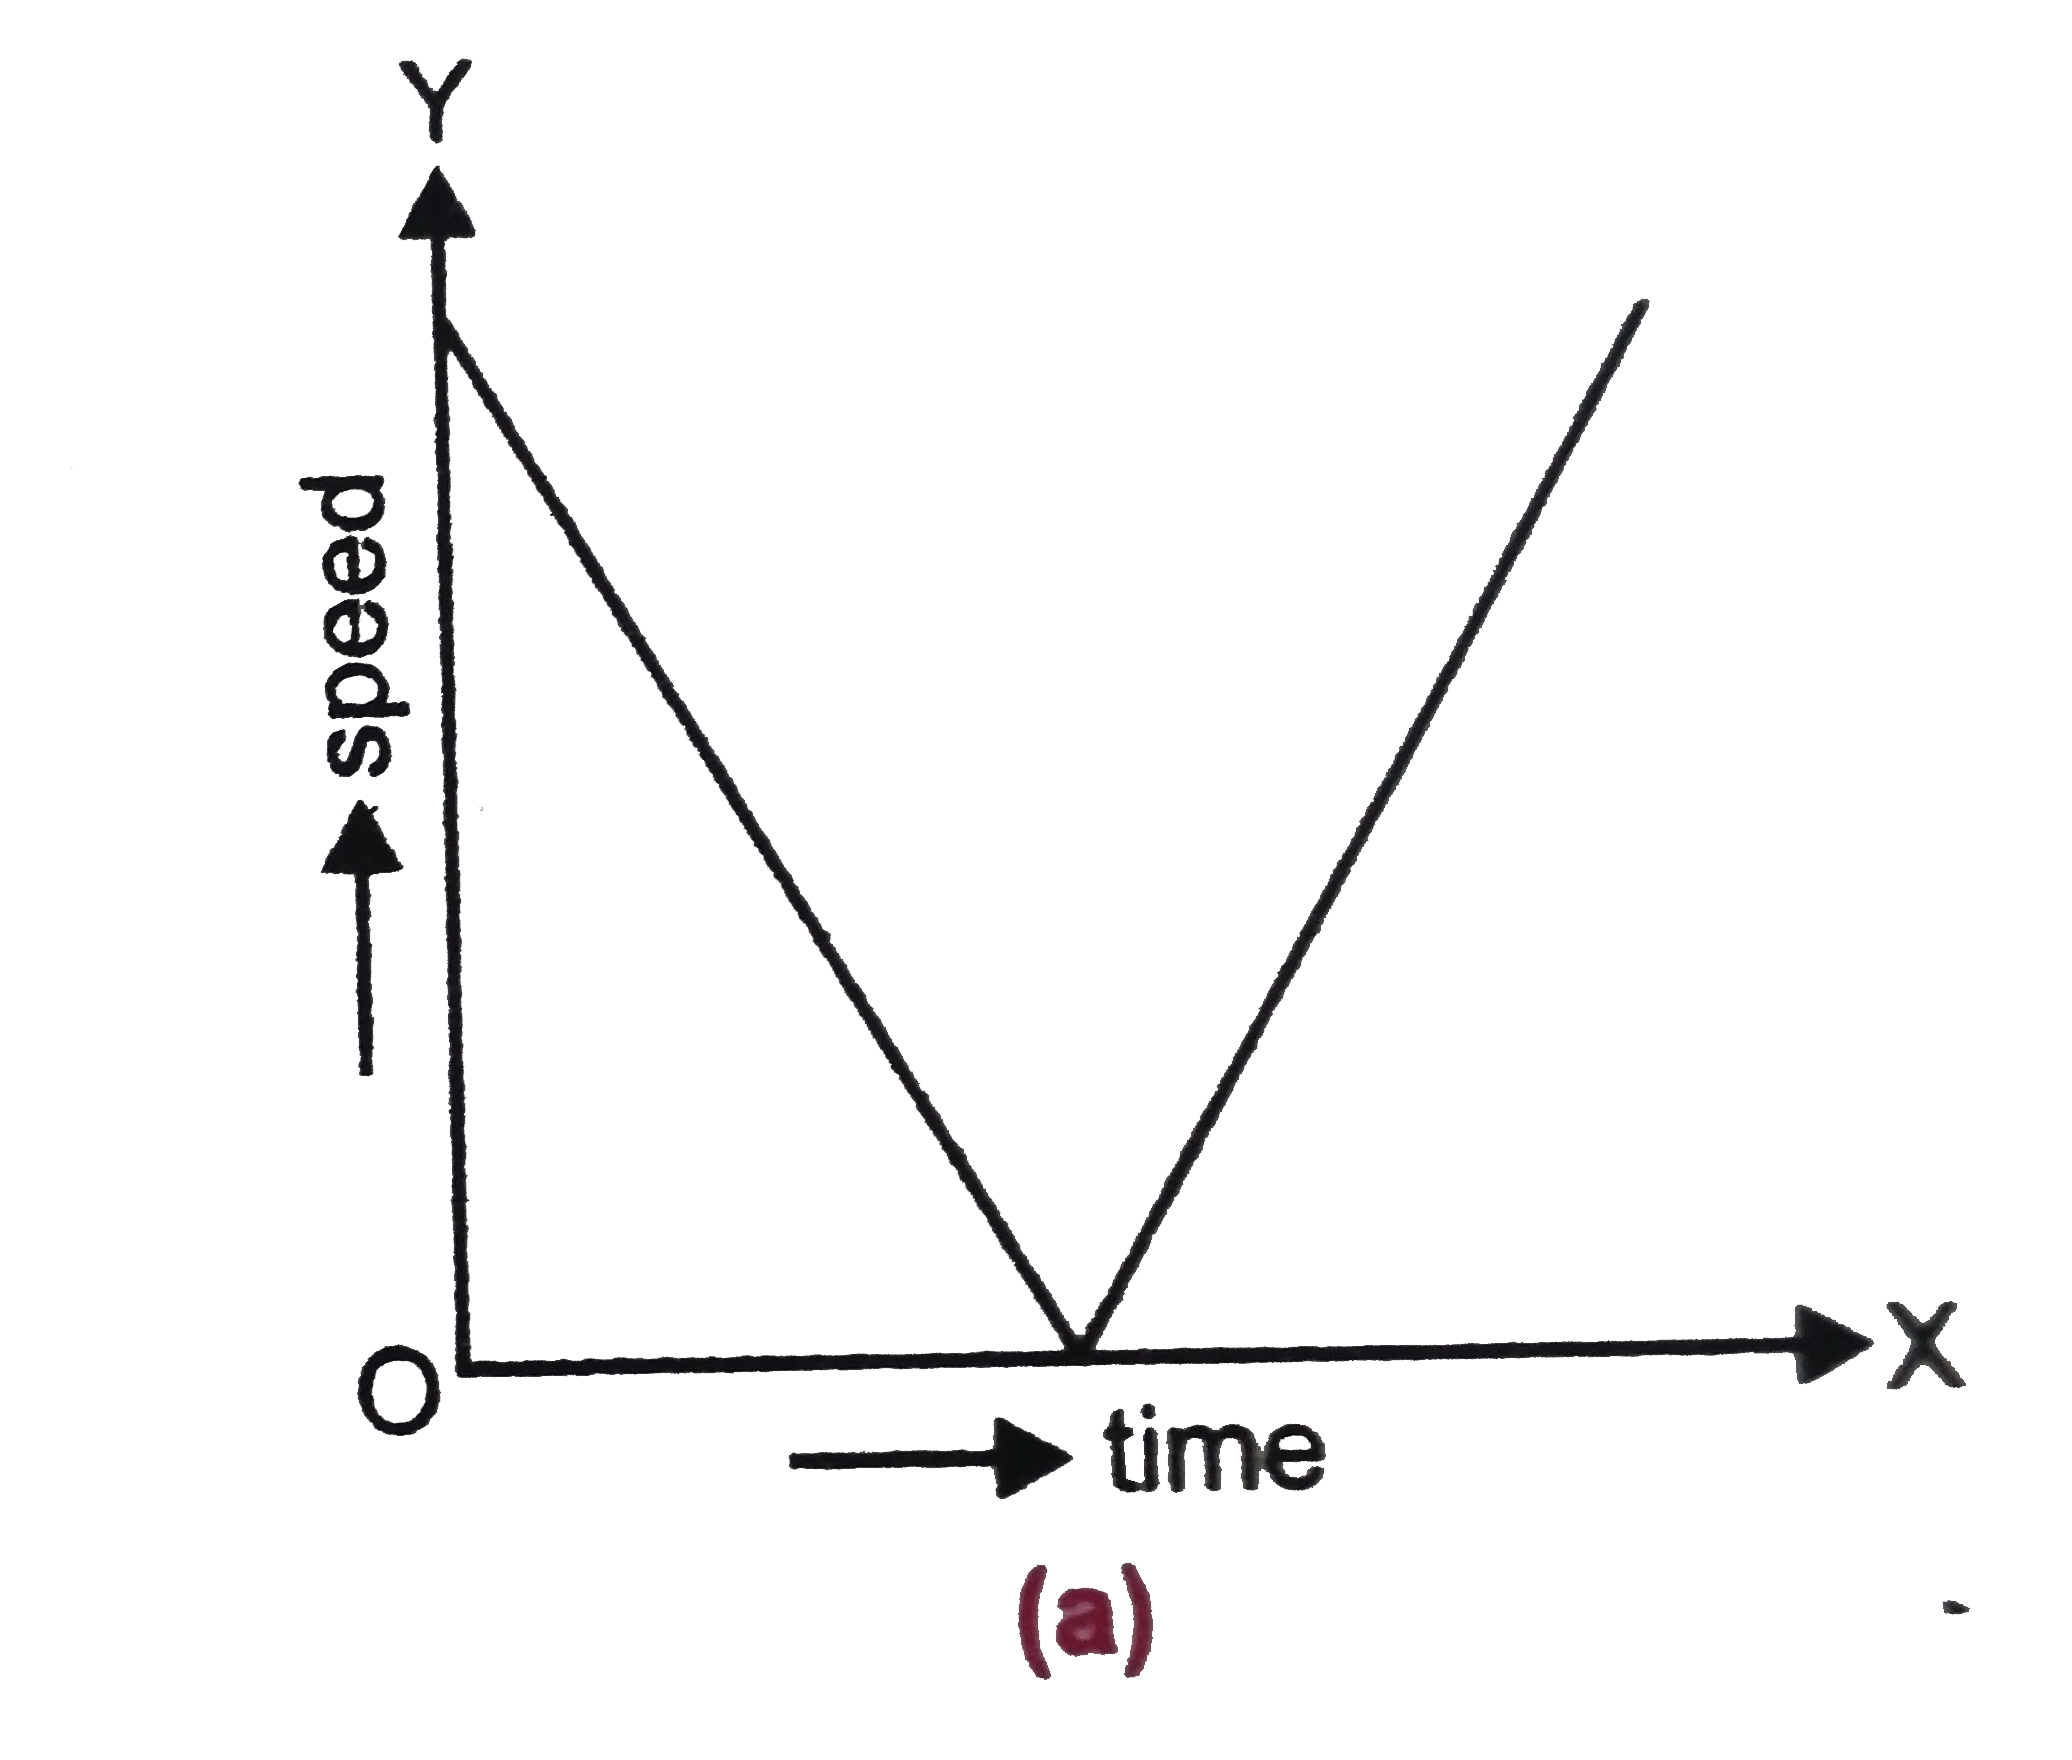
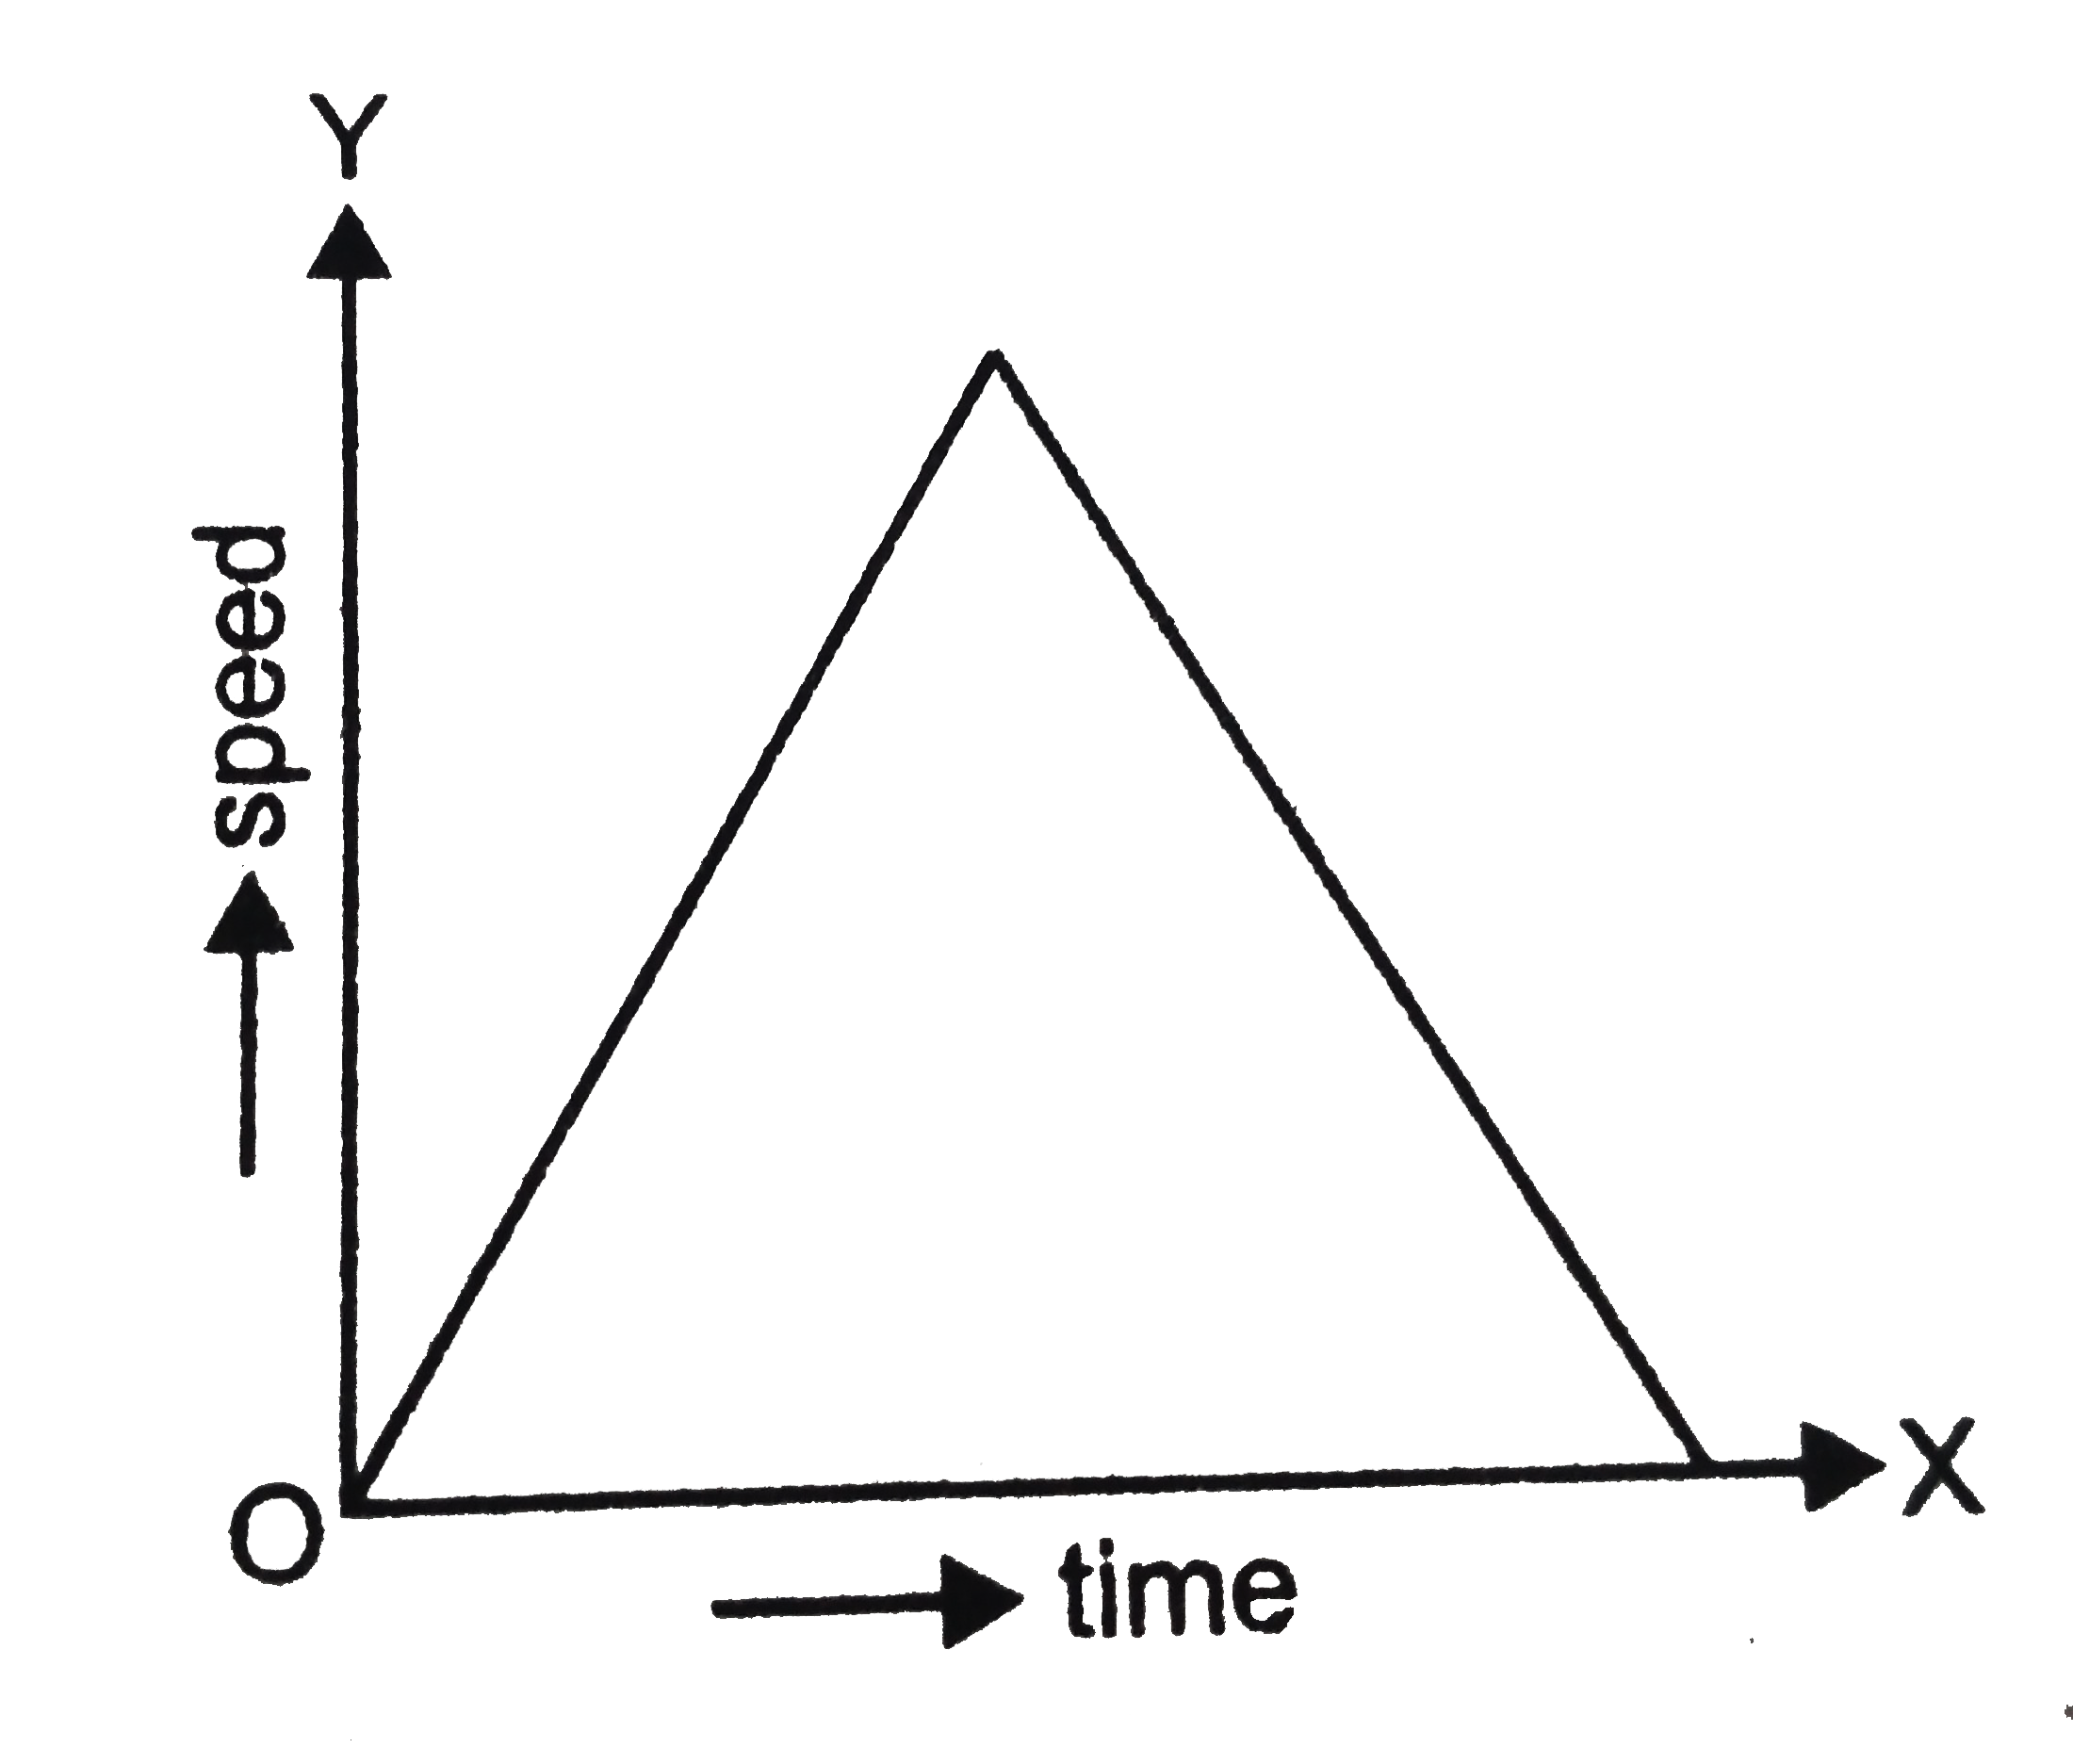
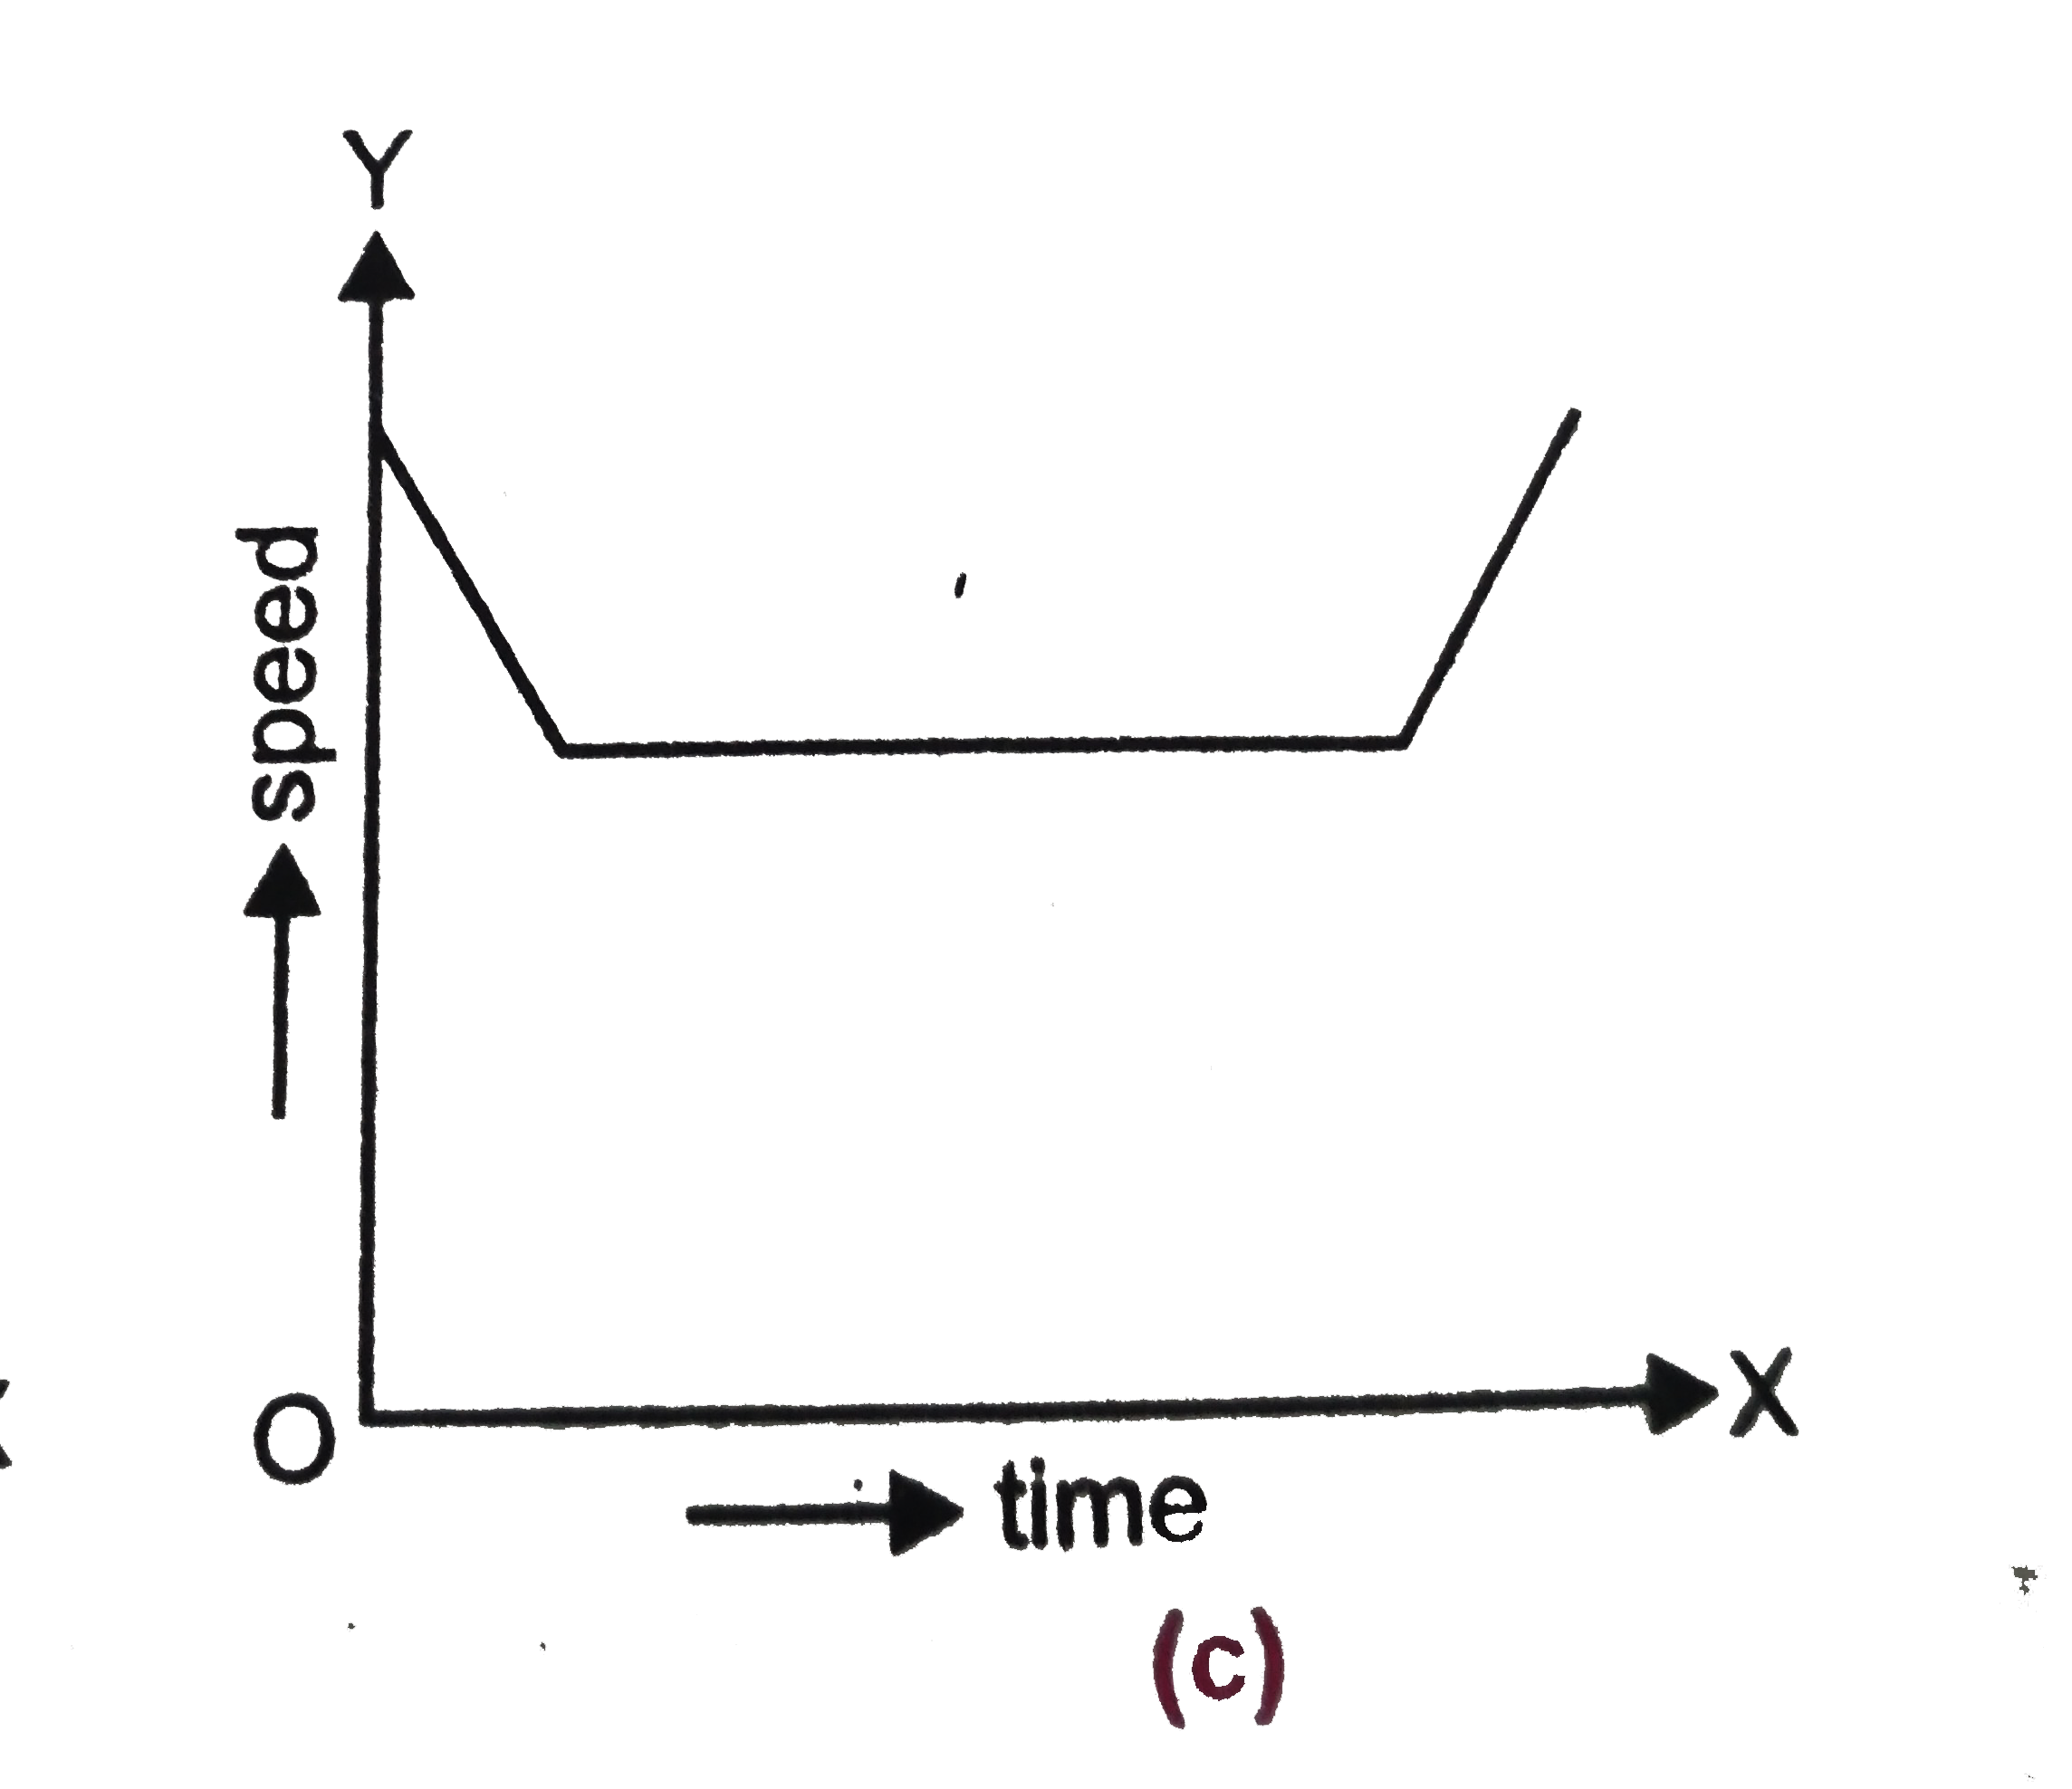
View SolutionThree speed-time graphs are shown below.


(i) A ball thrown vertically upwards and returning to the hand of the thrower ?
(ii) A body decelerating to a constant speed and accelerating.
View SolutionFor an object projected upward with a velocity v_(0) , which comes back to the same point after some time, draw (i) Acceleration-time graph (ii) Position-time graph (iii) Velocity time graph
View SolutionA ball is thrown vertically upward. For the motion of the ball till it returns to ground, draw the (i)height vs time graph (ii) velocity vs time graph (iii) acceleration vs time graph (iv) velocity vs height graph
View SolutionFor an object projected upward with a velocity v0 which comes back to the same point after some time, draw
(i) Acceleration-time graph
(ii) Position-time graph
(iii) Velocity-time graph
View SolutionA ball is thrown vertically upwards. Which of the following graph/graphs represent velocity-time graph of the ball during its flight (air resistance is neglected)

View SolutionA ball is thrown vertically upwards .Which of the following graph/graphs represent velocity-time graph of the ball during its flight (air resistance is neglected )
View SolutionA ball is thrown vertically upward with a speed of 20 m/s. Draw a graph showing the velocity of the ball as a function of time as it goes up and then comes back.
View SolutionA ball is thrown vertically upwards. Which of the following graph/graphs represent velocity-time graph of the ball during its flight (air resistance is neglected)

View SolutionA ball is thrown vertically upwards. Which of the following graph/graphs represent velocity-time graph of the ball during its flight (air resistance is neglected)

View SolutionA ball thrown vertically upward with initial velocity u. Which of the following graphs represent the velocity of ball correctly as function of time?
(Take upward direction as positive)
View Solution
