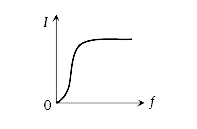
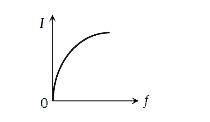
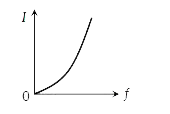
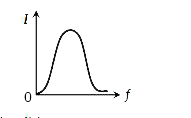
An AC source of variable frequency f is connected to an LCR series circuit. Which one of the graphs in figure represents the variation of current of current I in the circuit with frequency f?
A
B
C
D
Video Solution
Text Solution
The correct Answer is:D
At f=fr (Resonant frequency)
Current is maximum
f→0,I→0,f→∞,I→0
|
Updated on:21/07/2023
Similar Questions
Which of the following graphs represent the variation of current(I) with frequency (f) in an AC circuit containing a pure capacitor?
View SolutionA variable frequency alternating voltage of constant magnitude is applied across a capacitor. Which of the following graph shows the variation of current set up in the circuit with frequency v?
View Solution
Knowledge Check
- Question 1 - Select One
An AC source of variable frequency f is connected to an LCR series circuit. Which one of the graphs in figure represents the variation of current of current I in the circuit with frequency f?
A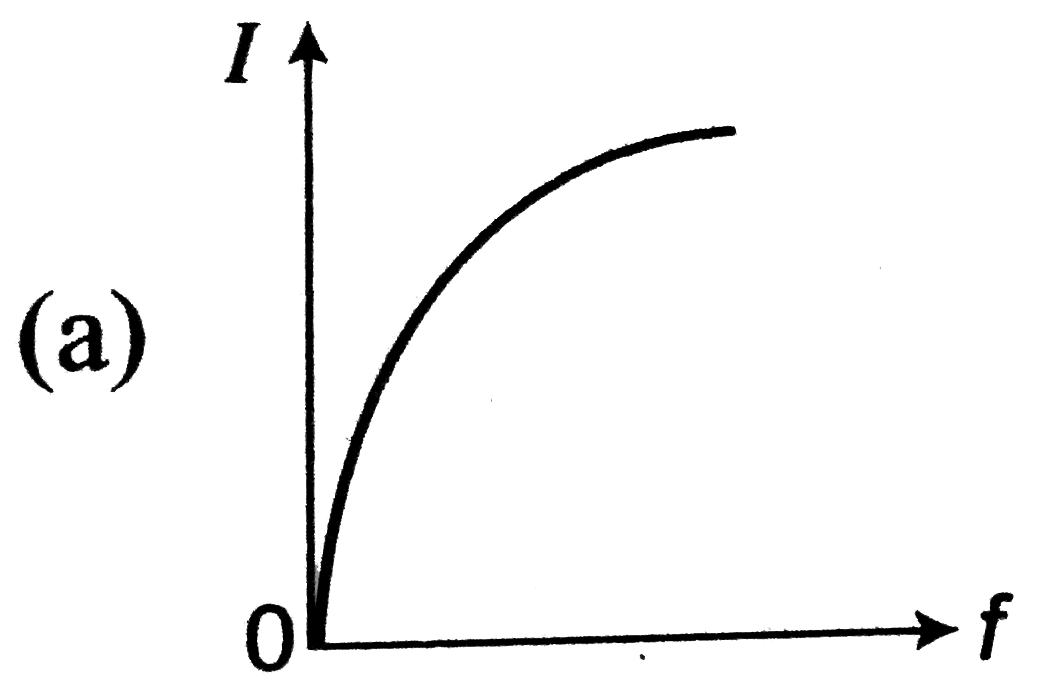 B
B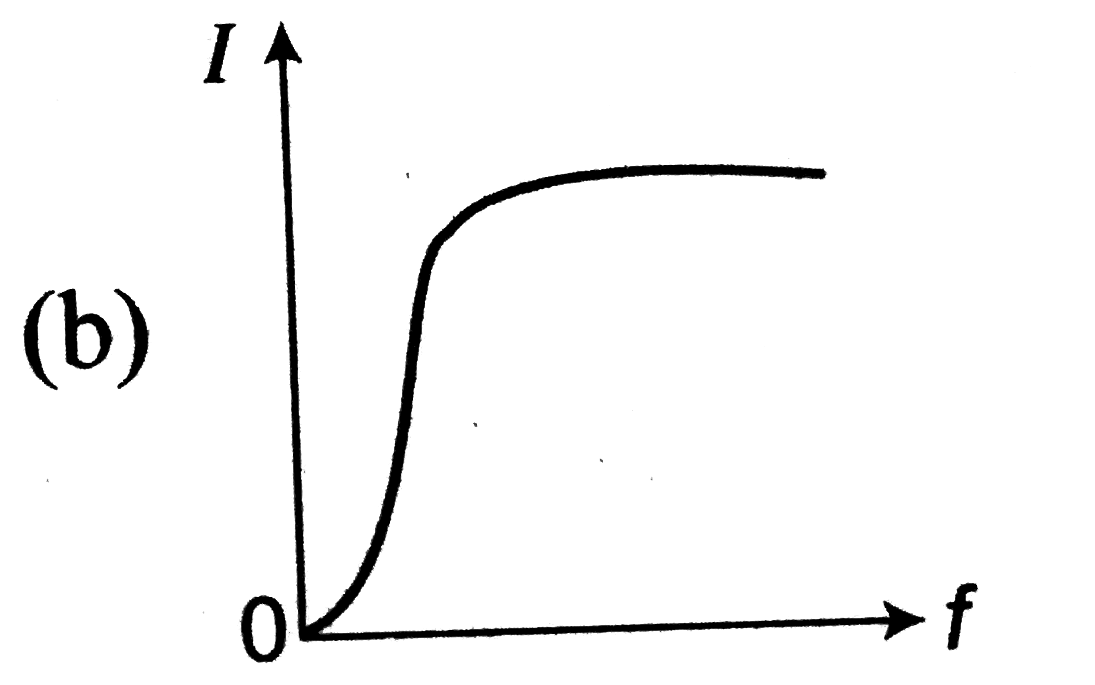 C
C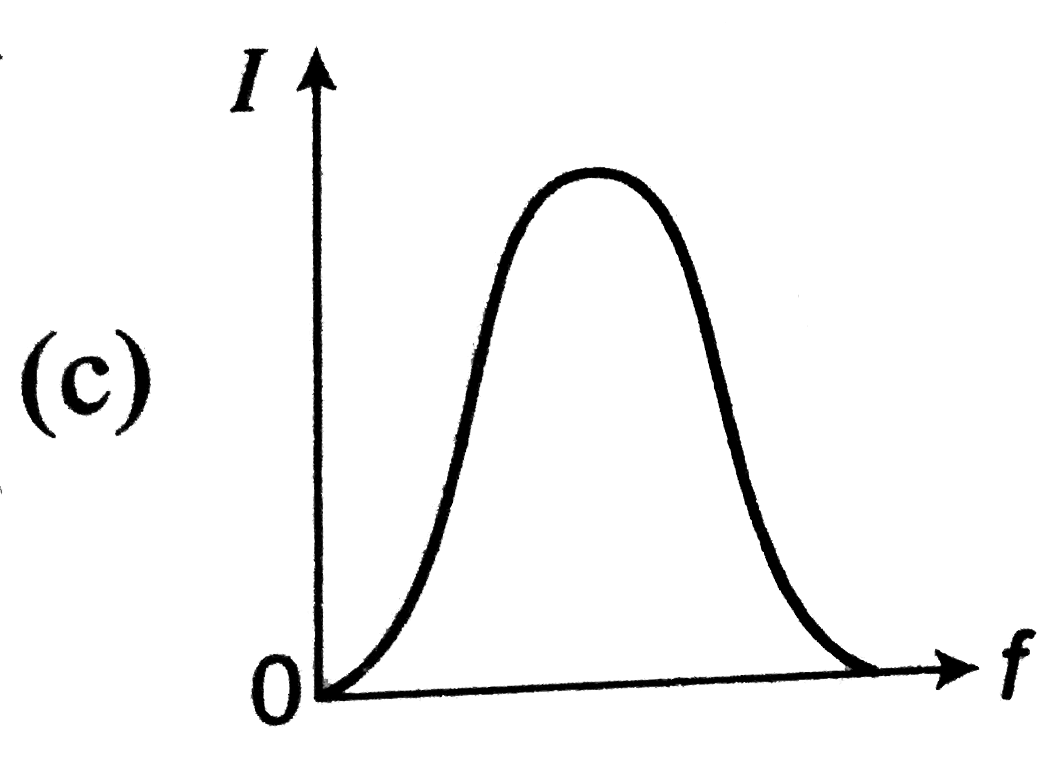 D
D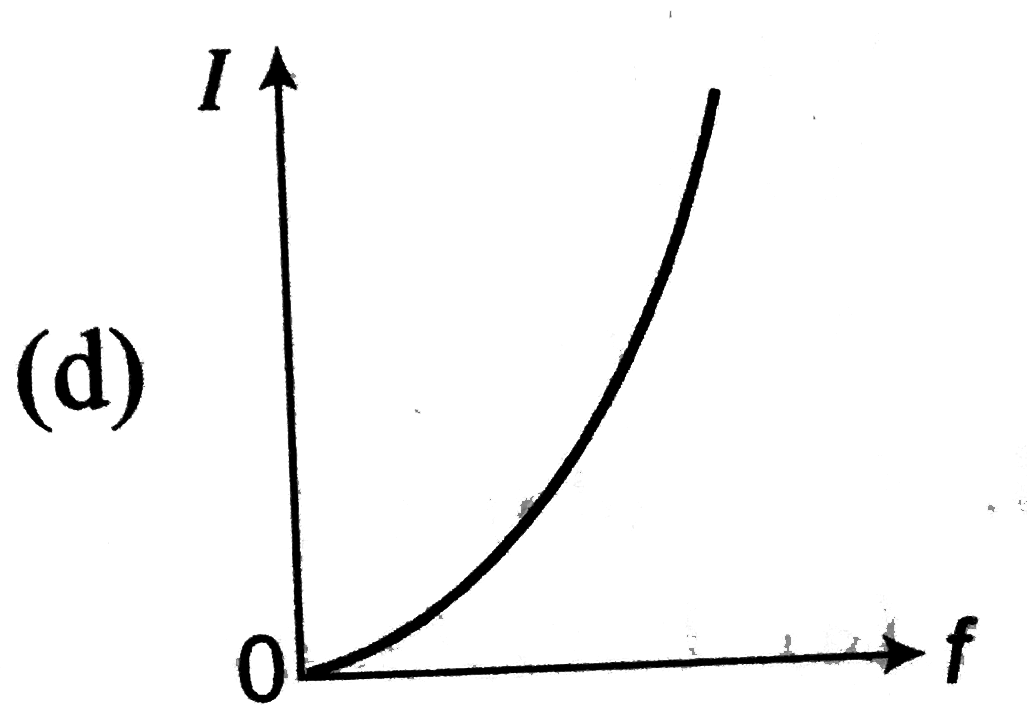
- Question 2 - Select One
An a.c. source of variable angular frequency o is connected to an LCR series circuit. Which one of the following graphs correctly represents variation of impedance Zof a.c. circuit with angular frequency ω?
A B
B C
C D
D
- Question 3 - Select One
In an LCR series circuit the current is
Ain phase with applied emfBlags the applied voltageClead the applied voltageDmay lead or lag behind the applied voltage
In LCR series AC circuit, the current
View SolutionIn an LCR series ac circuit, the current is
View SolutionWhen the frequency of AC is doubled, the impedance of an LCR series circuit
View SolutionWhich of the following graphs represent the variation of current(I) with frequency (f) in an AC circuit containing a pure capacitor?
View SolutionWhich of the following curves represents the variation of impedance (Z) with frequency f in series LCR circuit?
View Solution
