Which of the following graphs represent the variation of current(I) with frequency (f) in an AC circuit containing a pure capacitor?
A
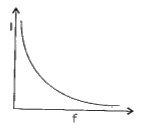
B

C
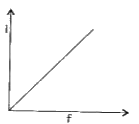
D
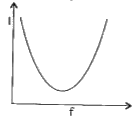
Video Solution
Text Solution
The correct Answer is:C
We know that capacitive reactance is ,
XC=1ωC=12πfVC=2πVfC
Also , I=12πFC
∴I∝f
|
Topper's Solved these Questions
- CBSE TERM-1 SAMPLE PAPER 1BOOK - EDUCART PUBLICATIONCHAPTER - CBSE TERM-1 SAMPLE PAPER 1EXERCISE - SECTION-B
24 Videos
- CBSE TERM-1 SAMPLE PAPER 1BOOK - EDUCART PUBLICATIONCHAPTER - CBSE TERM-1 SAMPLE PAPER 1EXERCISE - SECTION-C
6 Videos
- SAMPLE PAPER SELF-ASSESSMENT (11)BOOK - EDUCART PUBLICATIONCHAPTER - SAMPLE PAPER SELF-ASSESSMENT (11)EXERCISE - SECTION -C
1 Video
- SAMPLE PAPER - 8BOOK - EDUCART PUBLICATIONCHAPTER - SAMPLE PAPER - 8EXERCISE - Section C
6 Videos
Similar Questions
Knowledge Check
Which of the following graphs represent the variation of current(I) with frequency (f) in an AC circuit containing a pure capacitor?
A B
B C
C D
D
Which of the following curves represents the variation of impedance (Z) with frequency f in series LCR circuit?
A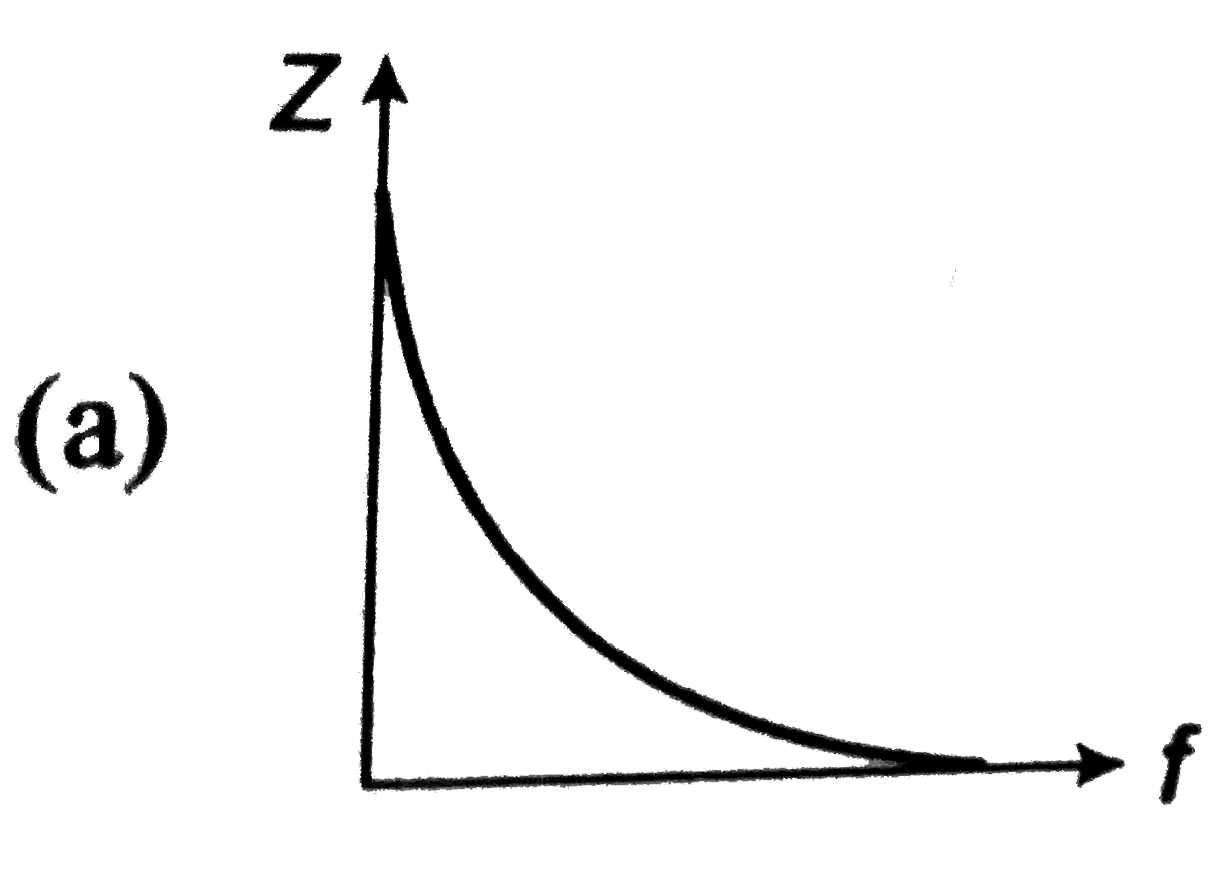 B
B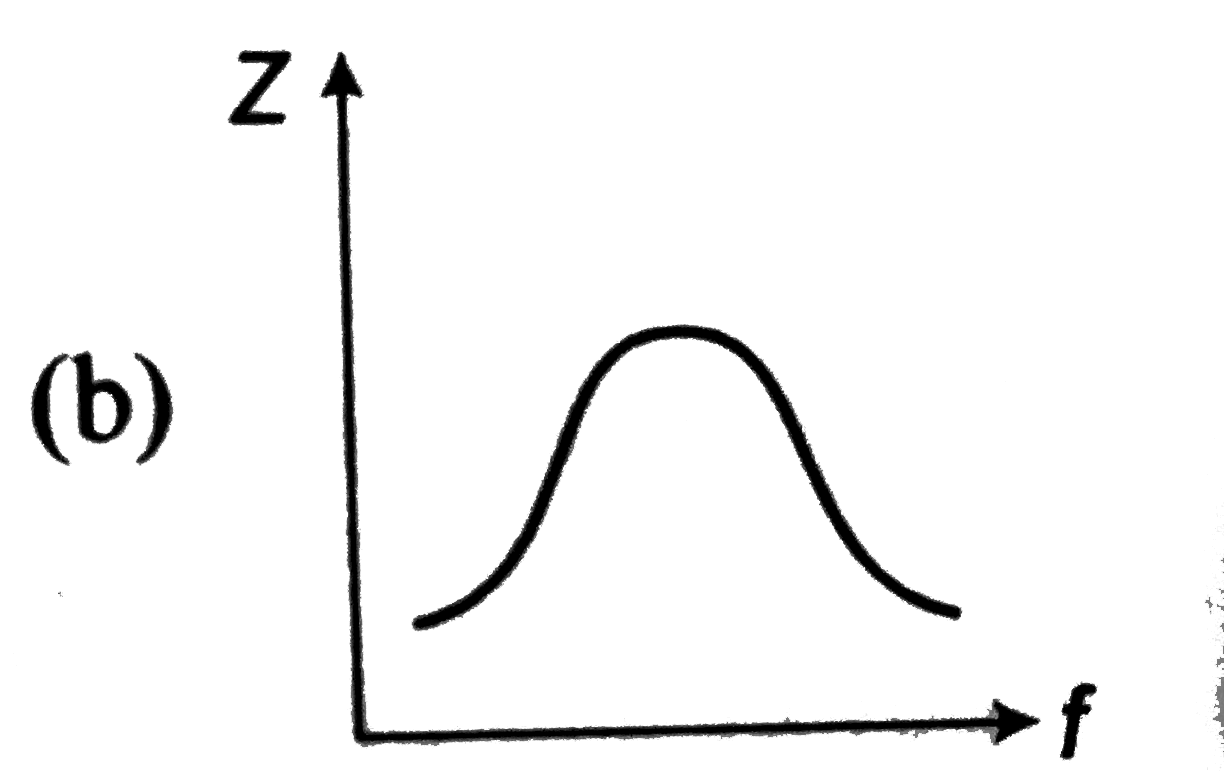 C
C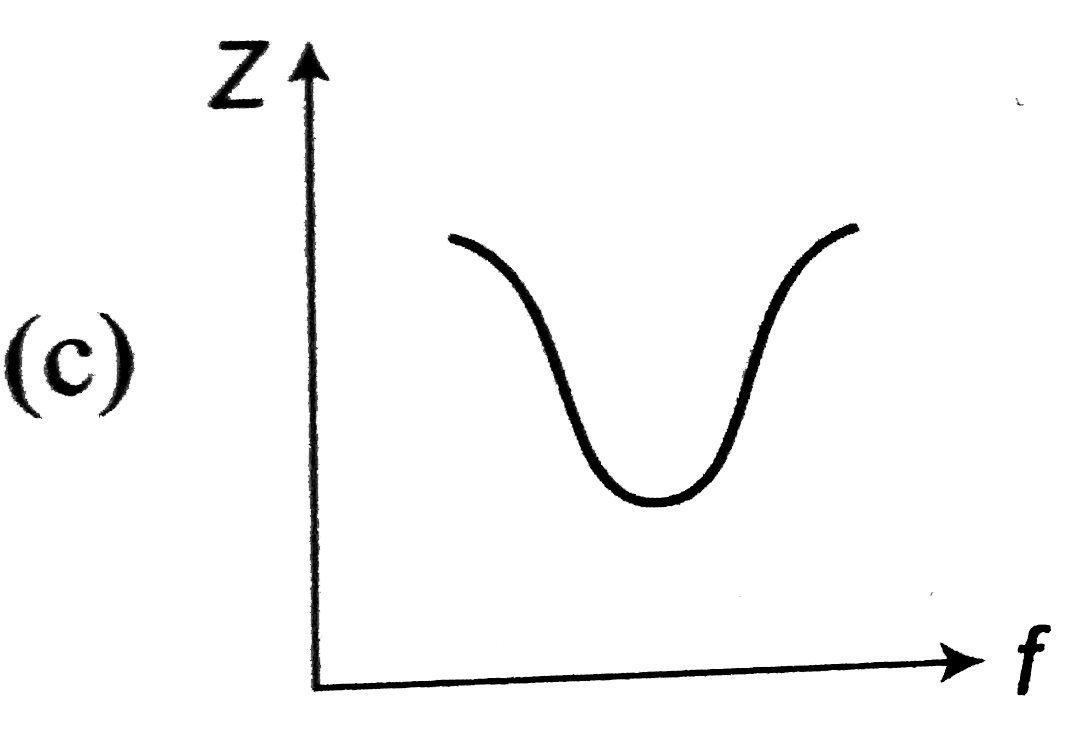 D
D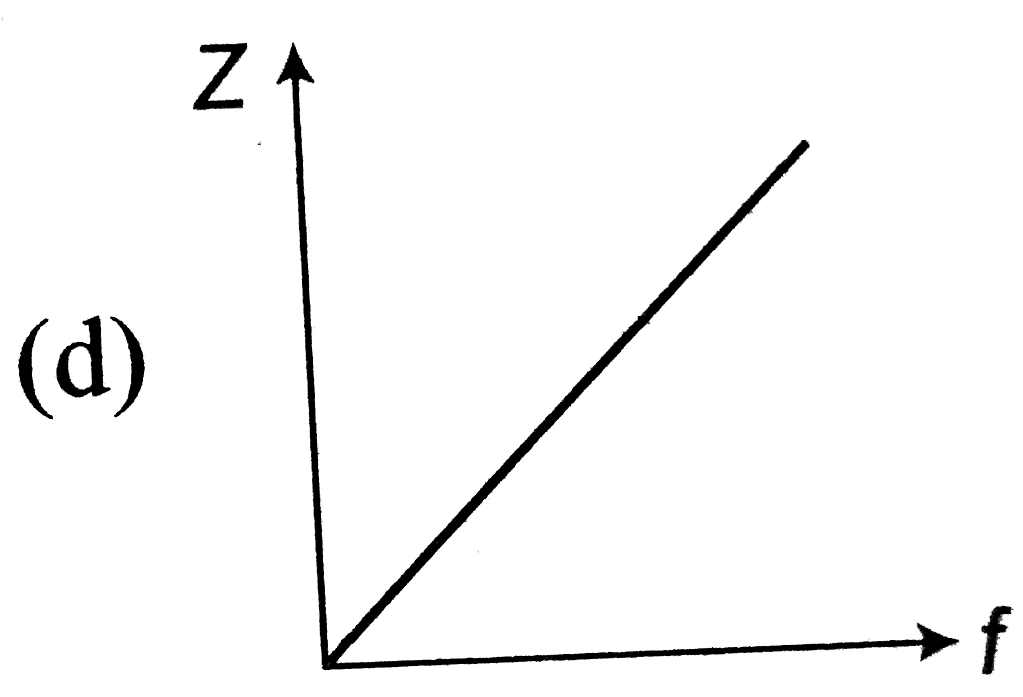
which of the following graph represents the variation of resistivity (ρ) with temperature (T) for copper?
A B
B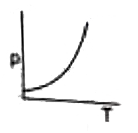 C
C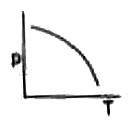 D
D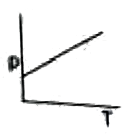
Which of the following graphs represent the correct variation of inductive reactance XL with frequency υ?
View SolutionWhich of the following graphs best represents the variation of acceleration 'a' with displacement x?
View SolutionWhich of the followings represent the variation of frequency (f) with radius of cross section of a stretched string?
View SolutionWhich of the following graphs represents the variation of activity (A) of a radioactive substance with time (t).
View SolutionA body moves from rest with a constant ac- celeration. Which of the following graphs represents the variation of its kinetic energy (E) with distance travelled (x)?
View Solution
