Which of the followings represent the variation of frequency (f) with radius of cross section of a stretched string?
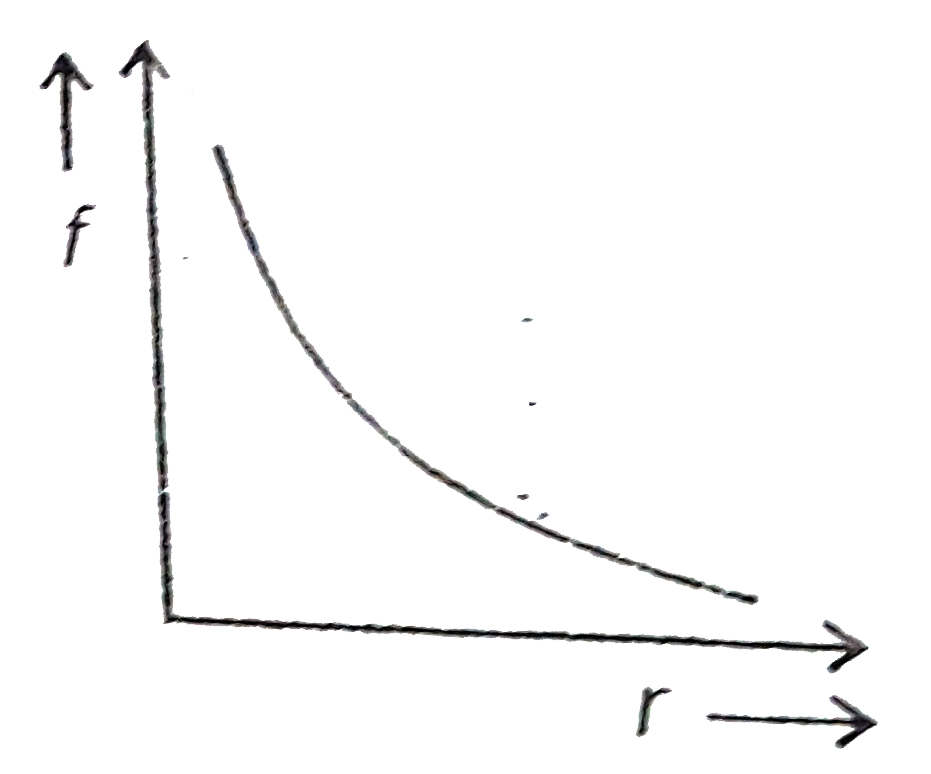
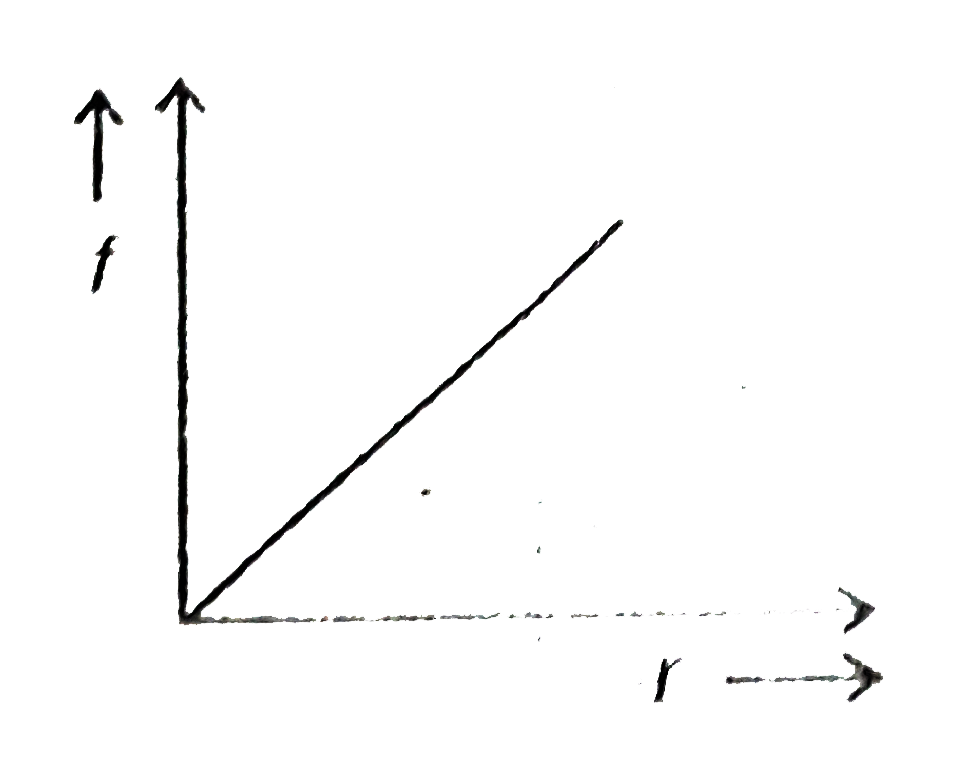
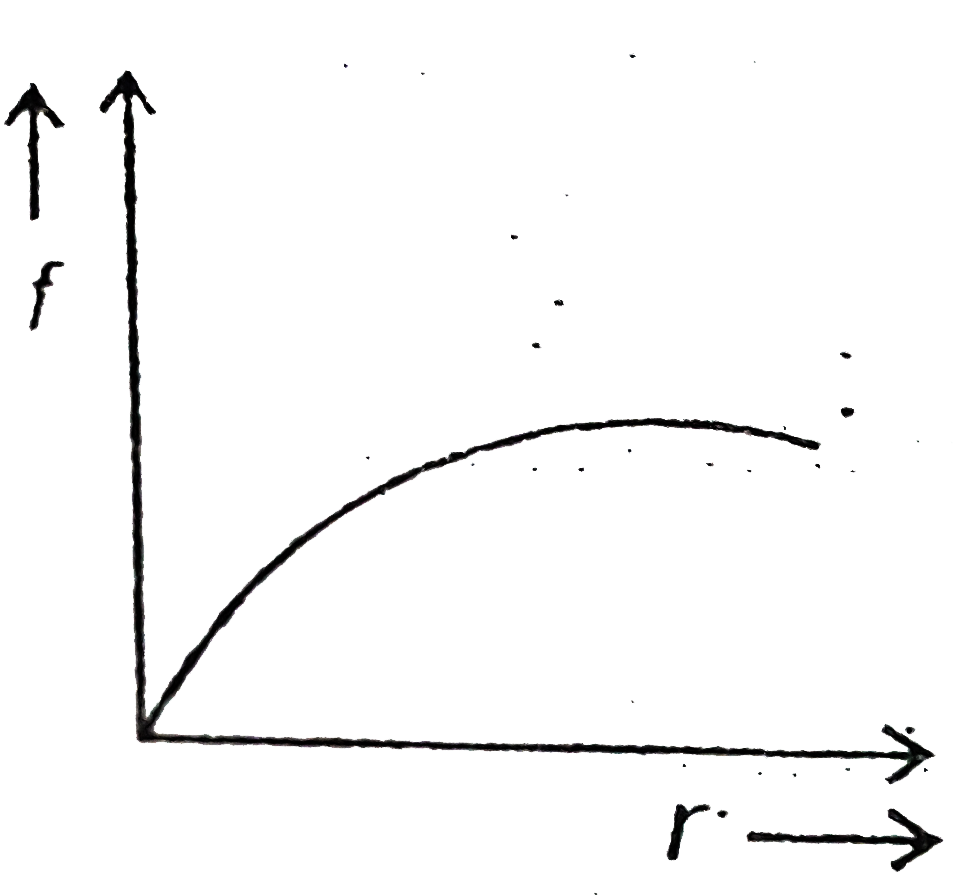
none of these
The correct Answer is:A
To determine the variation of frequency (f) with the radius of the cross-section (r) of a stretched string, we can follow these steps:
1. Understand the Fundamental Frequency Formula:
The fundamental frequency (f) of a stretched string is given by the formula:
f=12L√Tm
where T is the tension in the string, L is the length of the string, and m is the mass per unit length.
2. Express Mass per Unit Length (m):
The mass per unit length m can be expressed in terms of the volume and density of the string:
m=masslength=Volume×DensityL
3. Calculate Volume:
The volume of the string can be represented as:
Volume=Cross-sectional Area×Length=A×L
For a circular cross-section, the area A is given by:
A=πr2
Therefore, the volume becomes:
Volume=πr2×L
4. Substitute Volume into Mass per Unit Length:
Now substituting the volume into the mass per unit length:
m=πr2×L×ρL=πr2ρ
where ρ is the density of the material.
5. Substitute m into the Frequency Formula:
Now, substituting m back into the frequency formula:
f=12L√Tπr2ρ
6. Simplify the Frequency Expression:
Rearranging the formula gives:
f=12L√Tπρ⋅1r
This shows that frequency f is inversely proportional to the radius r of the cross-section of the string.
Conclusion:
Thus, the relationship between frequency f and the radius r of the cross-section of a stretched string is:
f∝1r
The fundamental frequency (f) of a stretched string is given by the formula:
f=12L√Tm
where T is the tension in the string, L is the length of the string, and m is the mass per unit length.
The mass per unit length m can be expressed in terms of the volume and density of the string:
m=masslength=Volume×DensityL
The volume of the string can be represented as:
Volume=Cross-sectional Area×Length=A×L
For a circular cross-section, the area A is given by:
A=πr2
Therefore, the volume becomes:
Volume=πr2×L
Now substituting the volume into the mass per unit length:
m=πr2×L×ρL=πr2ρ
where ρ is the density of the material.
Now, substituting m back into the frequency formula:
f=12L√Tπr2ρ
Rearranging the formula gives:
f=12L√Tπρ⋅1r
This shows that frequency f is inversely proportional to the radius r of the cross-section of the string.
Thus, the relationship between frequency f and the radius r of the cross-section of a stretched string is:
f∝1r
Topper's Solved these Questions
- WAVESBook:AAKASH INSTITUTEChapter:WAVESExercise:Assignment (Section-C)
Explore 11 Videos
- WAVESBook:AAKASH INSTITUTEChapter:WAVESExercise:Assignment (Section-D)
Explore 9 Videos
- WAVESBook:AAKASH INSTITUTEChapter:WAVESExercise:Assignment (Section-A)
Explore 55 Videos
- WAVE OPTICSBook:AAKASH INSTITUTEChapter:WAVE OPTICSExercise:Assignment (Section-J (Aakash Challengers question))
Explore 1 Video
- WORK, ENERGY AND POWERBook:AAKASH INSTITUTEChapter:WORK, ENERGY AND POWERExercise:Assignment (SECTION - D)
Explore 15 Videos
Similar Questions
Knowledge Check
Which of the following figures represents the cross section of an OV?
A B
B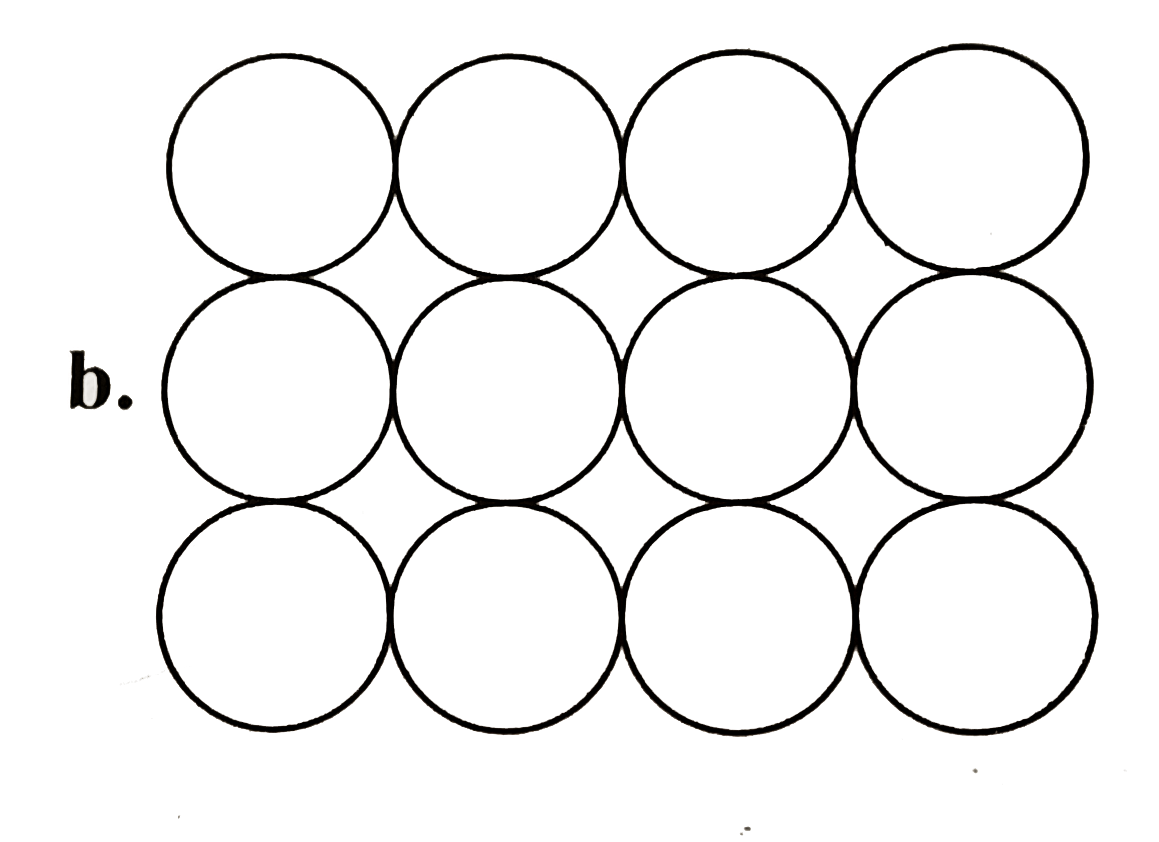 C
C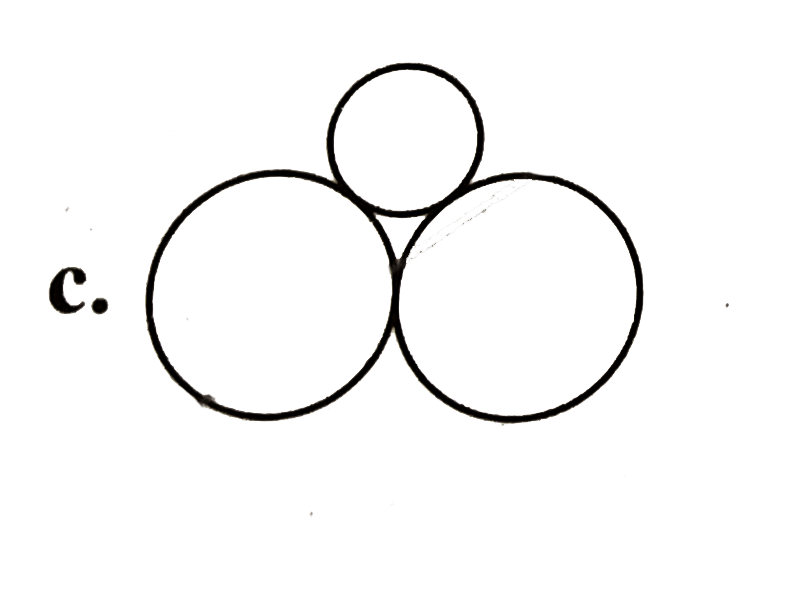 D
D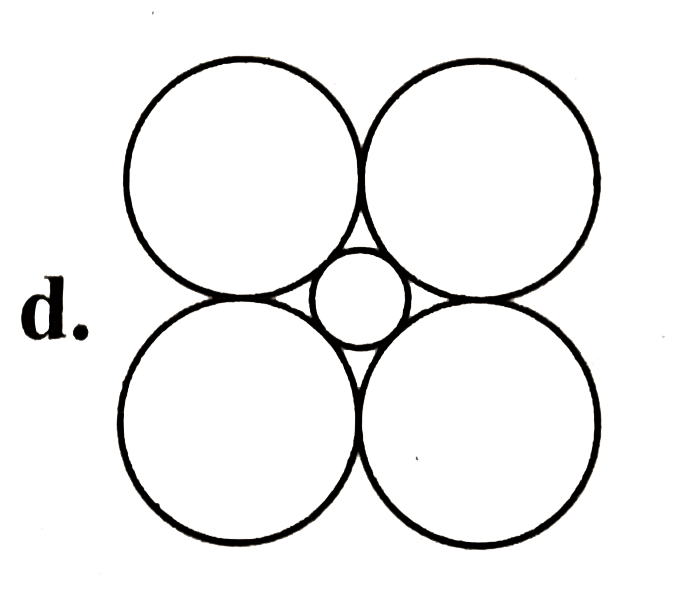
Which of the following curves represents the variation of impedance (Z) with frequency f in series LCR circuit?
A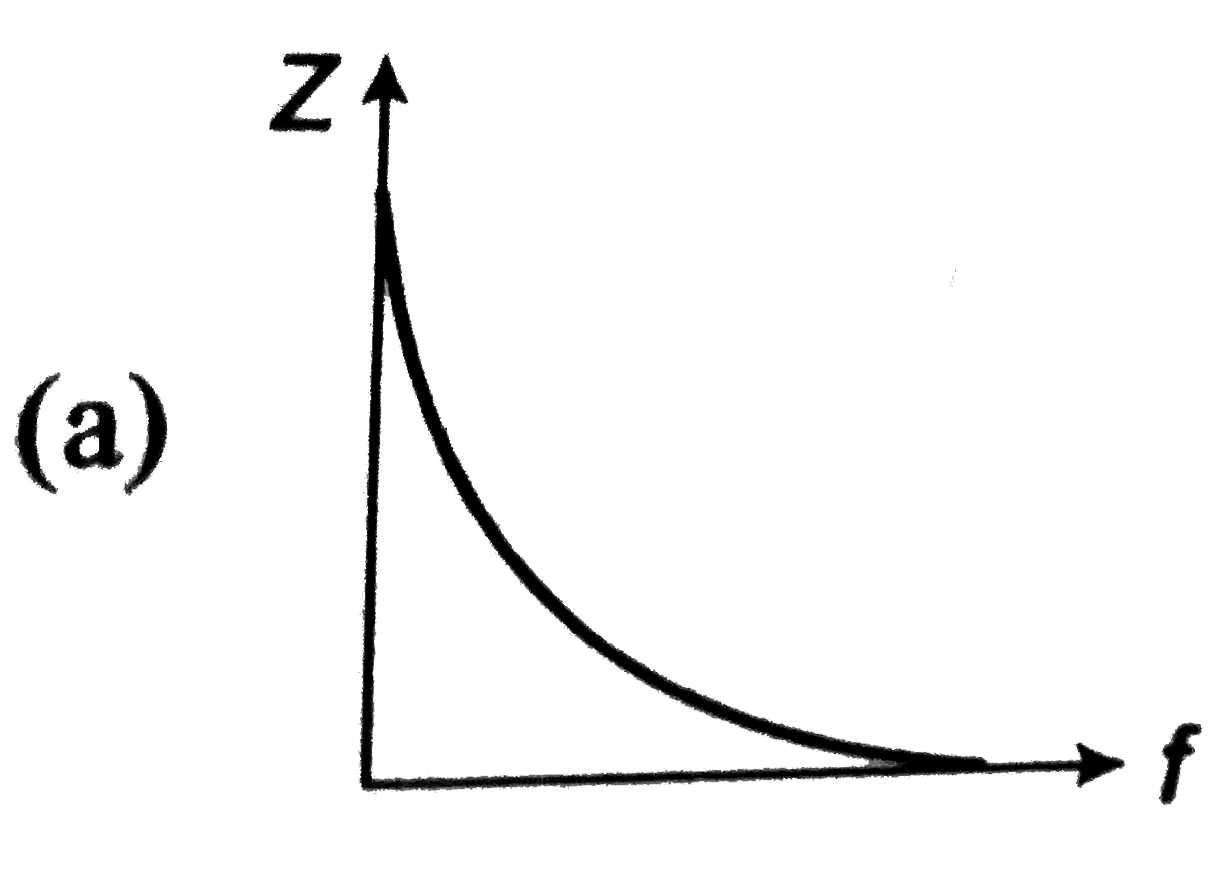 B
B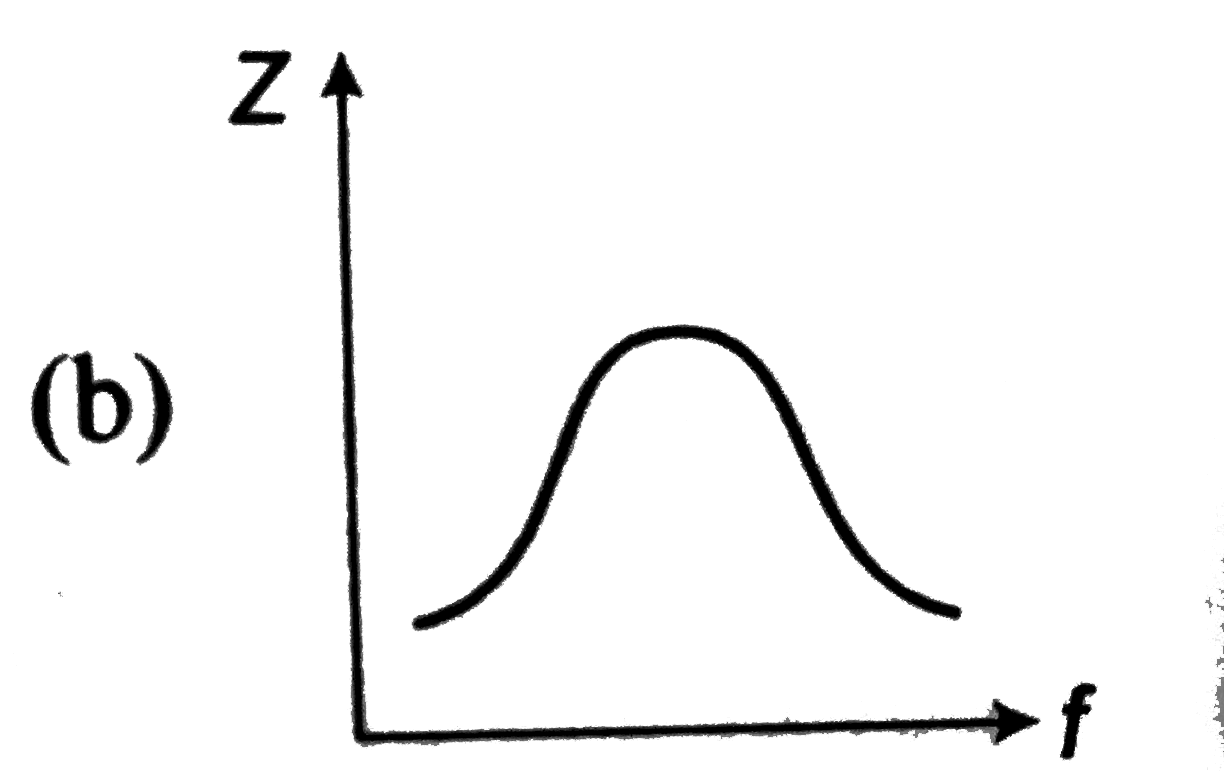 C
C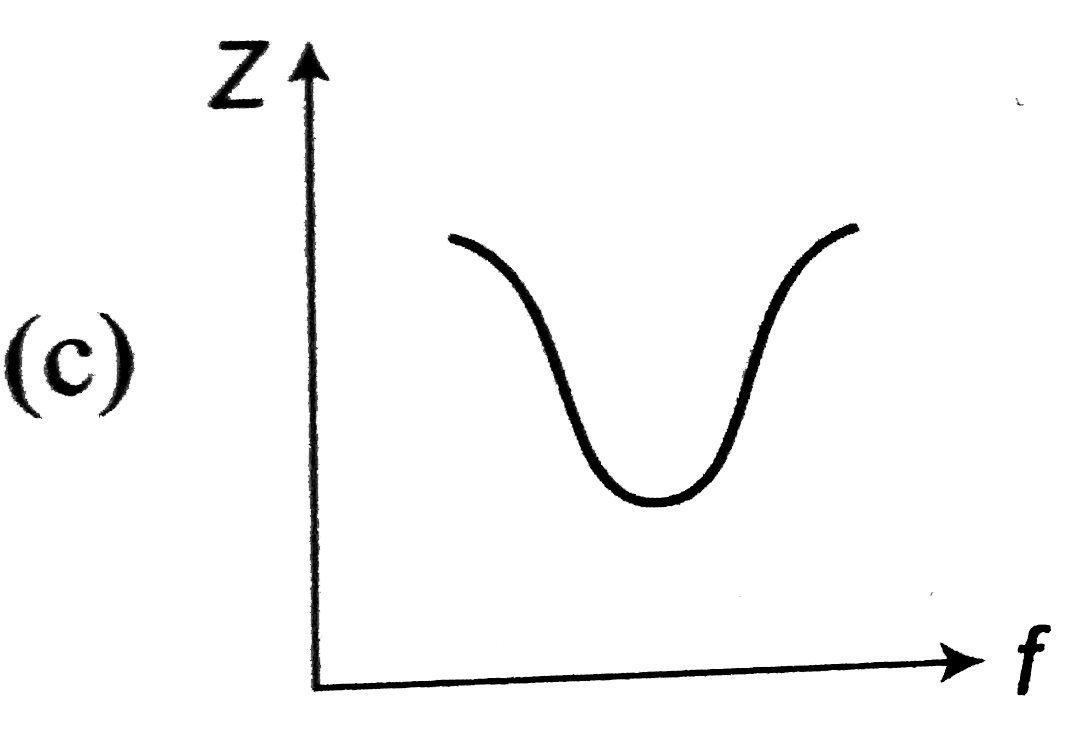 D
D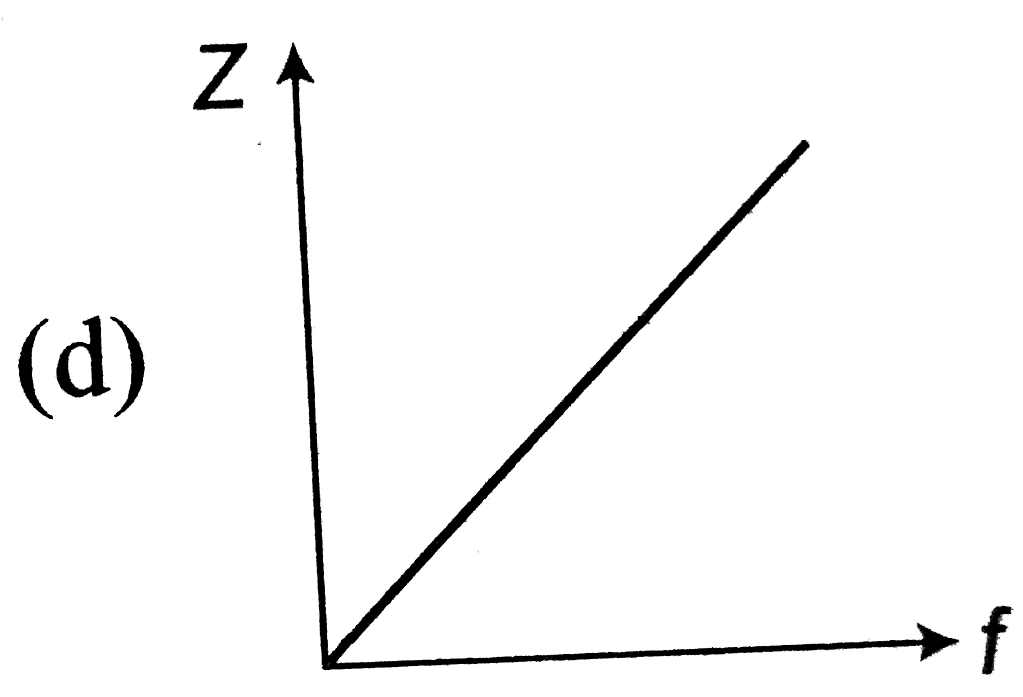
Which of the following graphs represent the variation of current(I) with frequency (f) in an AC circuit containing a pure capacitor?
A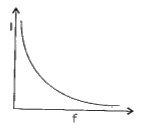 B
B C
C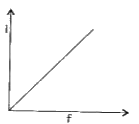 D
D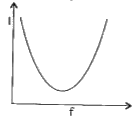
According to Bohr’s theory, which of the following correctly represents the variation of energy and radius of an electron in nth orbit of H-atom?
View SolutionWhich one of the follwing represents the variation of capacitive reactance (XC) with the frequency (v) of the voltage source ? .
View SolutionWhich of the following has lower stretching frequency for C-O bond ?
View SolutionWhich of the following has lower stretching frequency for C-O bond ?
View SolutionWhich of the following has lower stretching frequency for C-O bond ?
View Solution