Which of the following graphs represent the variation of current(I) with frequency (f) in an AC circuit containing a pure capacitor?
A

B

C
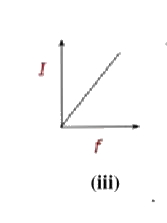
D

Video Solution
|
Answer
Step by step video & image solution for Which of the following graphs represent the variation of current(I) with frequency (f) in an AC circuit containing a pure capacitor? by Physics experts to help you in doubts & scoring excellent marks in Class 12 exams.
Updated on:21/07/2023
Related Playlists
- BOOK - CBSE MODEL PAPERCHAPTER - SAMPLE PAPER 2022EXERCISE - SECTION B24videos
SAMPLE PAPER 2022
- BOOK - CBSE MODEL PAPERCHAPTER - SAMPLE PAPER 2022EXERCISE - SECTION C6videos
SAMPLE PAPER 2022
- BOOK - CBSE MODEL PAPERCHAPTER - Additional Practice QuestionsEXERCISE - Question1videos
Additional Practice Questions
- BOOK - CBSE MODEL PAPERCHAPTER - SAMPLE PAPER 2022 TERM IIEXERCISE - SECTION B16videos
SAMPLE PAPER 2022 TERM II
Knowledge Check
- Question 1 - Select One
Which of the following graphs represent the variation of current(I) with frequency (f) in an AC circuit containing a pure capacitor?
A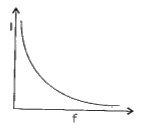 B
B C
C D
D
- Question 1 - Select One
Which of the following curves represents the variation of impedance (Z) with frequency f in series LCR circuit?
A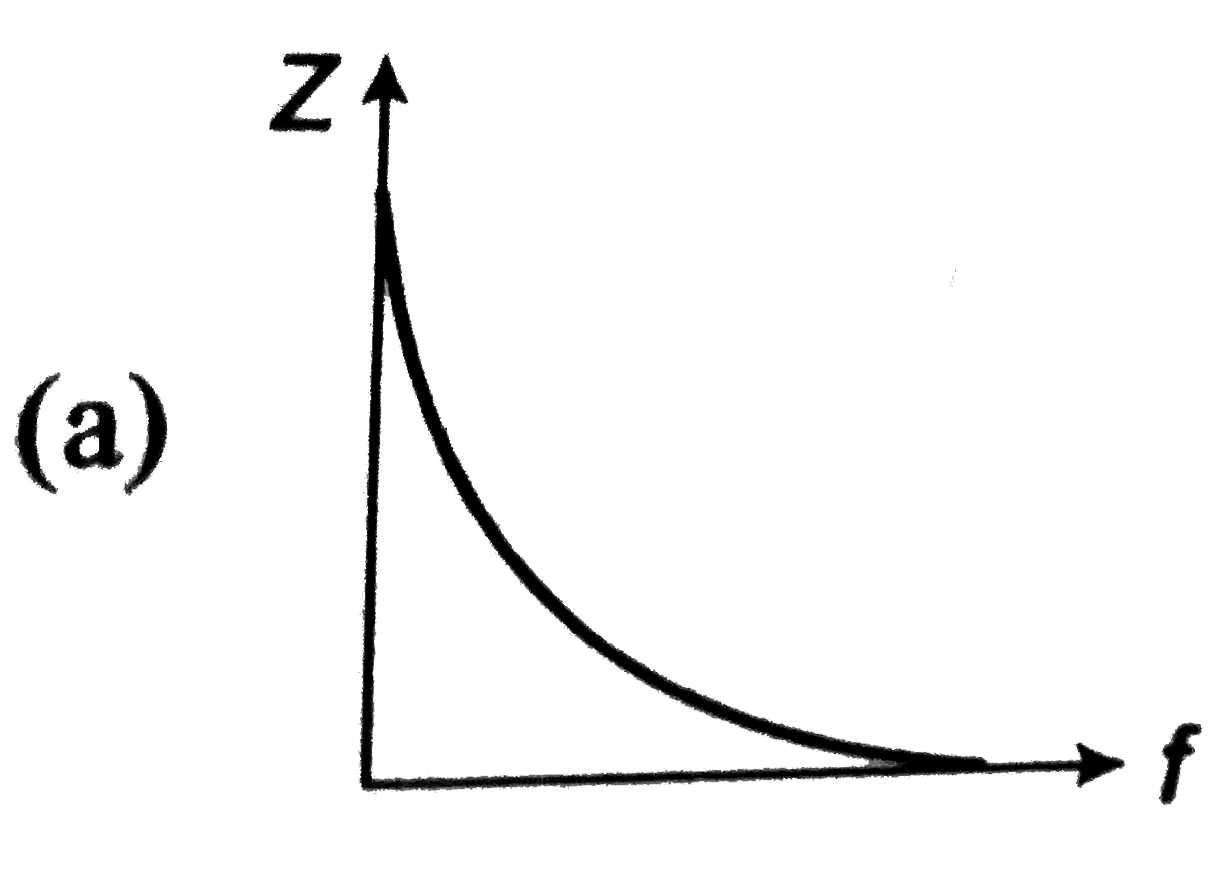 B
B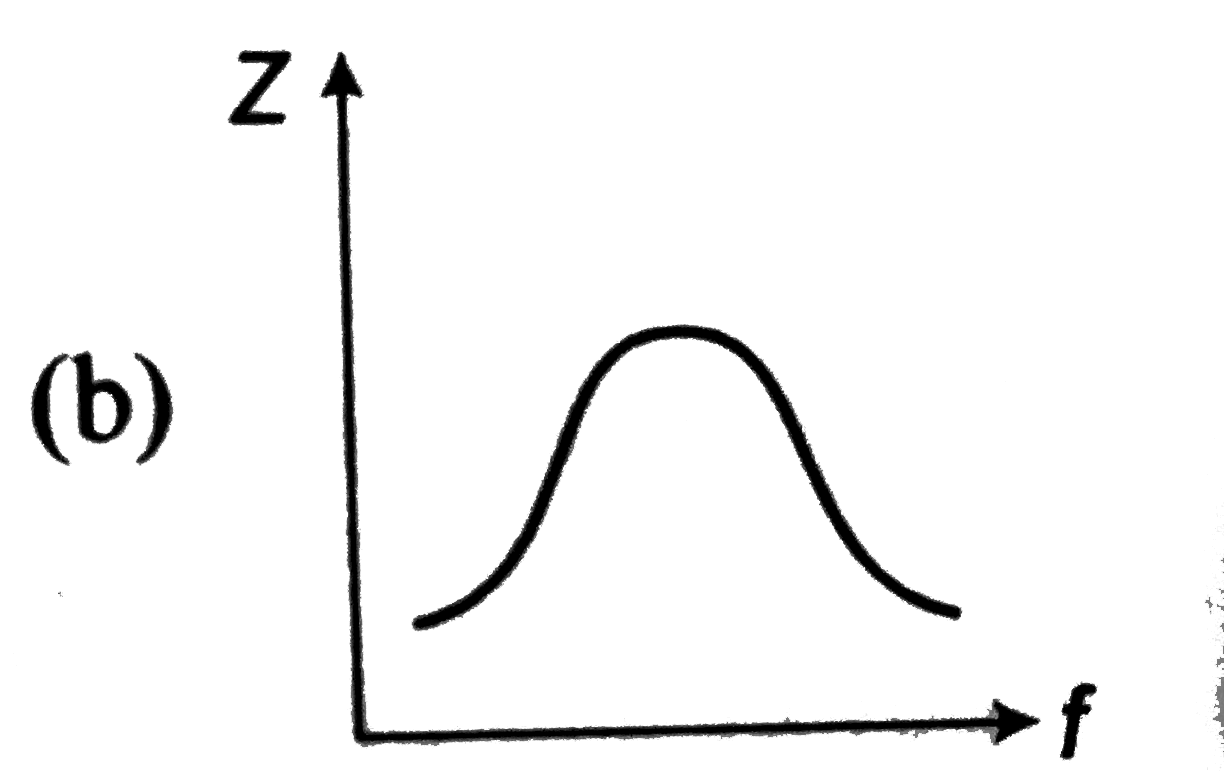 C
C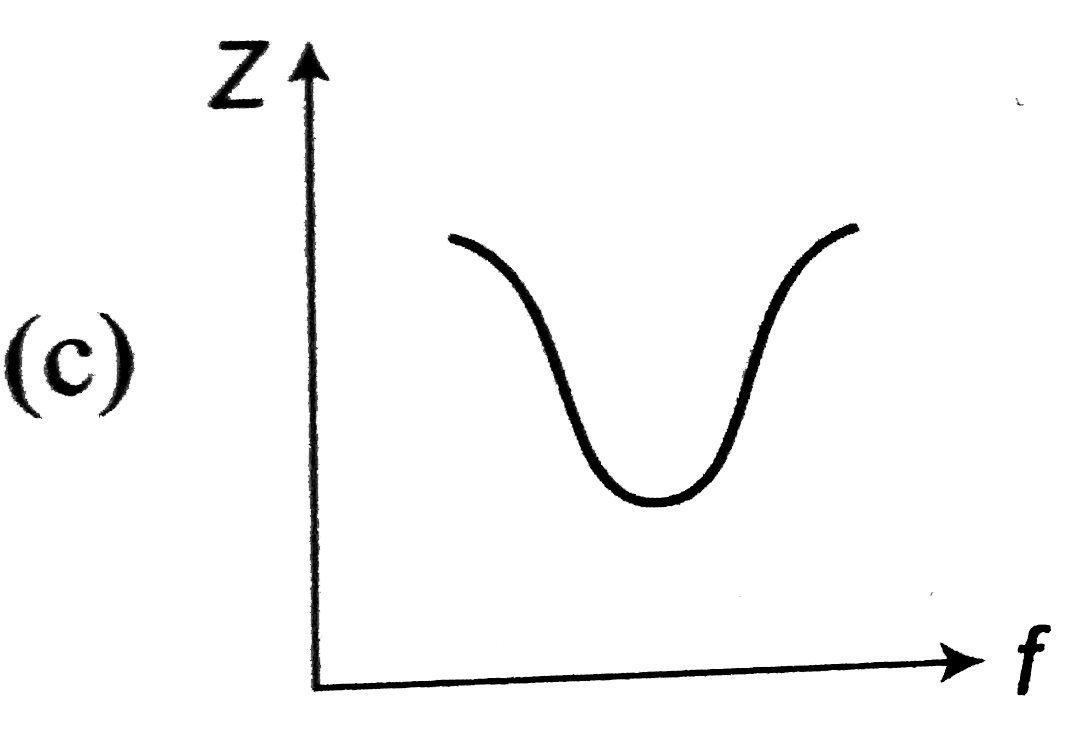 D
D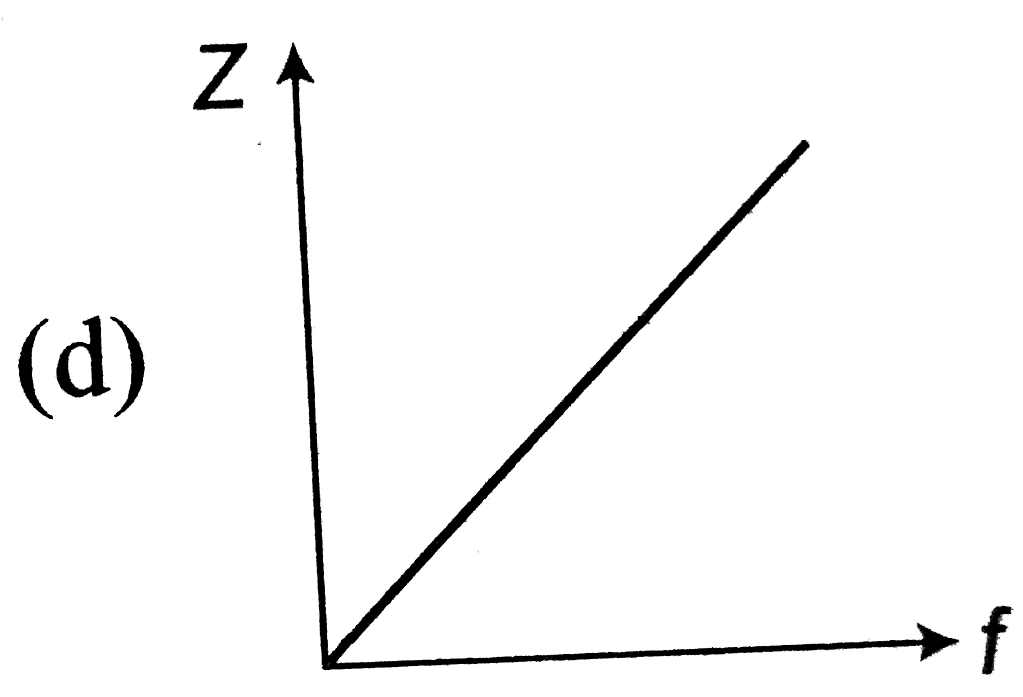
- Question 1 - Select One
which of the following graph represents the variation of resistivity (ρ) with temperature (T) for copper?
A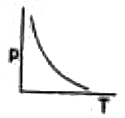 B
B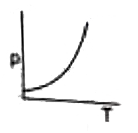 C
C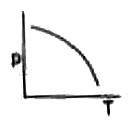 D
D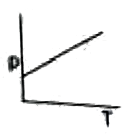
- Question 1 - Select One
Which of the following graphs represent the correct variation of inductive reactance XL with frequency υ?
A B
B C
C D
D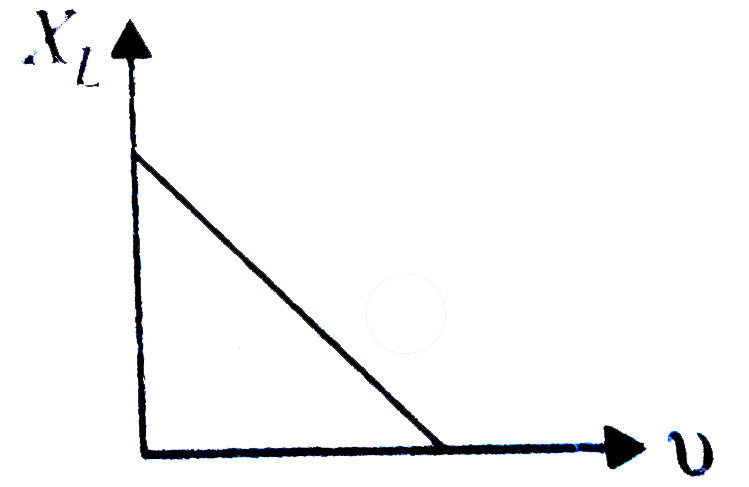
- Question 1 - Select One
Which of the following graphs best represents the variation of acceleration 'a' with displacement x?
A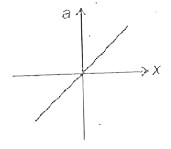 B
B C
C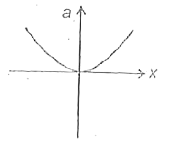 D
D
- Question 1 - Select One
Which of the followings represent the variation of frequency (f) with radius of cross section of a stretched string?
A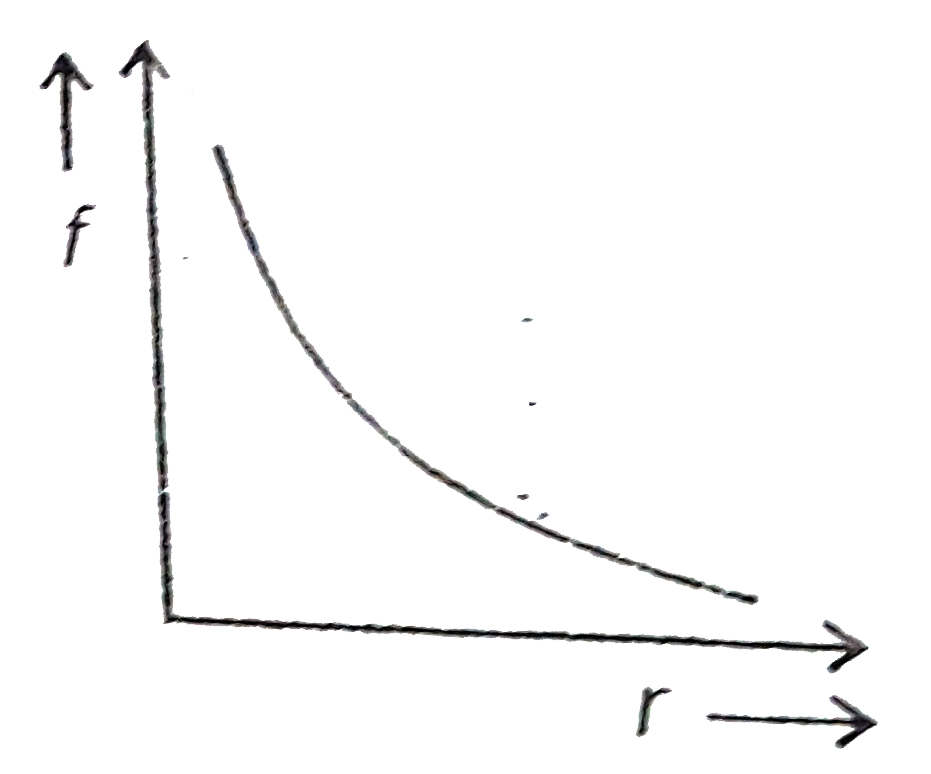 B
B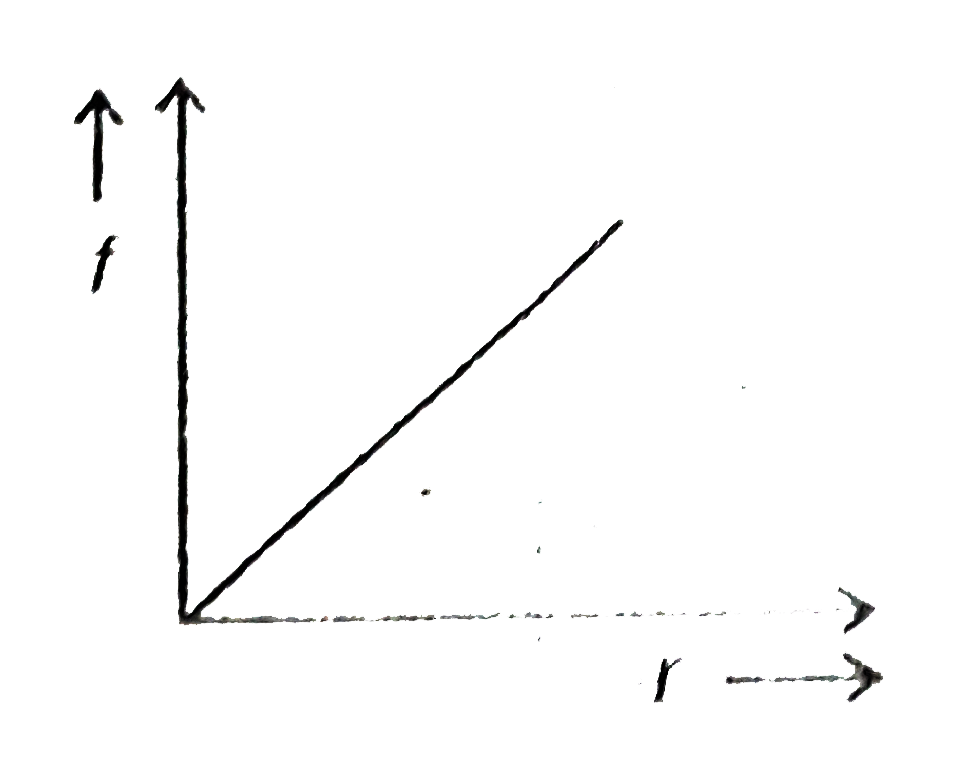 C
C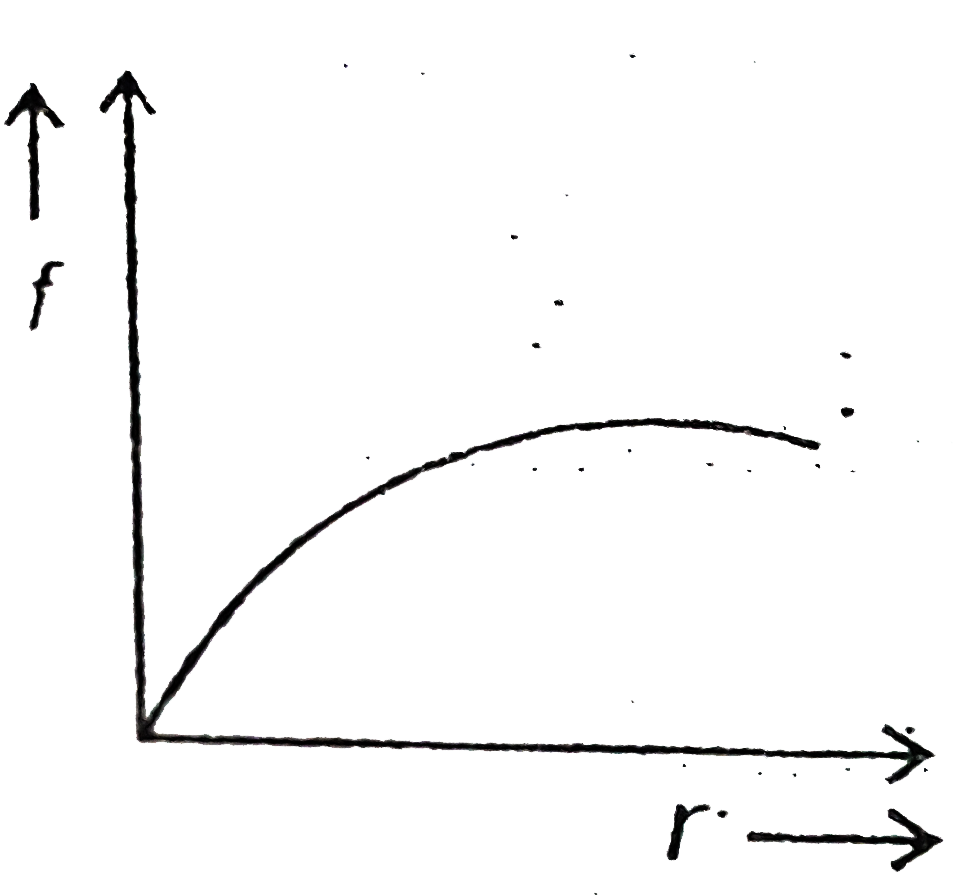 Dnone of these
 - Question 1 - Select One
Which of the following graphs represents the variation of activity (A) of a radioactive substance with time (t).
A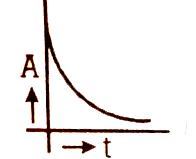 B
B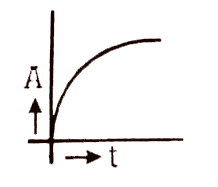 C
C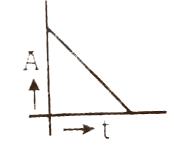 D
D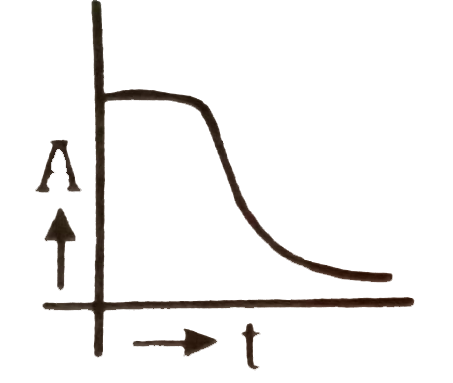
- Question 1 - Select One
A body moves from rest with a constant ac- celeration. Which of the following graphs represents the variation of its kinetic energy (E) with distance travelled (x)?
A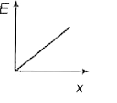 B
B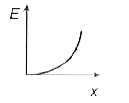 C
C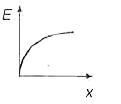 D
D

