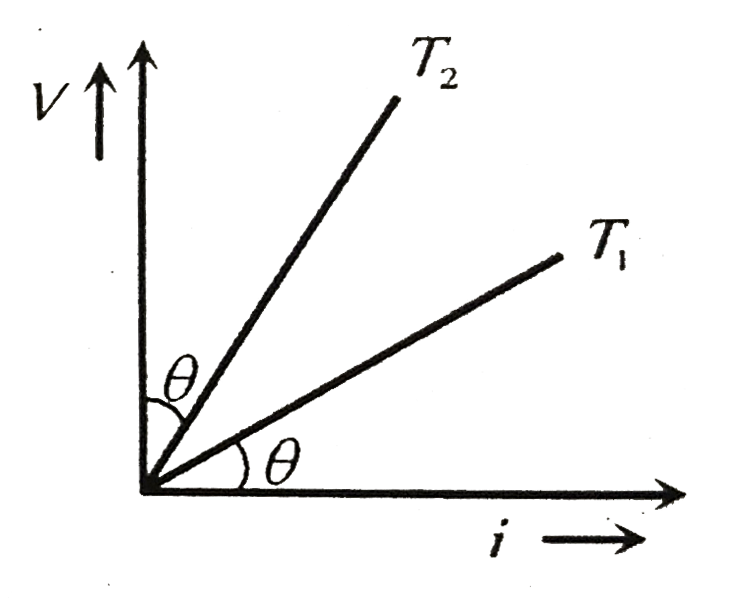
The V - i graph for a conductor at temperature and are as shown in the figure. is proportional to

The correct Answer is:C
For conductors, resistance ∝ temperature
i.e.,
and
and
Now, and
Now
Similar Questions
चित्र में विभवांतर V और धारा I के बीच किसी चालक के दो ताप T1और T2 पर ग्राफ दिखाए गये गये है । T1और T2 में सम्बन्ध होगा -

View SolutionThe current-voltage graph for a given metallic conductor at two different temperature T1andT2 are as shown in the figure. Then

View SolutionThe voltage V and current I graphs for a conductor at two different tempratures T_(1) and T_(2) are shown in the figure .The relation between T_(1) and T_(2) is
View SolutionThe voltage-current (V-I) graph of a metallic conductor at two different temperatures T1 and T2 is shown below. At which temperature is the resistance higher ?

View SolutionThe voltage V and current I v graphs for a conductor at two different temperatures T1andT2 are shown in the figure. The relation between T1andT2 is

View SolutionThe V - i graph for a conductor at temperature T_(1) and T_(2) are as shown in the figure. ( T_(2) - T_(1)) is proportional to
View SolutionV - I graph of a conductor at temperature T_(1) and T_(2) are shown in the figure (T_(2)-T_(1)) is proportional to
View SolutionAssertion : Current versus potential difference (i-V) graph for a conductor at two different temperatures T_(1) and T_(2) is shown in figure. Hence T_(1)gt T_(2) . Reason : Resistance of a conductor increases with rise in temperature.
View Solution
