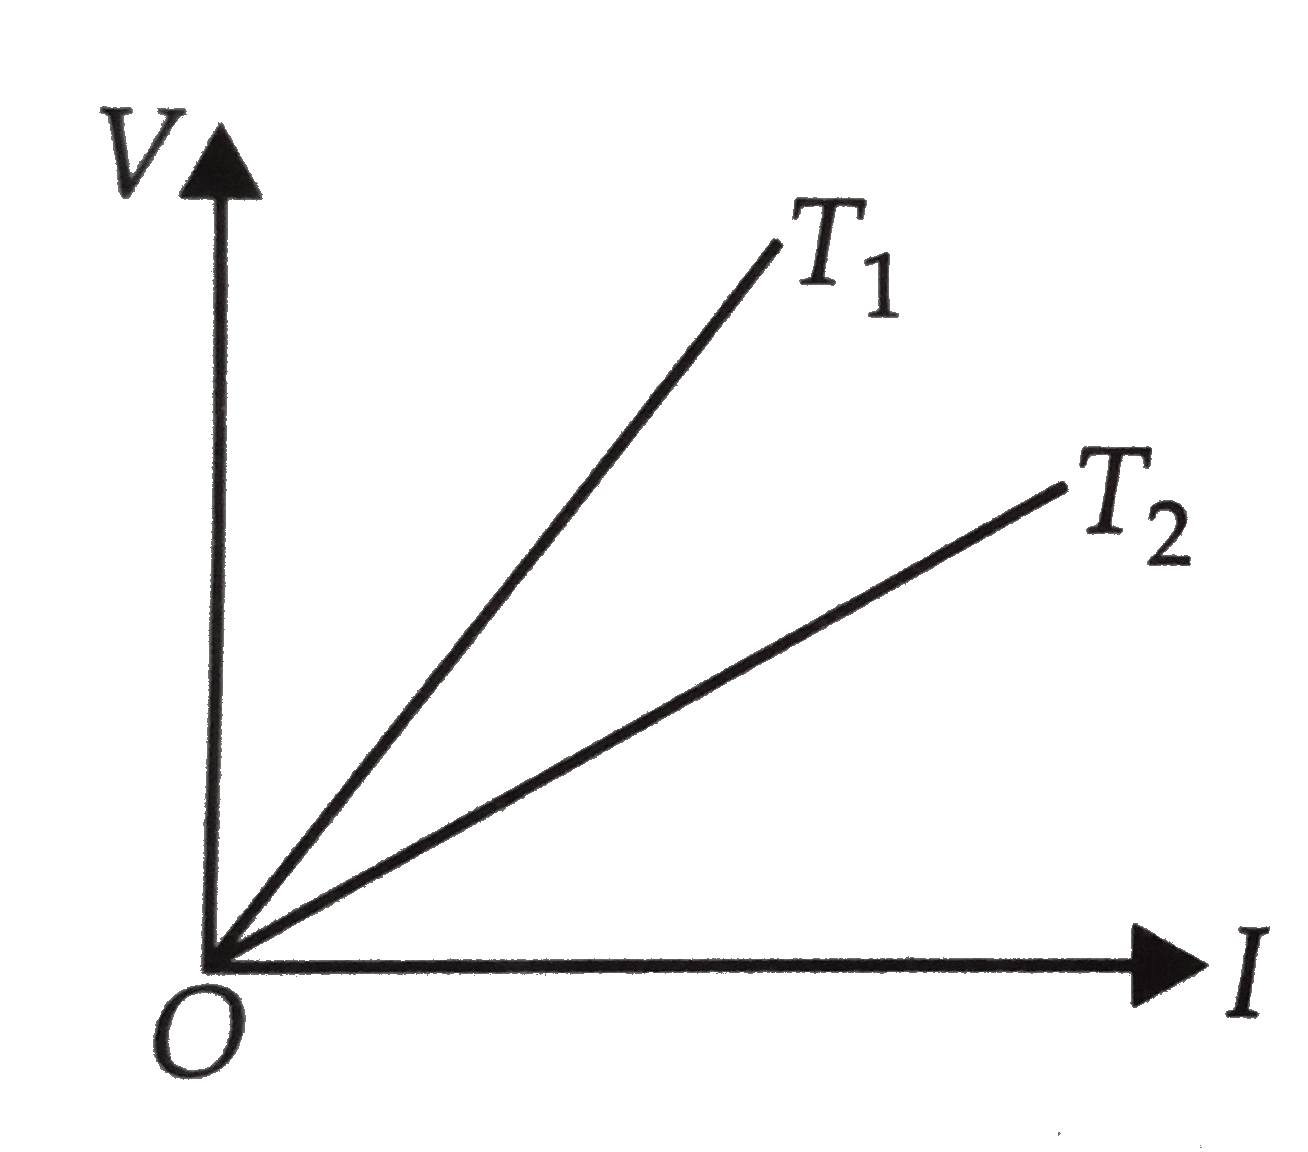
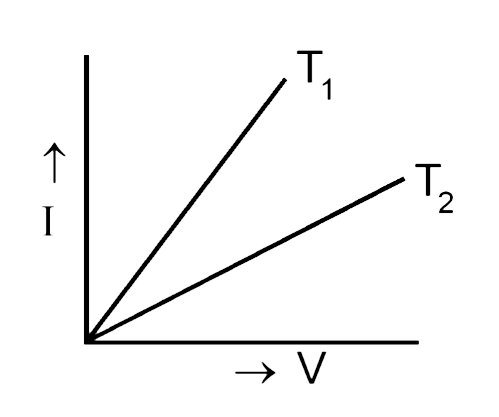
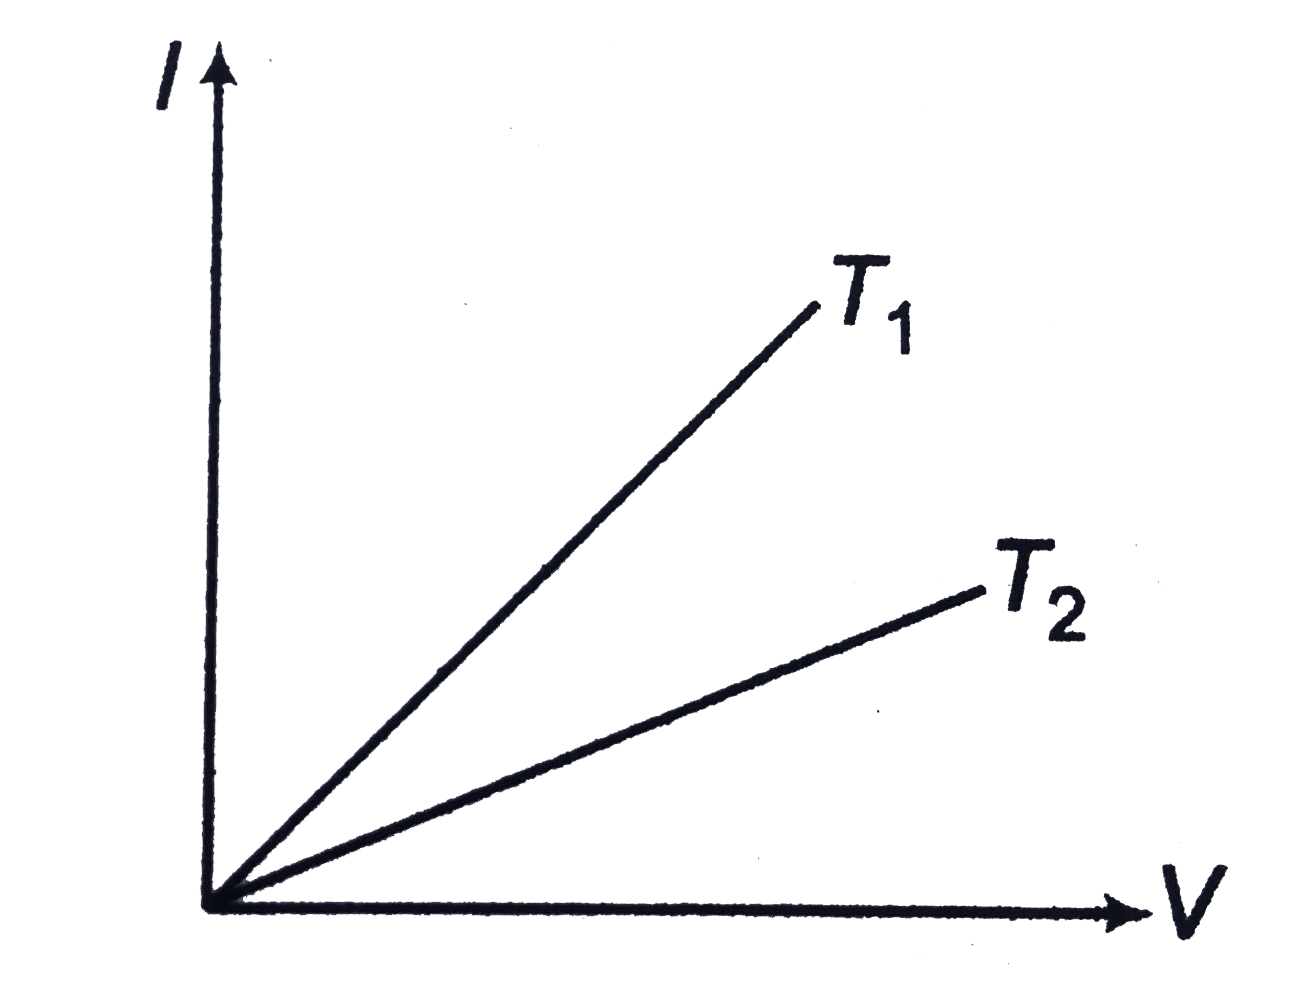
The voltage V and current I v graphs for a conductor at two different temperatures T1andT2 are shown in the figure. The relation between T1andT2 is

T1>T2
T1<T2
T1=T2
T1=1T2
The correct Answer is:A
The slope of V-I graph gives the resistance fo a conductor at a given temperature. From the graph, it follows that resistance of a conductor at temperature T1 is greater than at temperature T2. As the resistance of a conductor is more at higher temperature and less at lower temperature, hence T1>T2
Topper's Solved these Questions
- CURRENT ELECTRICITYBook:NCERT FINGERTPS ENGLISHChapter:CURRENT ELECTRICITYExercise:DRIFT OF ELECTRONS
Explore 2 Videos
- CURRENT ELECTRICITYBook:NCERT FINGERTPS ENGLISHChapter:CURRENT ELECTRICITYExercise:LIMITATIONS OF OHM S LAW
Explore 4 Videos
- CURRENT ELECTRICITYBook:NCERT FINGERTPS ENGLISHChapter:CURRENT ELECTRICITYExercise:ELECTRIC CURRENT IN CONDUCTORS
Explore 2 Videos
- COMMUNITCATION SYSTEMSBook:NCERT FINGERTPS ENGLISHChapter:COMMUNITCATION SYSTEMSExercise:Assertion And Reason
Explore 30 Videos
- DUAL NATURE OF RADIATION AND MATTER Book:NCERT FINGERTPS ENGLISHChapter:DUAL NATURE OF RADIATION AND MATTER Exercise:Assertion And Reason
Explore 15 Videos
Similar Questions
The current - voltage graphs for a given metallic wire at two different temperatures T1andT2 are shown in the figure.
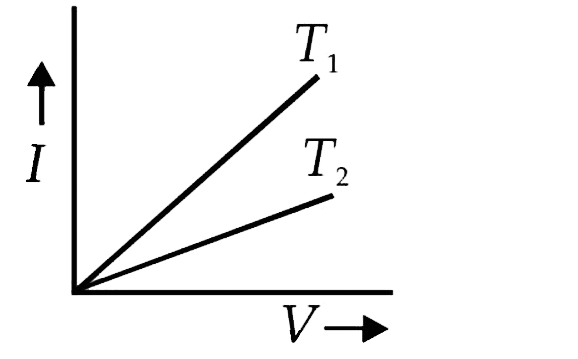
The temperature T2 is greater than T1.
View SolutionThe current - voltage graphs for a given metallic wire at two different temperatures T1andT2 are shown in the figure.

The temperature T2 is greater than T1.
View Solution
Knowledge Check
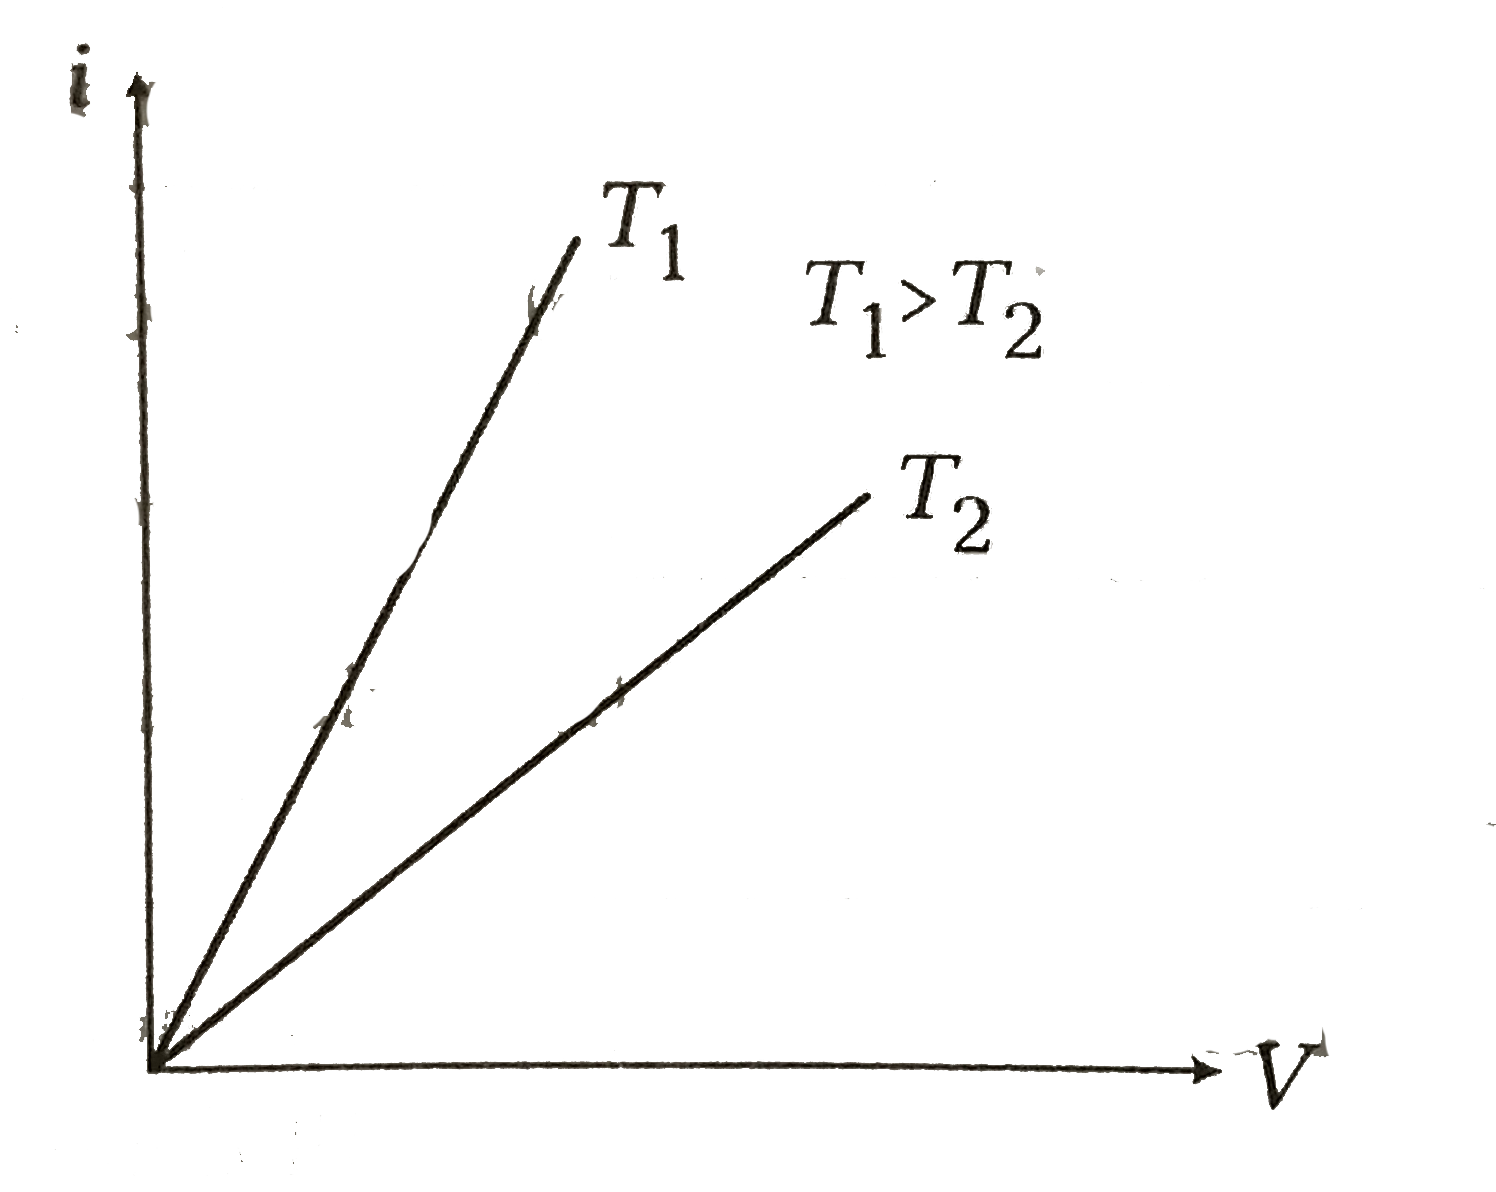
Assertion : Current versus potential difference (i-V) graph for a conductor at two different temperatures T1 and T2 is shown in figure. Hence T1>T2.
Reason : Resistance of a conductor increases with rise in temperature.Acos2θBsin2θCcot2θDtan2θThe isothermal diagram of a gas at three different temperatures T1,T2andT3, is show in the given figure .Then
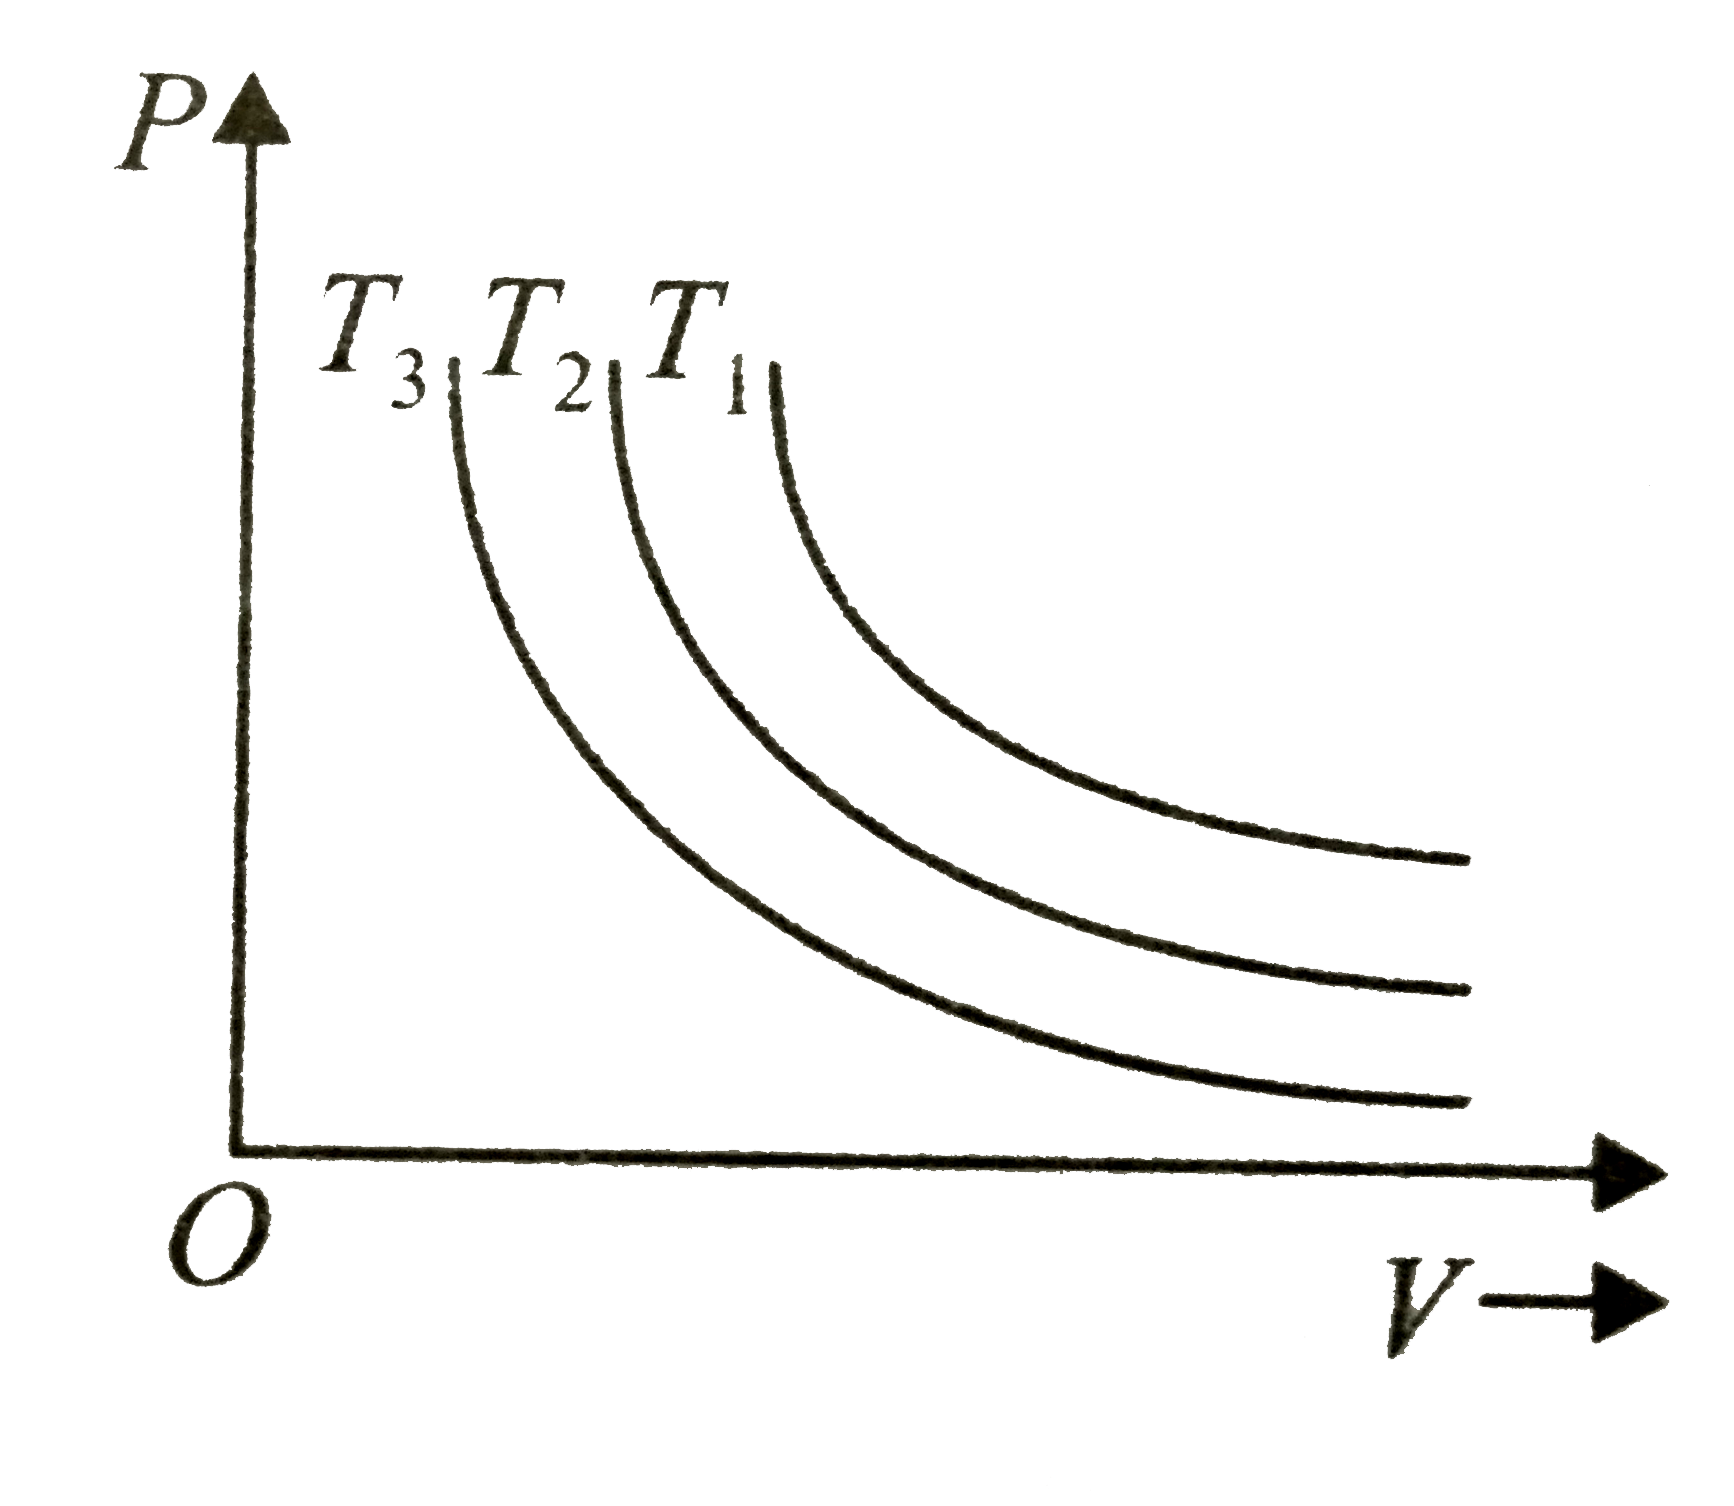 Aa.T1<T2<TBb. T1<T2>T3Cc.T1>T2>T3Dd.T1>T2<T3
Assertion : Current versus potential difference (i-V) graph for a conductor at two different temperatures T1 and T2 is shown in figure. Hence T1>T2.

Reason : Resistance of a conductor increases with rise in temperature.
View SolutionI-V graph for a metallie wire at two different tempearture, T1andT2 is as shown in the figure. Which of the two temperatures is lower and why ?

View SolutionThe current (I) and voltage (V) graphs for a given metallic wire at two different temperature (T1) and (T2) are shown in fig. It is concluded that
View SolutionThe current voltage graphs for a given metalic wire two different temperature T1 and T2 are shown in figure The temperature T2 is greater than T1. Is this statement true or false?
View SolutionThe current voltage graphs for a given metalic wire two different temperature T1 and T2 are shown in figure The temperature T2 is greater than T1. Is this statement true or false?

View SolutionIn the arrangment shown in the figure, the ratio of tensions T1:T2:T3 is:

View Solution

