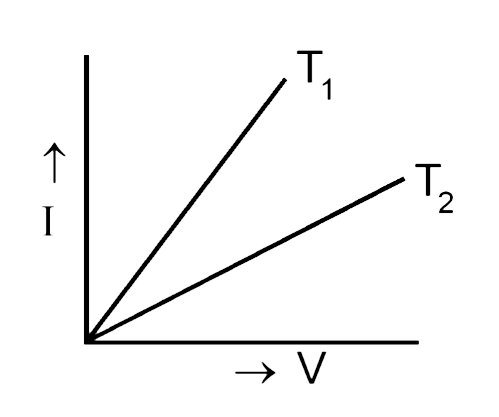
The current voltage graphs for a given metalic wire two different temperature T1 and T2 are shown in figure The temperature T2 is greater than T1. Is this statement true or false?
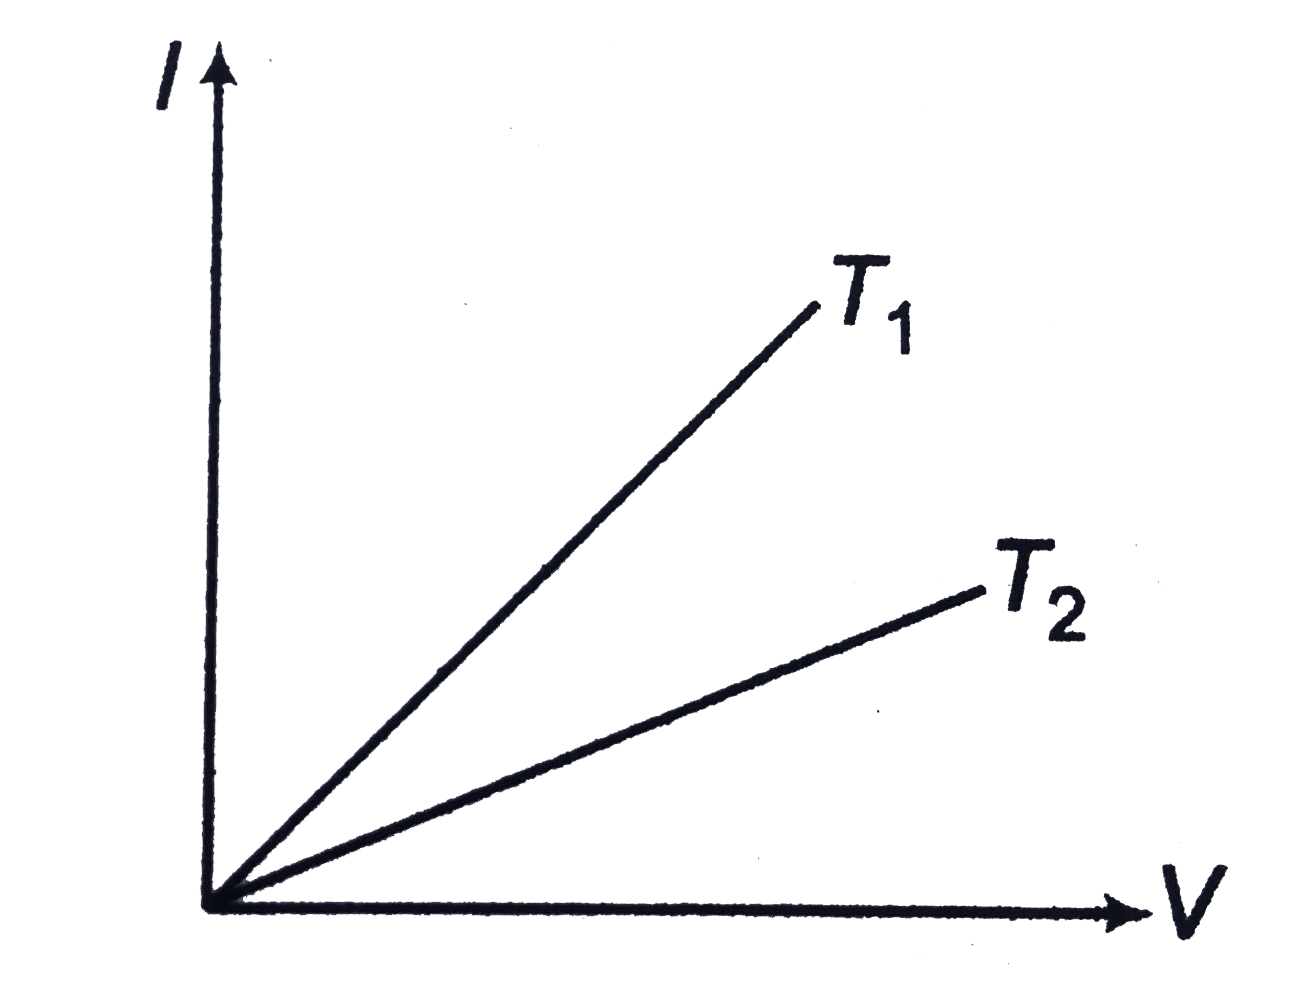
We know R = V/I and slope of IV
curve is I/R.
or R=1slope
Sine the slop of OT2 is smaller
then OT1, the resistance of wire
at T2 is greater then that at T1
as resistance increase with
temperature, so temperature T2
is greater then T1.

Topper's Solved these Questions
- ELECTRIC CURRENT AND CIRCUITBOOK - CENGAGE PHYSICS ENGLISHCHAPTER - ELECTRIC CURRENT AND CIRCUITEXERCISE - Exercise 5.2
50 Videos
- ELECTRIC CURRENT AND CIRCUITBOOK - CENGAGE PHYSICS ENGLISHCHAPTER - ELECTRIC CURRENT AND CIRCUITEXERCISE - Subjective
29 Videos
- ELECTRIC CURRENT AND CIRCUITBOOK - CENGAGE PHYSICS ENGLISHCHAPTER - ELECTRIC CURRENT AND CIRCUITEXERCISE - Solved Examples
12 Videos
- ELECTRIC CURRENT & CIRCUITSBOOK - CENGAGE PHYSICS ENGLISHCHAPTER - ELECTRIC CURRENT & CIRCUITSEXERCISE - Kirchhoff s law and simple circuits
15 Videos
- ELECTRIC FLUX AND GAUSS LAWBOOK - CENGAGE PHYSICS ENGLISHCHAPTER - ELECTRIC FLUX AND GAUSS LAWEXERCISE - MCQ s
38 Videos
Similar Questions
The current - voltage graphs for a given metallic wire at two different temperatures T1andT2 are shown in the figure.
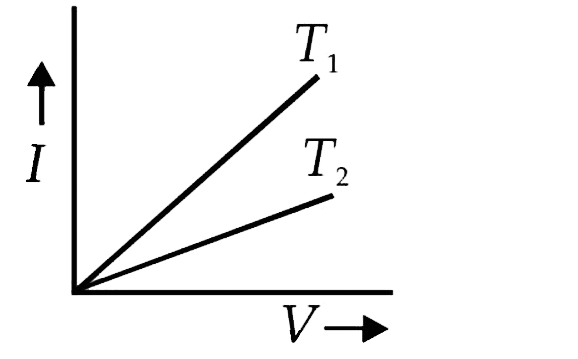
The temperature T2 is greater than T1.
View SolutionThe current - voltage graphs for a given metallic wire at two different temperatures T1andT2 are shown in the figure.

The temperature T2 is greater than T1.
View Solution
Knowledge Check
The voltage V and current I v graphs for a conductor at two different temperatures T1andT2 are shown in the figure. The relation between T1andT2 is
 AT1>T2BT1<T2CT1=T2DT1=1T2
The isothermal diagram of a gas at three different temperatures T1,T2andT3, is show in the given figure .Then
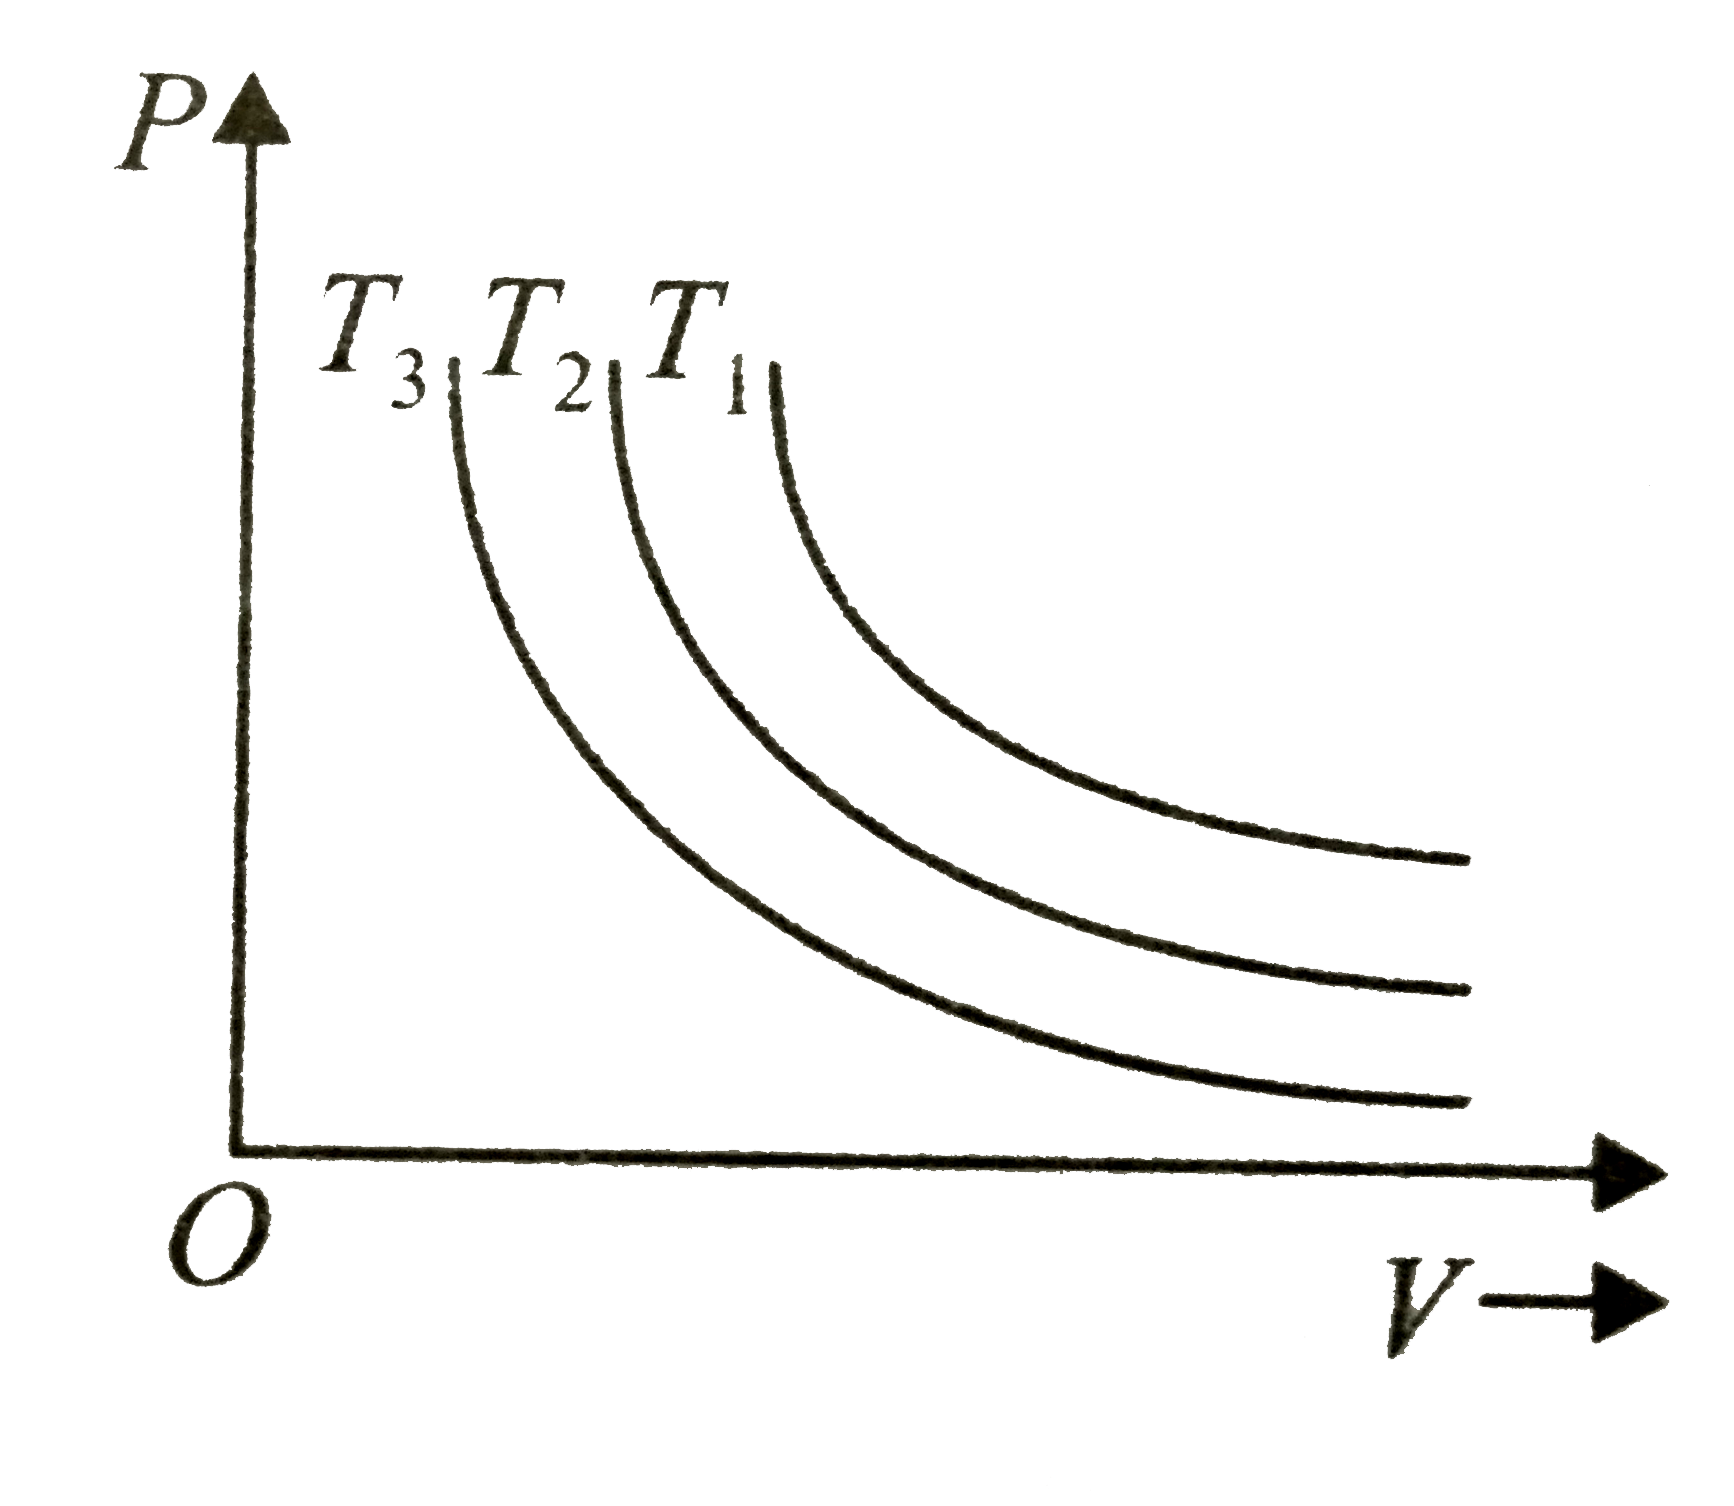 Aa.T1<T2<TBb. T1<T2>T3Cc.T1>T2>T3Dd.T1>T2<T3
Assertion : Current versus potential difference (i-V) graph for a conductor at two different temperatures T1 and T2 is shown in figure. Hence T1>T2.
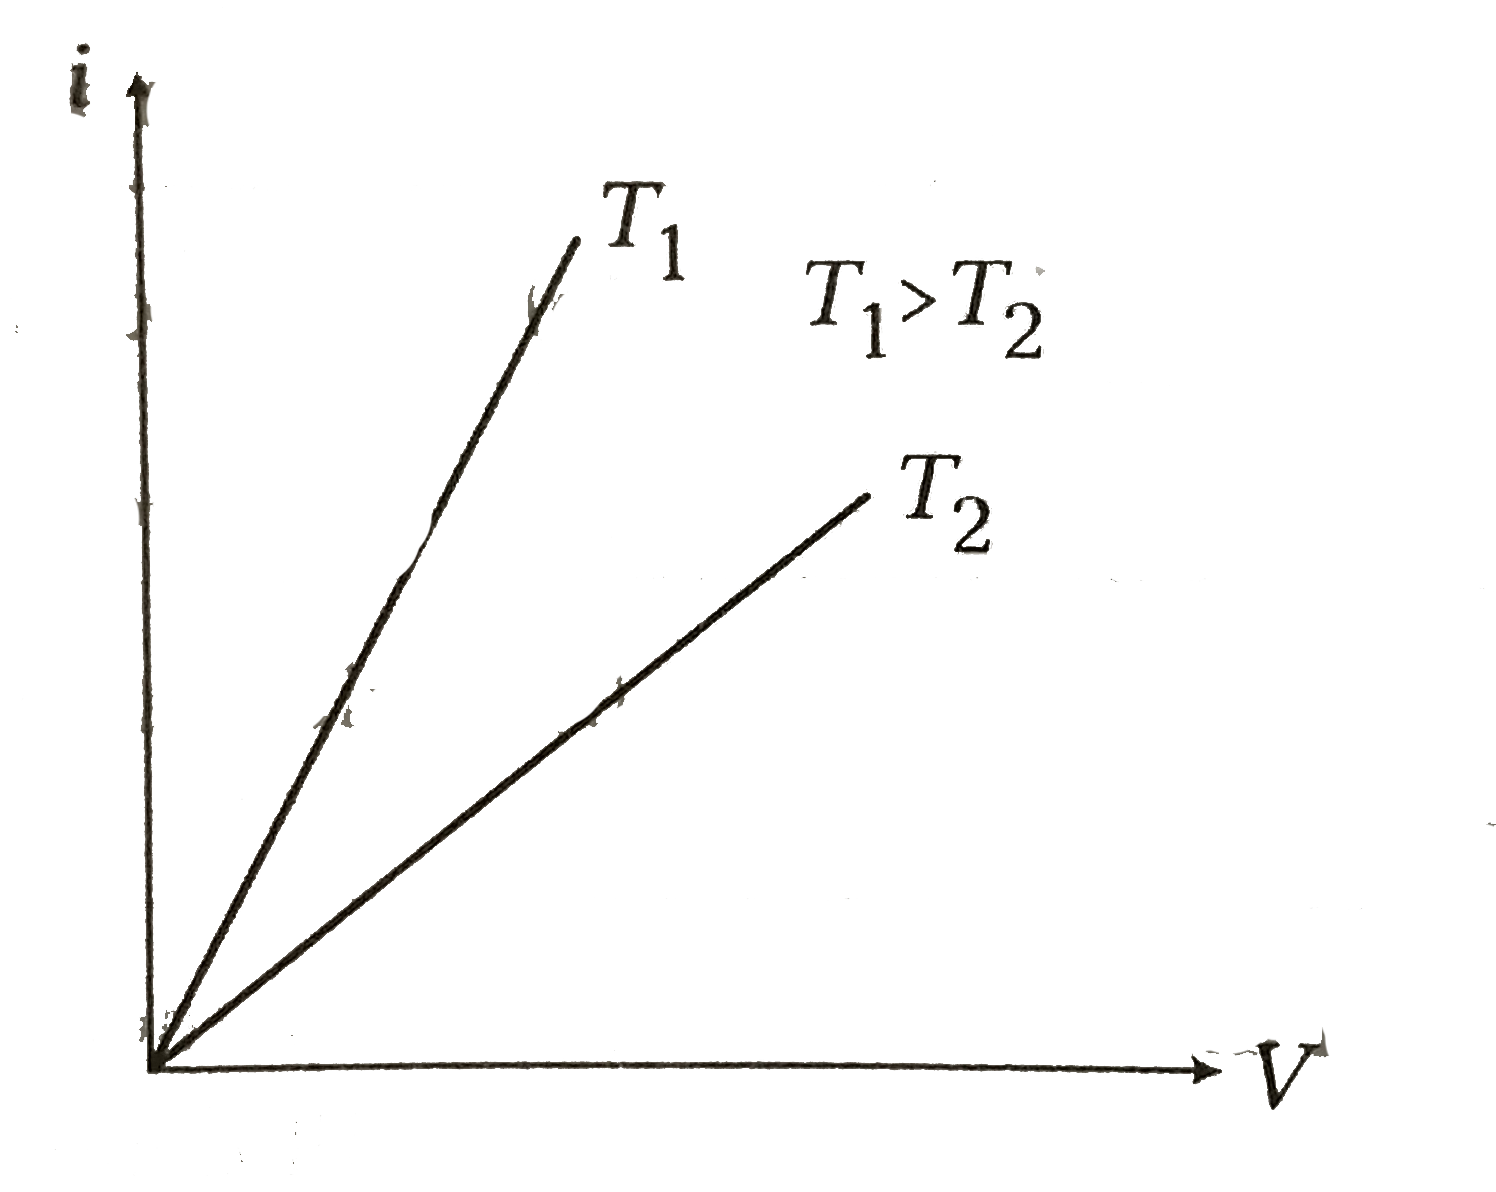
Reason : Resistance of a conductor increases with rise in temperature.Acos2θBsin2θCcot2θDtan2θ
The current (I) and voltage (V) graphs for a given metallic wire at two different temperature (T1) and (T2) are shown in fig. It is concluded that
View SolutionI-V graph for a metallie wire at two different tempearture, T1andT2 is as shown in the figure. Which of the two temperatures is lower and why ?

View SolutionT1andT2 in the given figure are
View SolutionThe stress-strain graph for a metallic wire is shown at two different temperature, T1 and T2 which temperature is high T1 or T2 ?
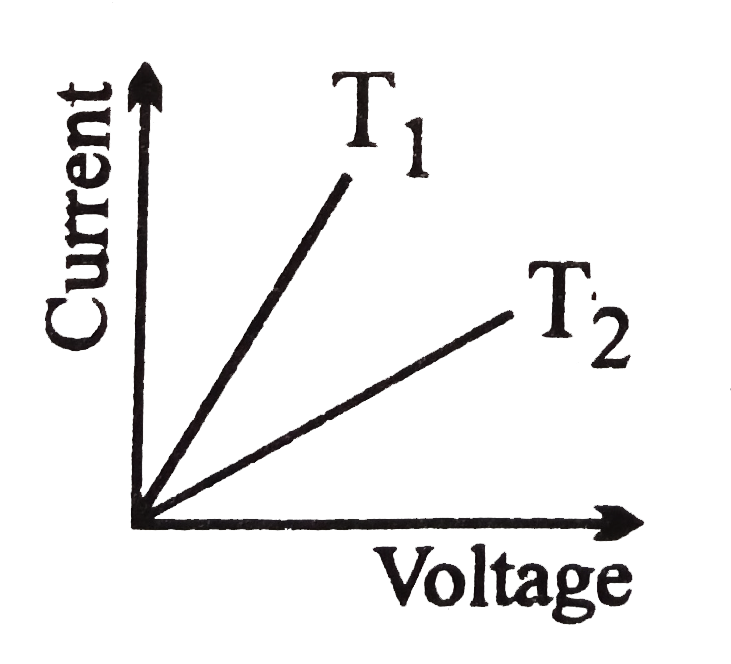
View SolutionThe current in a metallic conductor is plotted against voltage at two different temperatures T1 and T2. Which is correct
View Solution
