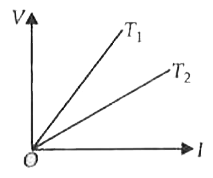
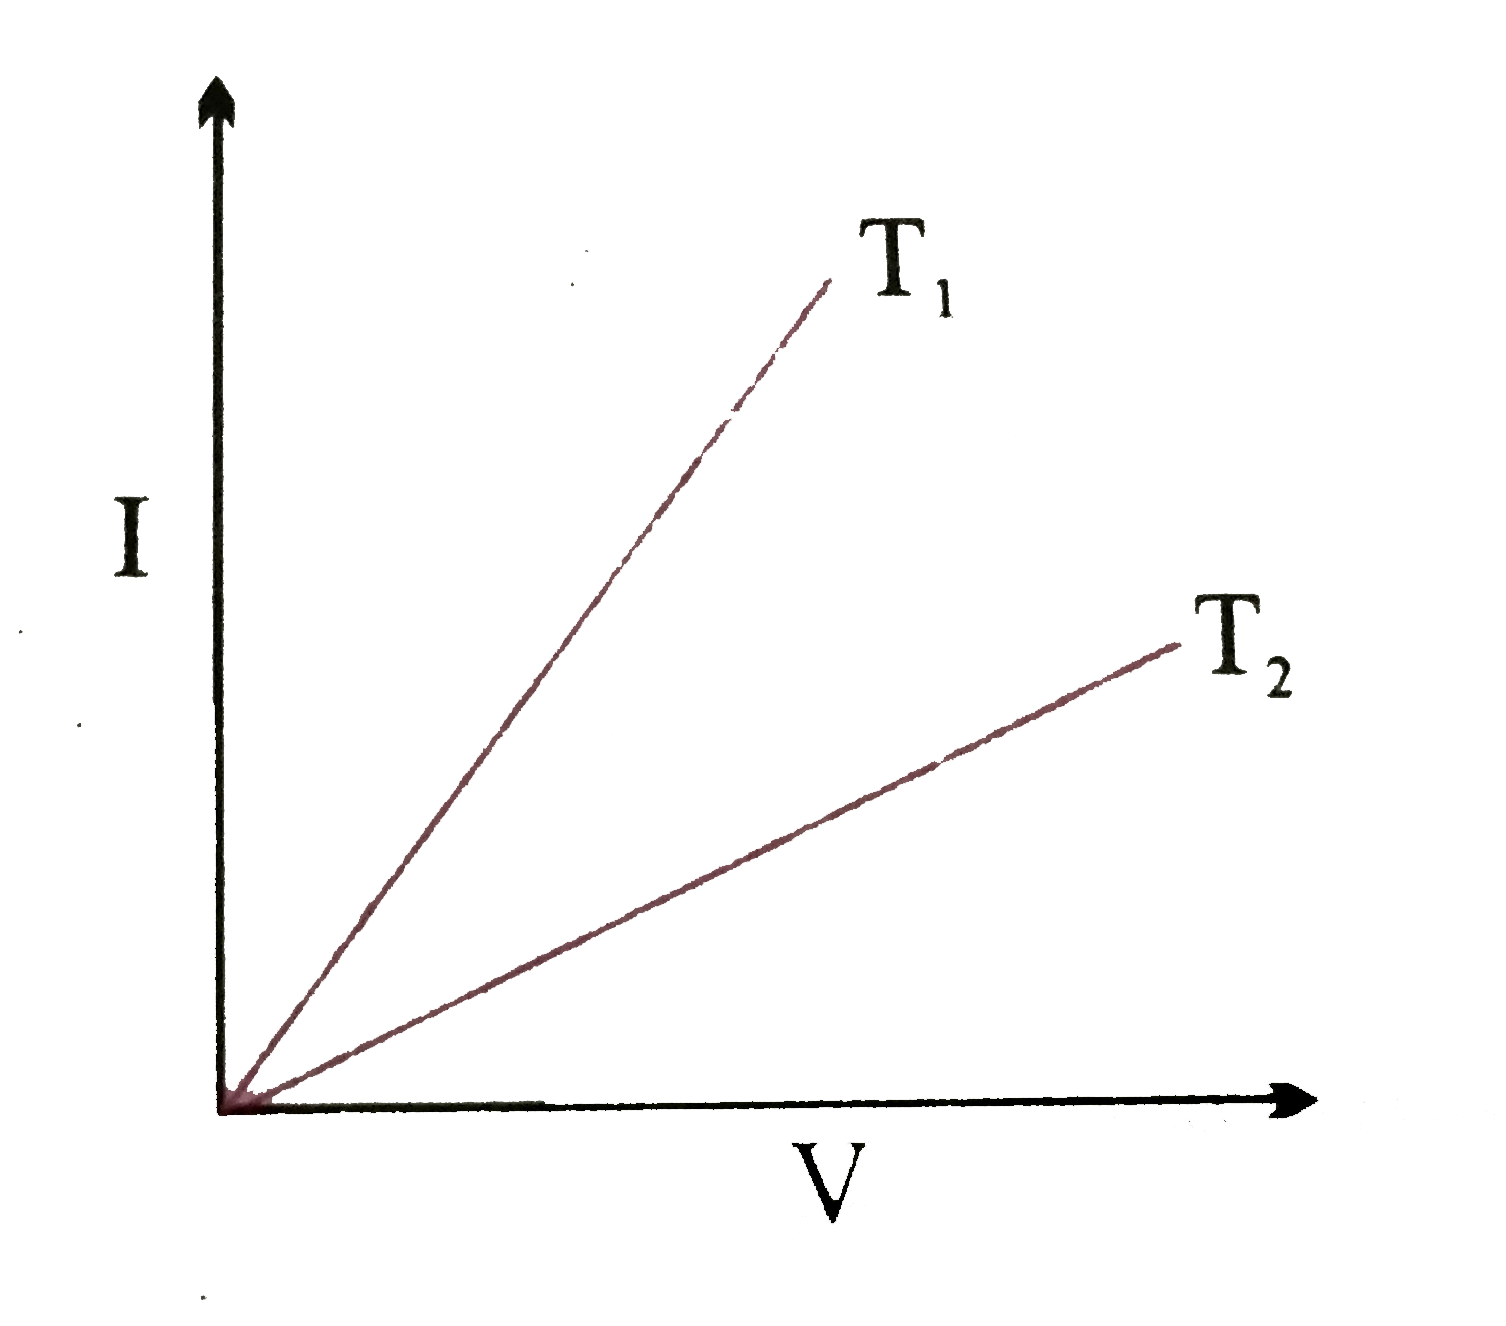
The voltage V and current I graphs for a conductor at two different tempratures T1 and T2 are shown in the figure .The relation between T1 and T2 is
 Solution in Kannada
T1>T2
T1<T2
T1=T2
T1=1T2
The correct Answer is:A
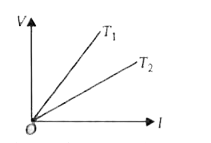
The slope of V-I graph gives the resistance of a conductor at a given temprature.
From the graph,it follows that resistance of a conductor at temperature T1 is greater than at temprature T2.As the resistance of a conductor is more at higher temprature and less at lower temprature,hence T1>T2
Topper's Solved these Questions
Similar Questions
An uncharged sphere of metal is placed inside a charged parallel plate capacitor. The lines of force will look like
03:29View SolutionThe figure shows the variation of V with i at temperatures T_(1) and T_(2) . Then T_(1)-T_(2) is proportional to
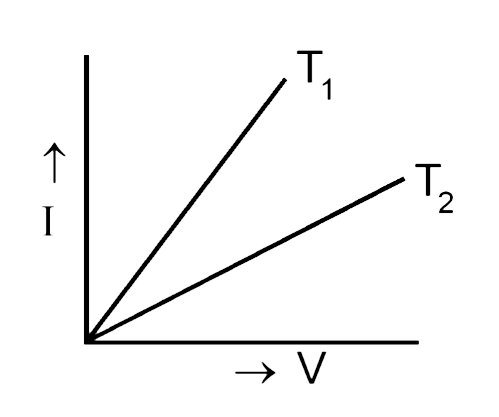
01:41View SolutionThe current (I) and voltage (V) graphs for a given metallic wire at two different temperature (T1) and (T2) are shown in fig. It is concluded that
 View Solution
The voltage V and current I graph for a conductor at two different temperatures T_(1) and T_(2) are shown in the figure. The relation between T_(1) and T_(2) is
03:04View SolutionThe V - i graph for a conductor at temperature T_(1) and T_(2) are as shown in the figure. ( T_(2) - T_(1)) is proportional to
01:36View SolutionAssertion : Current versus potential difference (i-V) graph for a conductor at two different temperatures T1 and T2 is shown in figure. Hence T1>T2.
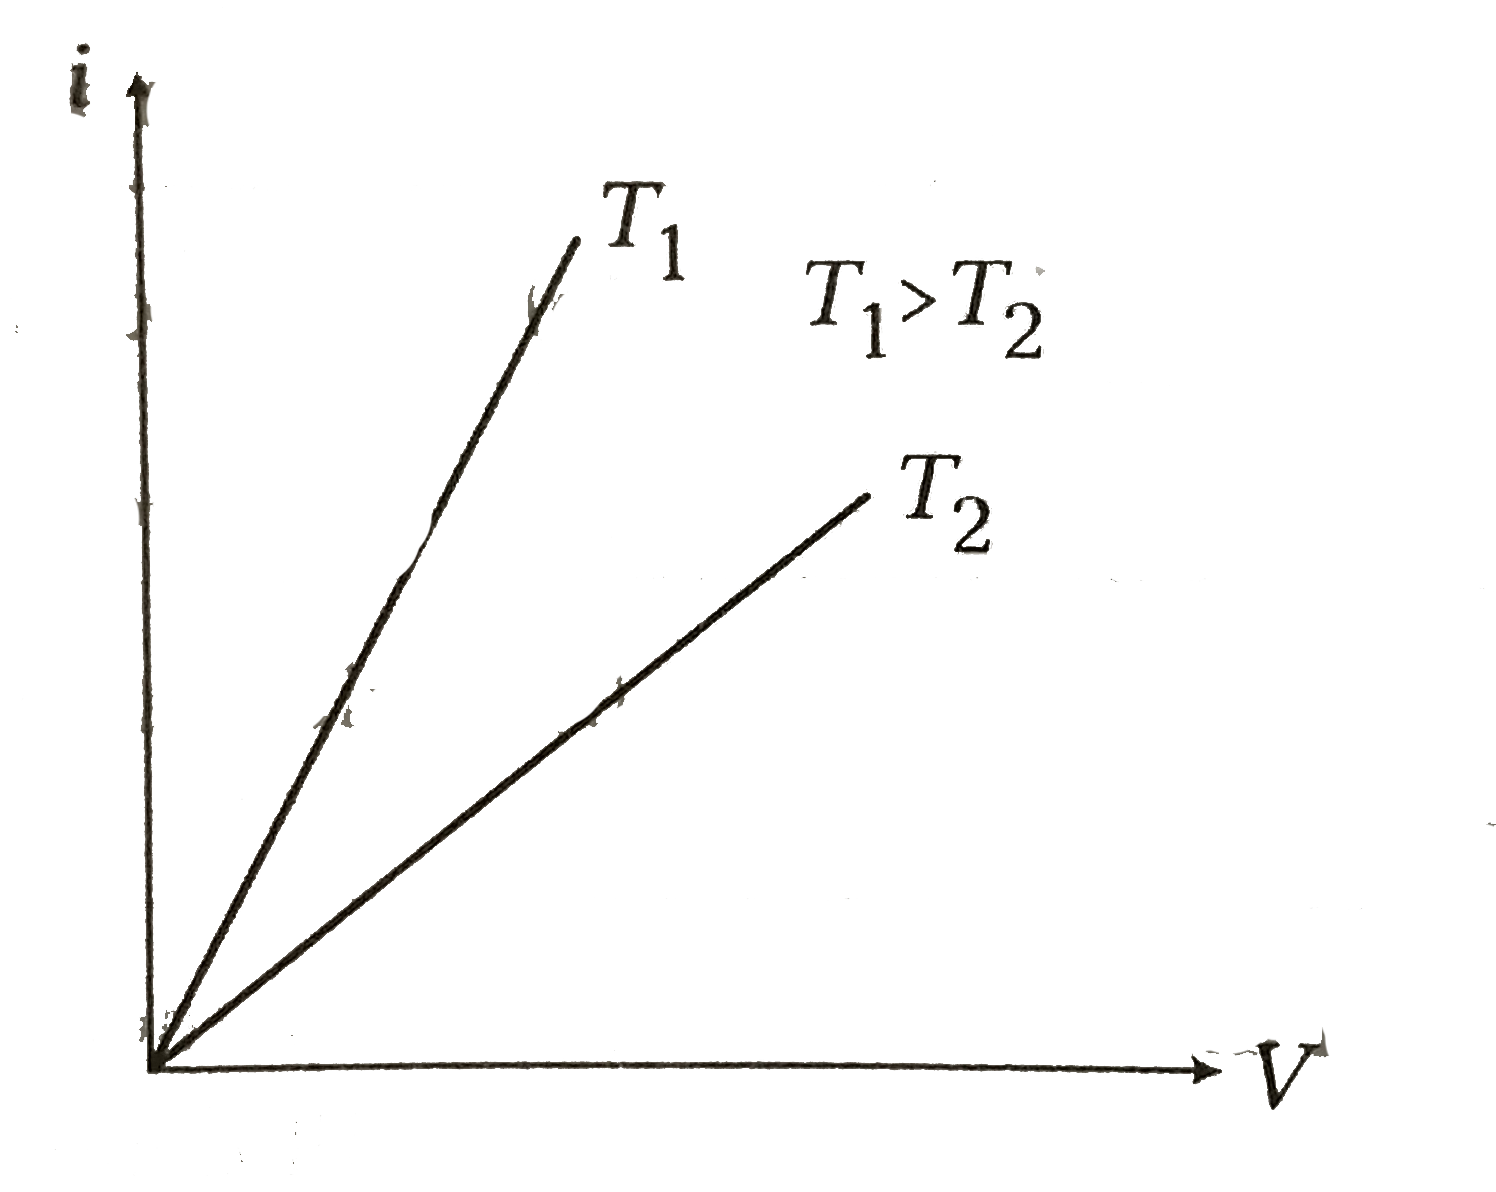
Reason : Resistance of a conductor increases with rise in temperature.03:42View SolutionThe V-l graph for a conductor at temperatures T_(1) " and " T_(2) are as shown in the figure. The term T_(2) -T_(1) is proportional to
01:41View SolutionThe current (I) and voltage (V) graphs for a given metallic wire at two different temperature (T1) and (T2) are shown in fig. It is concluded that
 02:01View Solution
The voltage V and current I v graphs for a conductor at two different temperatures T1andT2 are shown in the figure. The relation between T1andT2 is
 03:16View Solution
चित्र में विभवांतर V और धारा I के बीच किसी चालक के दो ताप T1और T2 पर ग्राफ दिखाए गये गये है । T1और T2 में सम्बन्ध होगा -
 02:53View Solution
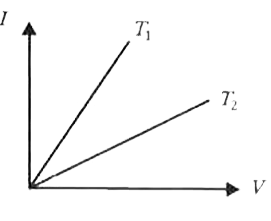
The current-voltage graph for a given metallic conductor at two different temperature T1andT2 are as shown in the figure. Then
 03:28View Solution
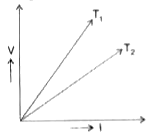
The voltage-current (V-I) graph of a metallic conductor at two different temperatures T1 and T2 is shown below. At which temperature is the resistance higher ?
 01:56View Solution
The voltage V and current I v graphs for a conductor at two different temperatures T1andT2 are shown in the figure. The relation between T1andT2 is
 01:53View Solution
The V - i graph for a conductor at temperature T_(1) and T_(2) are as shown in the figure. ( T_(2) - T_(1)) is proportional to
View SolutionV - I graph of a conductor at temperature T_(1) and T_(2) are shown in the figure (T_(2)-T_(1)) is proportional to
01:38View Solution
