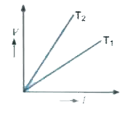
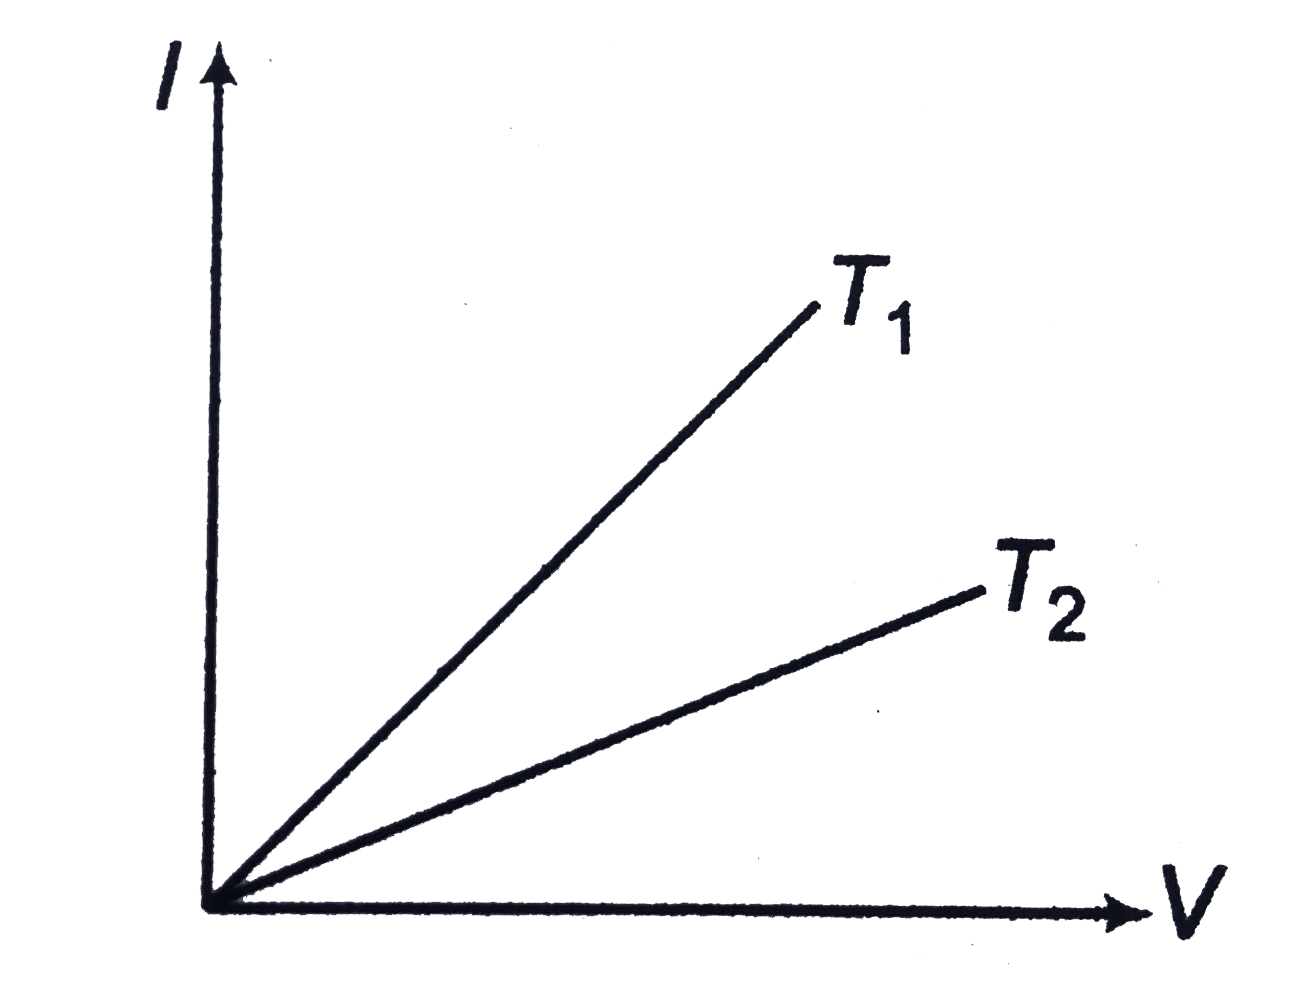
V- I graph for a metallic wire at two different temperature T1 and T2 is shown in figure. Which of the two temperature is higher and why?
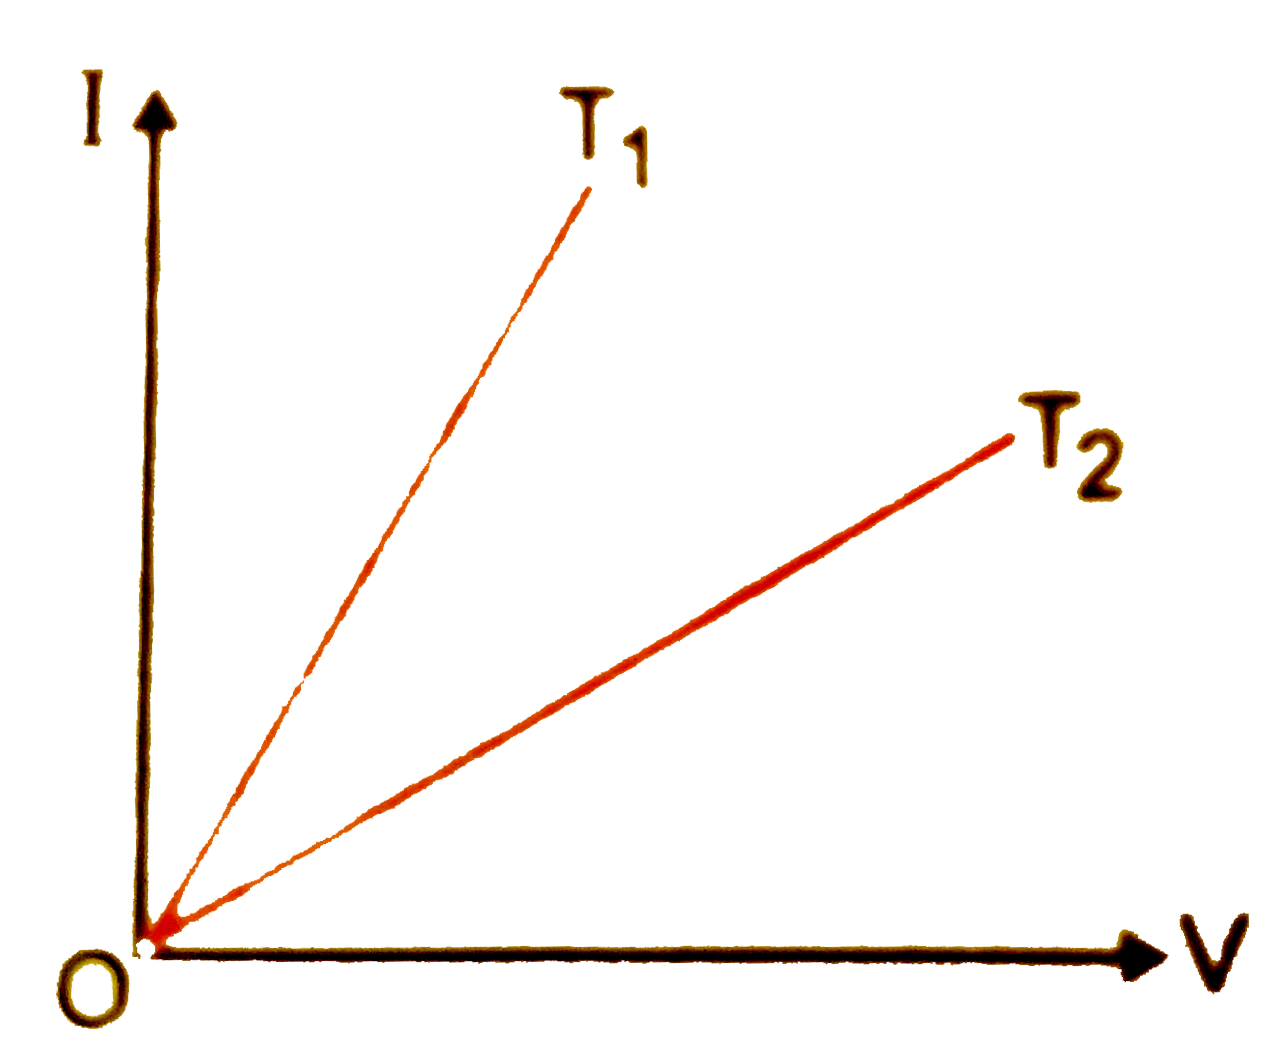
We know that resistance, R=Vl
From figure, for given V, I1>I2 , therefore, R1<R2. As R∝T1 so T1<T2 i.e., T2 is greater than T1 .
Topper's Solved these Questions
- CURRENT ELECTRICITYBook:PRADEEPChapter:CURRENT ELECTRICITYExercise:Conceptual Problems
Explore 3 Videos
- CURRENT ELECTRICITYBook:PRADEEPChapter:CURRENT ELECTRICITYExercise:Very short Q/A
Explore 7 Videos
- COMMUNICATION SYSTEMSBook:PRADEEPChapter:COMMUNICATION SYSTEMSExercise:MODEL TEST PAPER-2
Explore 9 Videos
- DUAL NATURE OF RADIATION AND MATTERBook:PRADEEPChapter:DUAL NATURE OF RADIATION AND MATTERExercise:Exercise
Explore 191 Videos
Similar Questions
I-V graph for a metallie wire at two different tempearture, T1andT2 is as shown in the figure. Which of the two temperatures is lower and why ?

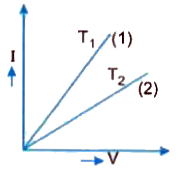
View SolutionI-V graph for a given metallic wire at two temperatures T1 and T2 is as shown in Fig. Which of the two temperatures is lower and why?
View Solution
Knowledge Check
The current (I) and voltage (V) graphs for a given metallic wire at two different temperature (T1) and (T2) are shown in fig. It is concluded that
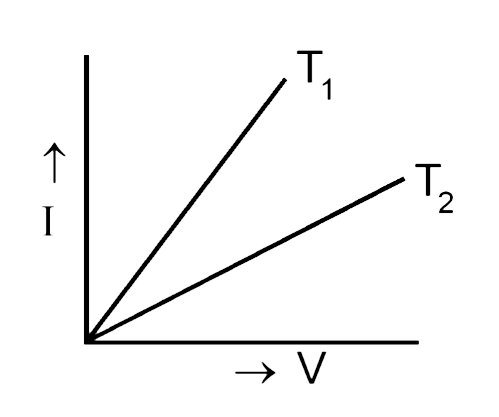 AT1=T2BT1>T2CT1<T2DNone of these
The current (I) and voltage (V) graphs for a given metallic wire at two different temperature (T1) and (T2) are shown in fig. It is concluded that
 AT1>T2BT1<T2CT1=T2DT1=2T2
The current I and voltage V variations for a given metallic wire at tow different temperature T1andT2 are shown in the figure. Then which one of the following is correct
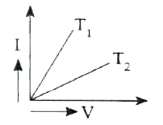 AT1>T2BT1<T2CT1=T2DT1=2T2
The voltage-current (V-I) graph of a metallic conductor at two different temperature T1 and T2 is shown in figure. At which temperature is the resistance higher?
View SolutionThe current - voltage graphs for a given metallic wire at two different temperatures T1andT2 are shown in the figure.
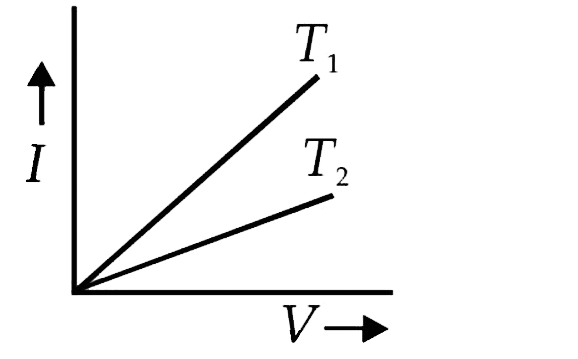
The temperature T2 is greater than T1.
View SolutionThe current-coltage graphs for a given metallic wire at two differenct tempeature T1 and T2 are shown in the figure. Which one is higher, T1 or T2
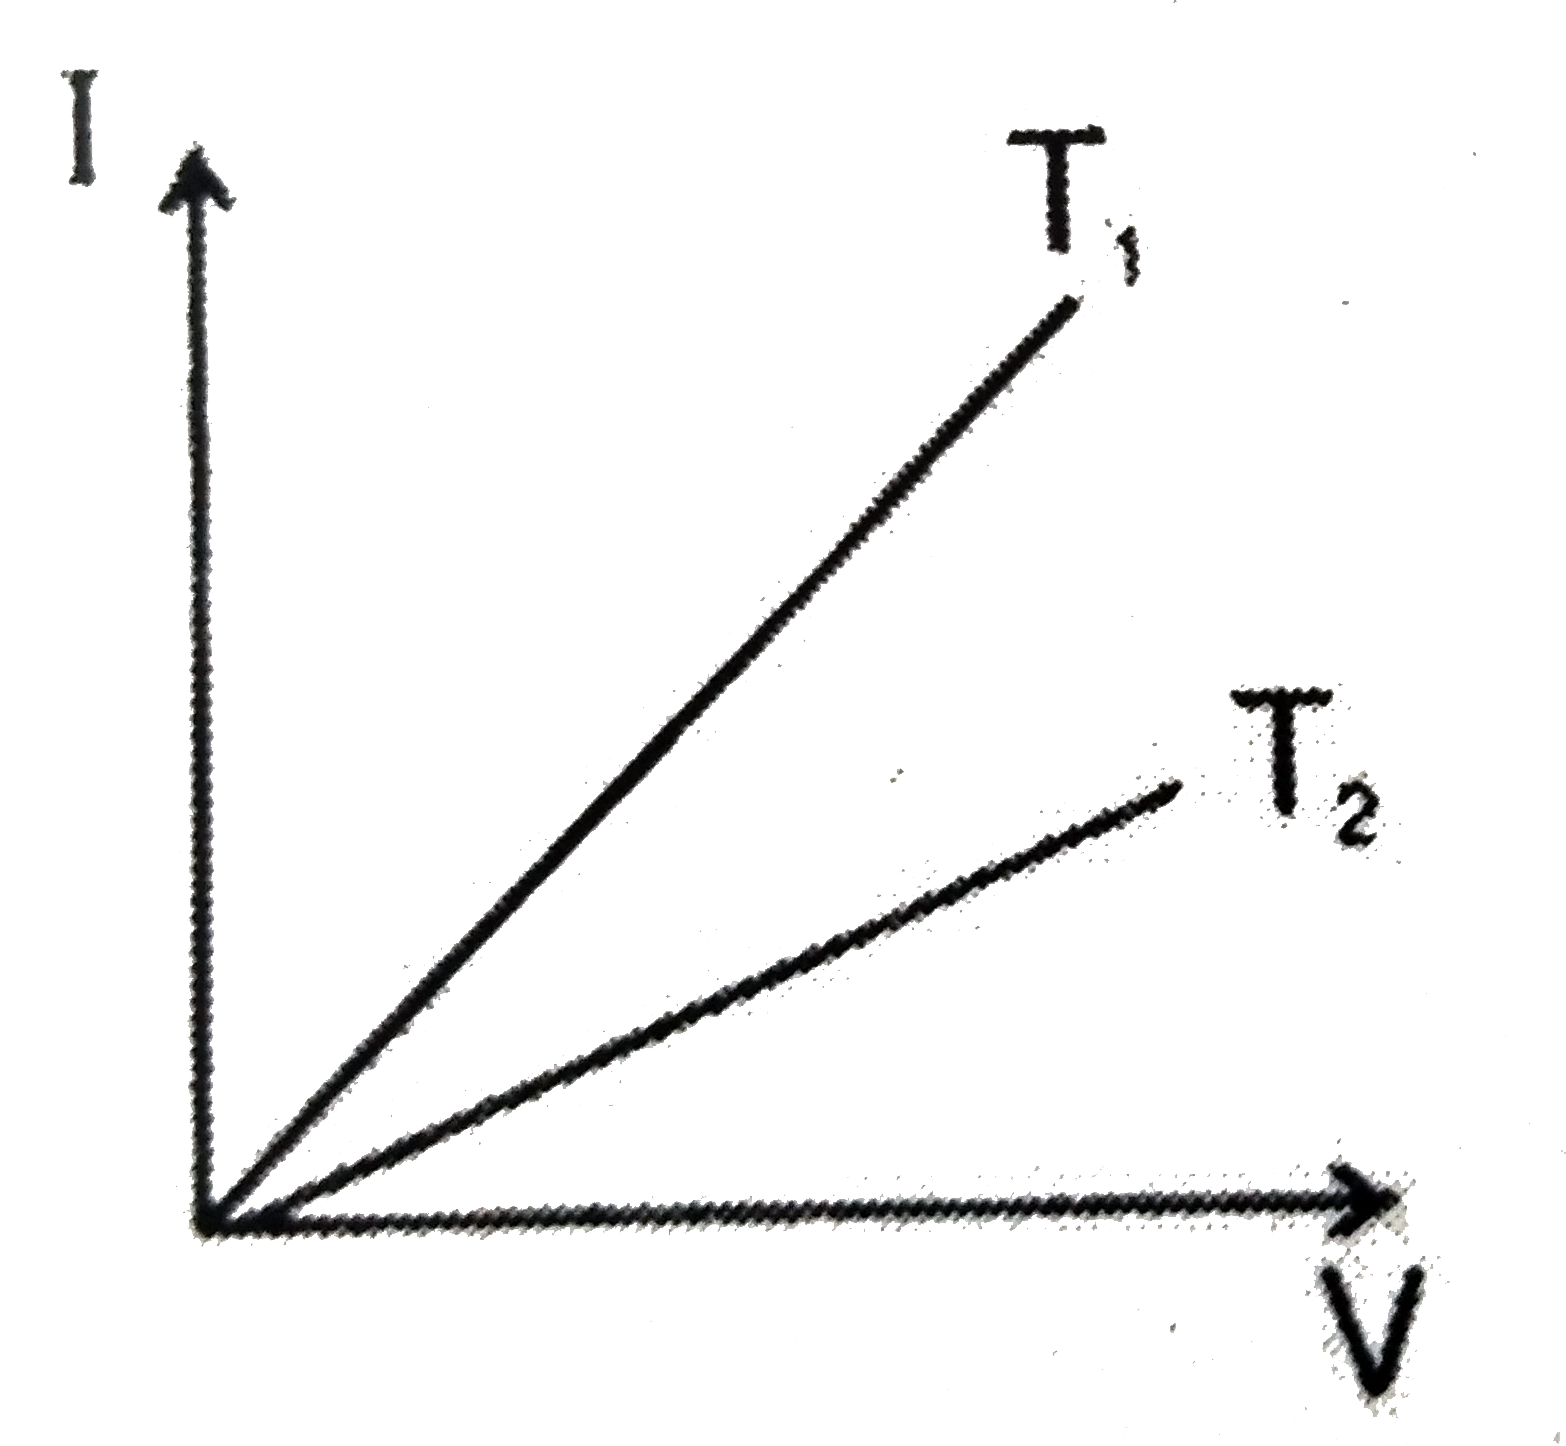
View SolutionThe current voltage graphs for a given metalic wire two different temperature T1 and T2 are shown in figure The temperature T2 is greater than T1. Is this statement true or false?
View SolutionThe stress-strain graph for a metallic wire is shown at two different temperature, T1 and T2 which temperature is high T1 or T2 ?
View Solution

