The stress-strain graph for a metallic wire is shown at two different temperature, T1 and T2 which temperature is high T1 or T2 ?
To determine which temperature is higher between T1 and T2 based on the stress-strain graph, we can follow these steps:
Step 1: Understand the Stress-Strain Graph
The stress-strain graph typically shows stress on the y-axis and strain on the x-axis. However, in this case, the axes are reversed, with stress on the x-axis and strain on the y-axis.
Step 2: Identify Young's Modulus
Young's modulus (E) is a measure of the stiffness of a material and is defined as the ratio of stress to strain. It can be calculated from the slope of the stress-strain curve. A steeper slope indicates a higher Young's modulus, meaning the material is stiffer.
Step 3: Compare the Slopes
From the graph, observe the slopes for the two temperatures:
- The slope of the graph at T1 (let's denote it as E1)
- The slope of the graph at T2 (let's denote it as E2)
Step 4: Analyze the Relationship with Temperature
It is known that Young's modulus is inversely proportional to temperature. This means that as the temperature increases, the Young's modulus decreases. Therefore:
- If E1<E2, it indicates that T1 is lower than T2.
- Conversely, if E1>E2, then T1 is higher than T2.
Step 5: Conclusion
Based on the comparison of the slopes:
- If the slope corresponding to T1 is less than that of T2, we conclude that T1<T2, meaning T2 is the higher temperature.
Thus, the final answer is:
Temperature T2 is higher than temperature T1.
---
The stress-strain graph typically shows stress on the y-axis and strain on the x-axis. However, in this case, the axes are reversed, with stress on the x-axis and strain on the y-axis.
Young's modulus (E) is a measure of the stiffness of a material and is defined as the ratio of stress to strain. It can be calculated from the slope of the stress-strain curve. A steeper slope indicates a higher Young's modulus, meaning the material is stiffer.
From the graph, observe the slopes for the two temperatures:
- The slope of the graph at T1 (let's denote it as E1)
- The slope of the graph at T2 (let's denote it as E2)
It is known that Young's modulus is inversely proportional to temperature. This means that as the temperature increases, the Young's modulus decreases. Therefore:
- If E1<E2, it indicates that T1 is lower than T2.
- Conversely, if E1>E2, then T1 is higher than T2.
Based on the comparison of the slopes:
- If the slope corresponding to T1 is less than that of T2, we conclude that T1<T2, meaning T2 is the higher temperature.
Temperature T2 is higher than temperature T1.
Topper's Solved these Questions
- ELASTICITYBOOK - DC PANDEYCHAPTER - ELASTICITYEXERCISE - Check point 12.1
15 Videos
- ELASTICITYBOOK - DC PANDEYCHAPTER - ELASTICITYEXERCISE - Check point 12.2
15 Videos
- ELASTICITYBOOK - DC PANDEYCHAPTER - ELASTICITYEXERCISE - Level 2 Subjective
10 Videos
- CURRENT ELECTRICITYBOOK - DC PANDEYCHAPTER - CURRENT ELECTRICITYEXERCISE - All Questions
434 Videos
- ELECTROSTATICSBOOK - DC PANDEYCHAPTER - ELECTROSTATICSEXERCISE - Integer
17 Videos
Similar Questions
V- I graph for a metallic wire at two different temperature T1 and T2 is shown in figure. Which of the two temperature is higher and why?
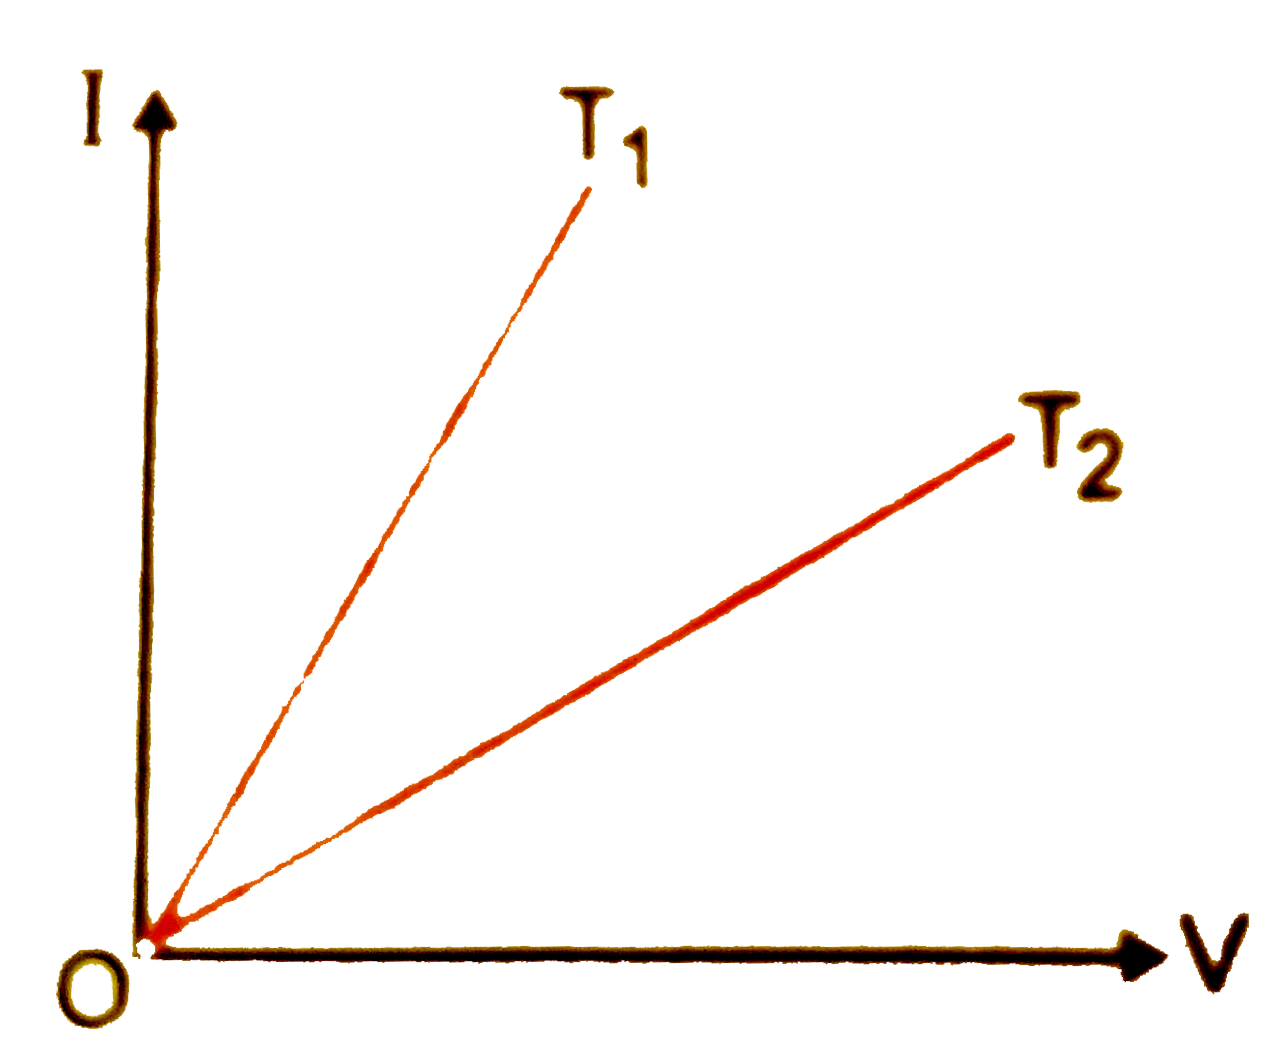
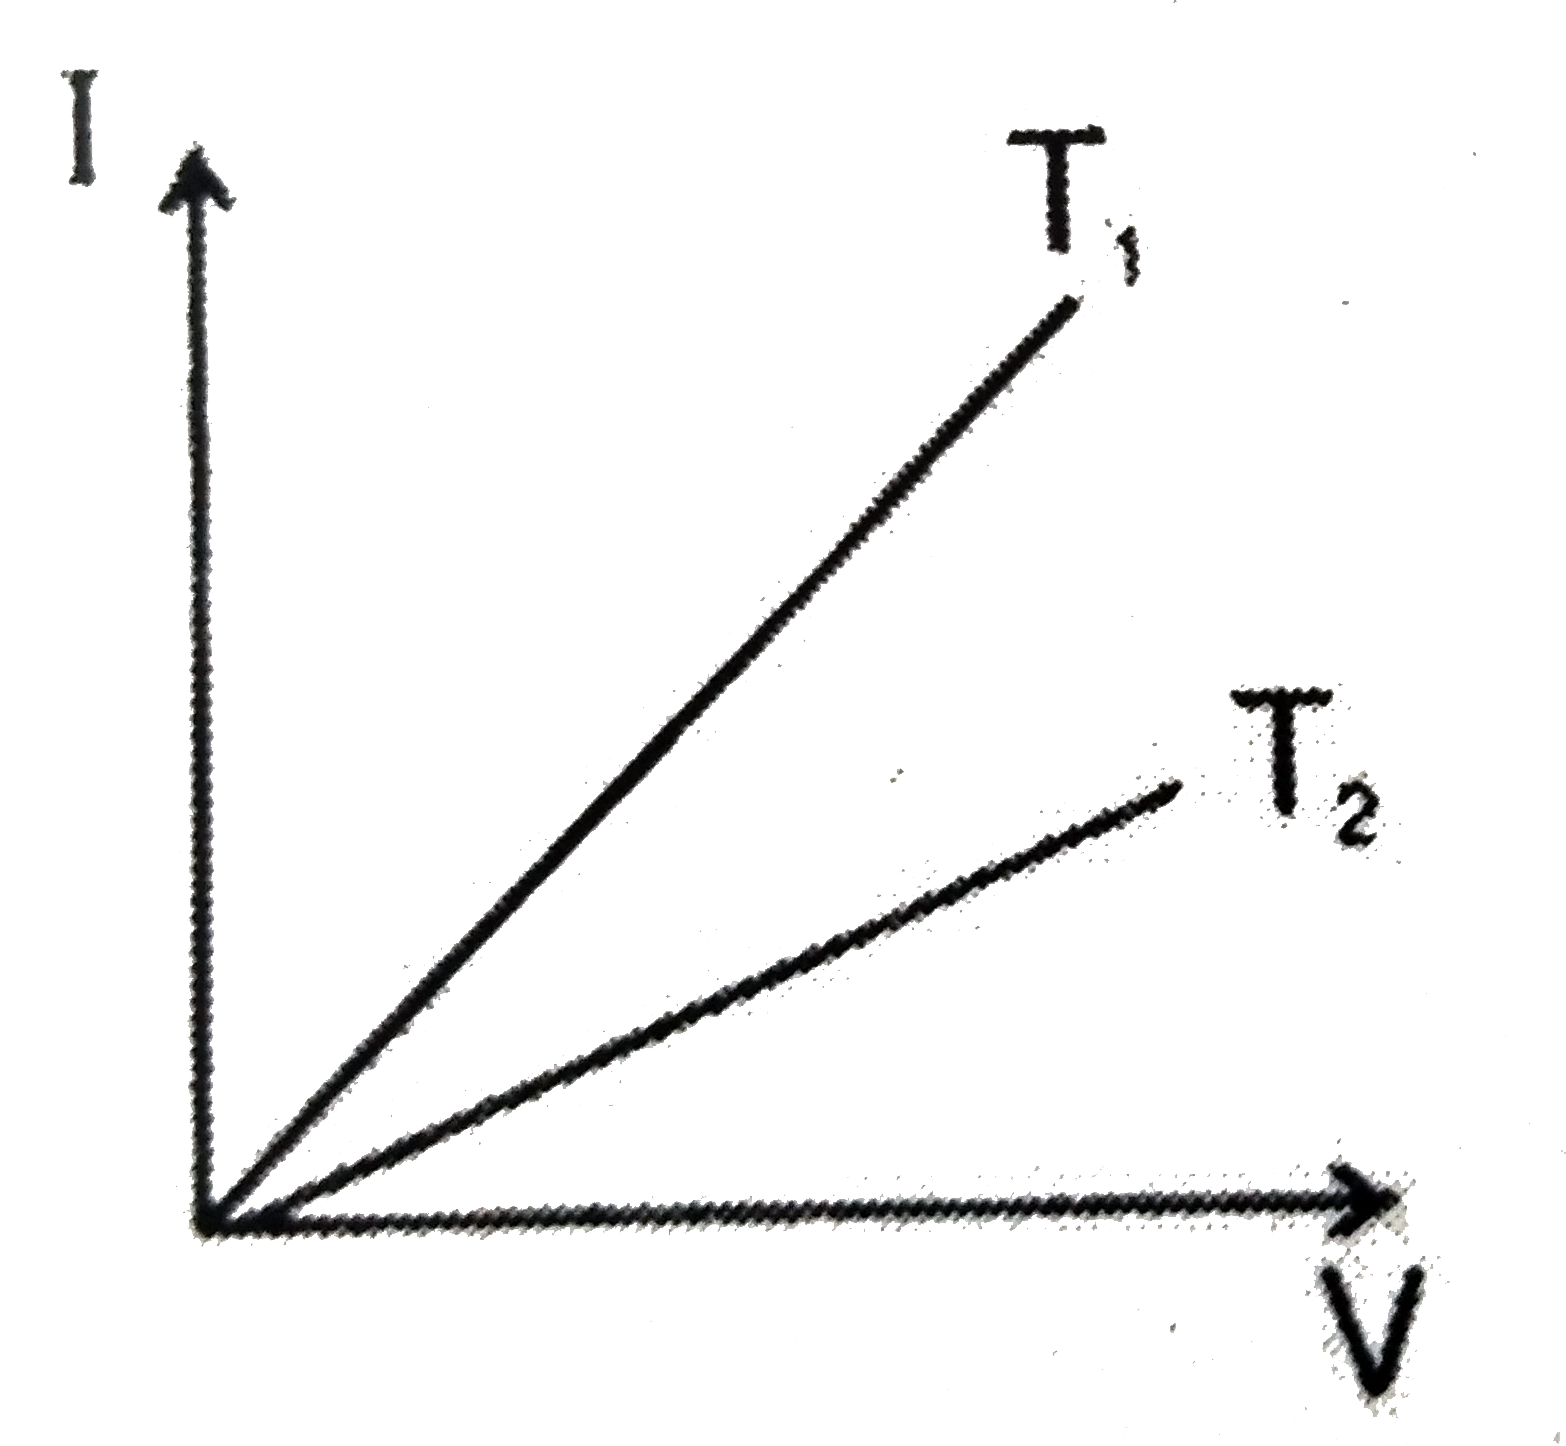
View SolutionThe current-coltage graphs for a given metallic wire at two differenct tempeature T1 and T2 are shown in the figure. Which one is higher, T1 or T2
View Solution
Knowledge Check
The current (I) and voltage (V) graphs for a given metallic wire at two different temperature (T1) and (T2) are shown in fig. It is concluded that
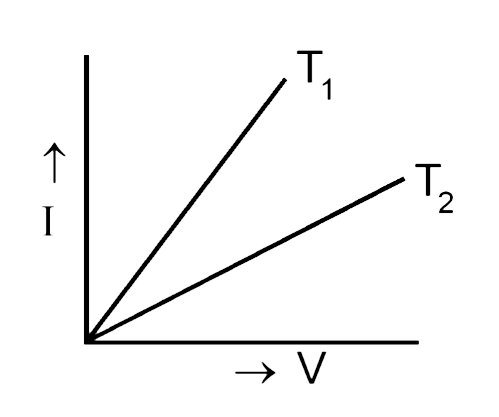 AT1=T2BT1>T2CT1<T2DNone of these
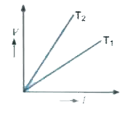
The voltage-current (V-I) graph of a metallic conductor at two different temperature T1 and T2 is shown in figure. At which temperature is the resistance higher?
View SolutionThe current - voltage graphs for a given metallic wire at two different temperatures T1andT2 are shown in the figure.
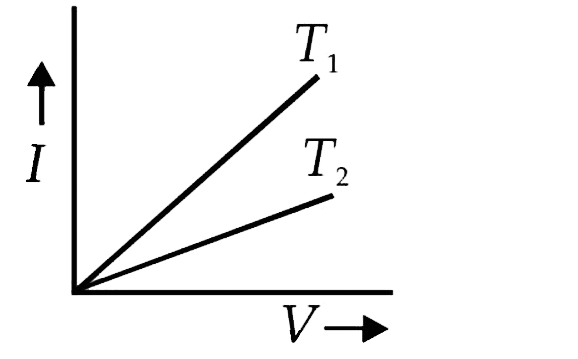
The temperature T2 is greater than T1.
View SolutionThe current voltage graphs for a given metalic wire two different temperature T1 and T2 are shown in figure The temperature T2 is greater than T1. Is this statement true or false?
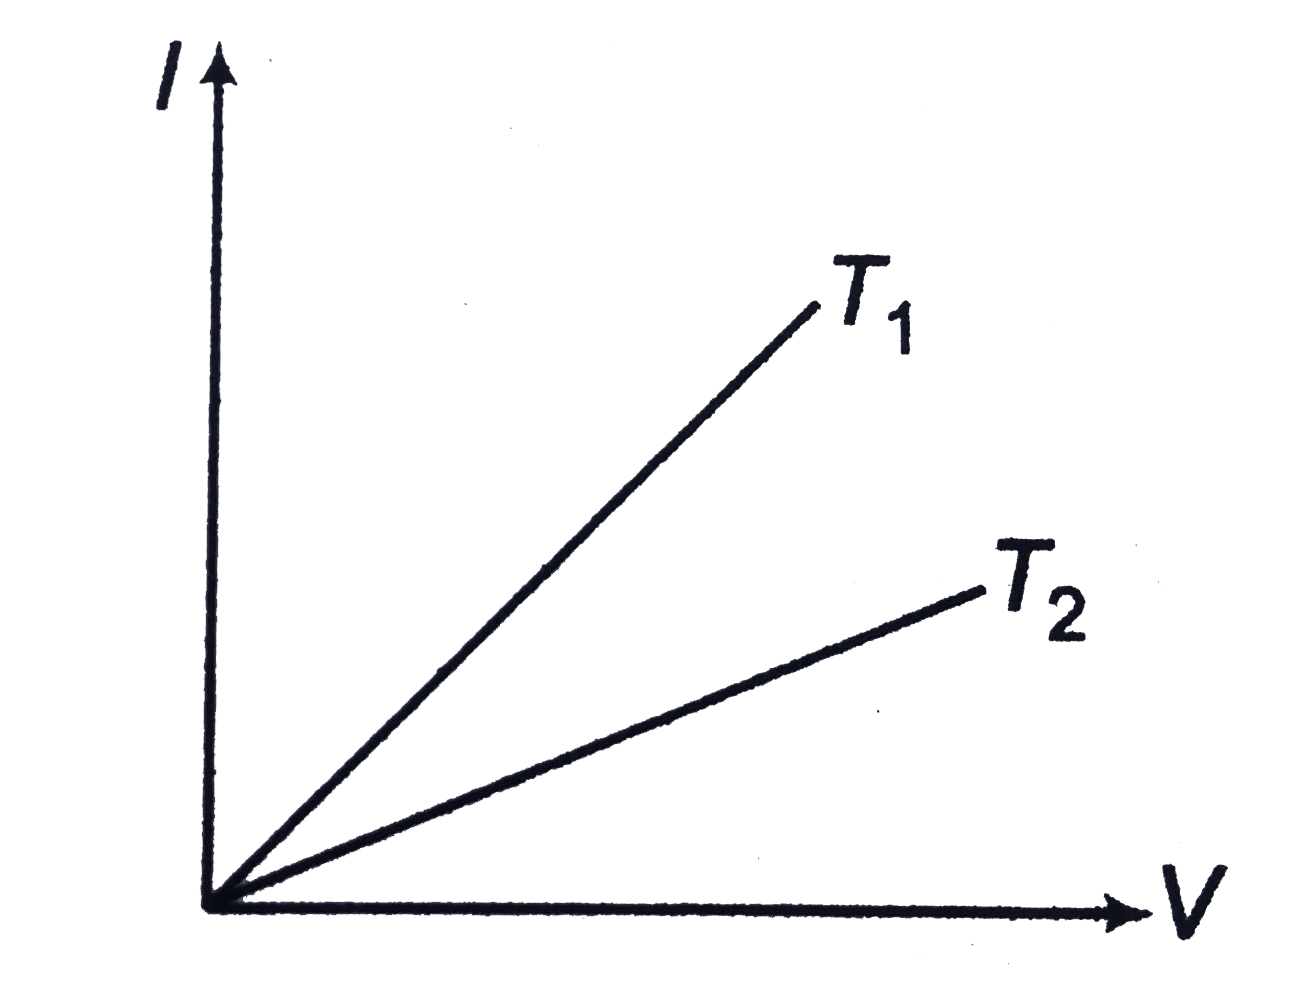
View SolutionI-V graph for a metallie wire at two different tempearture, T1andT2 is as shown in the figure. Which of the two temperatures is lower and why ?

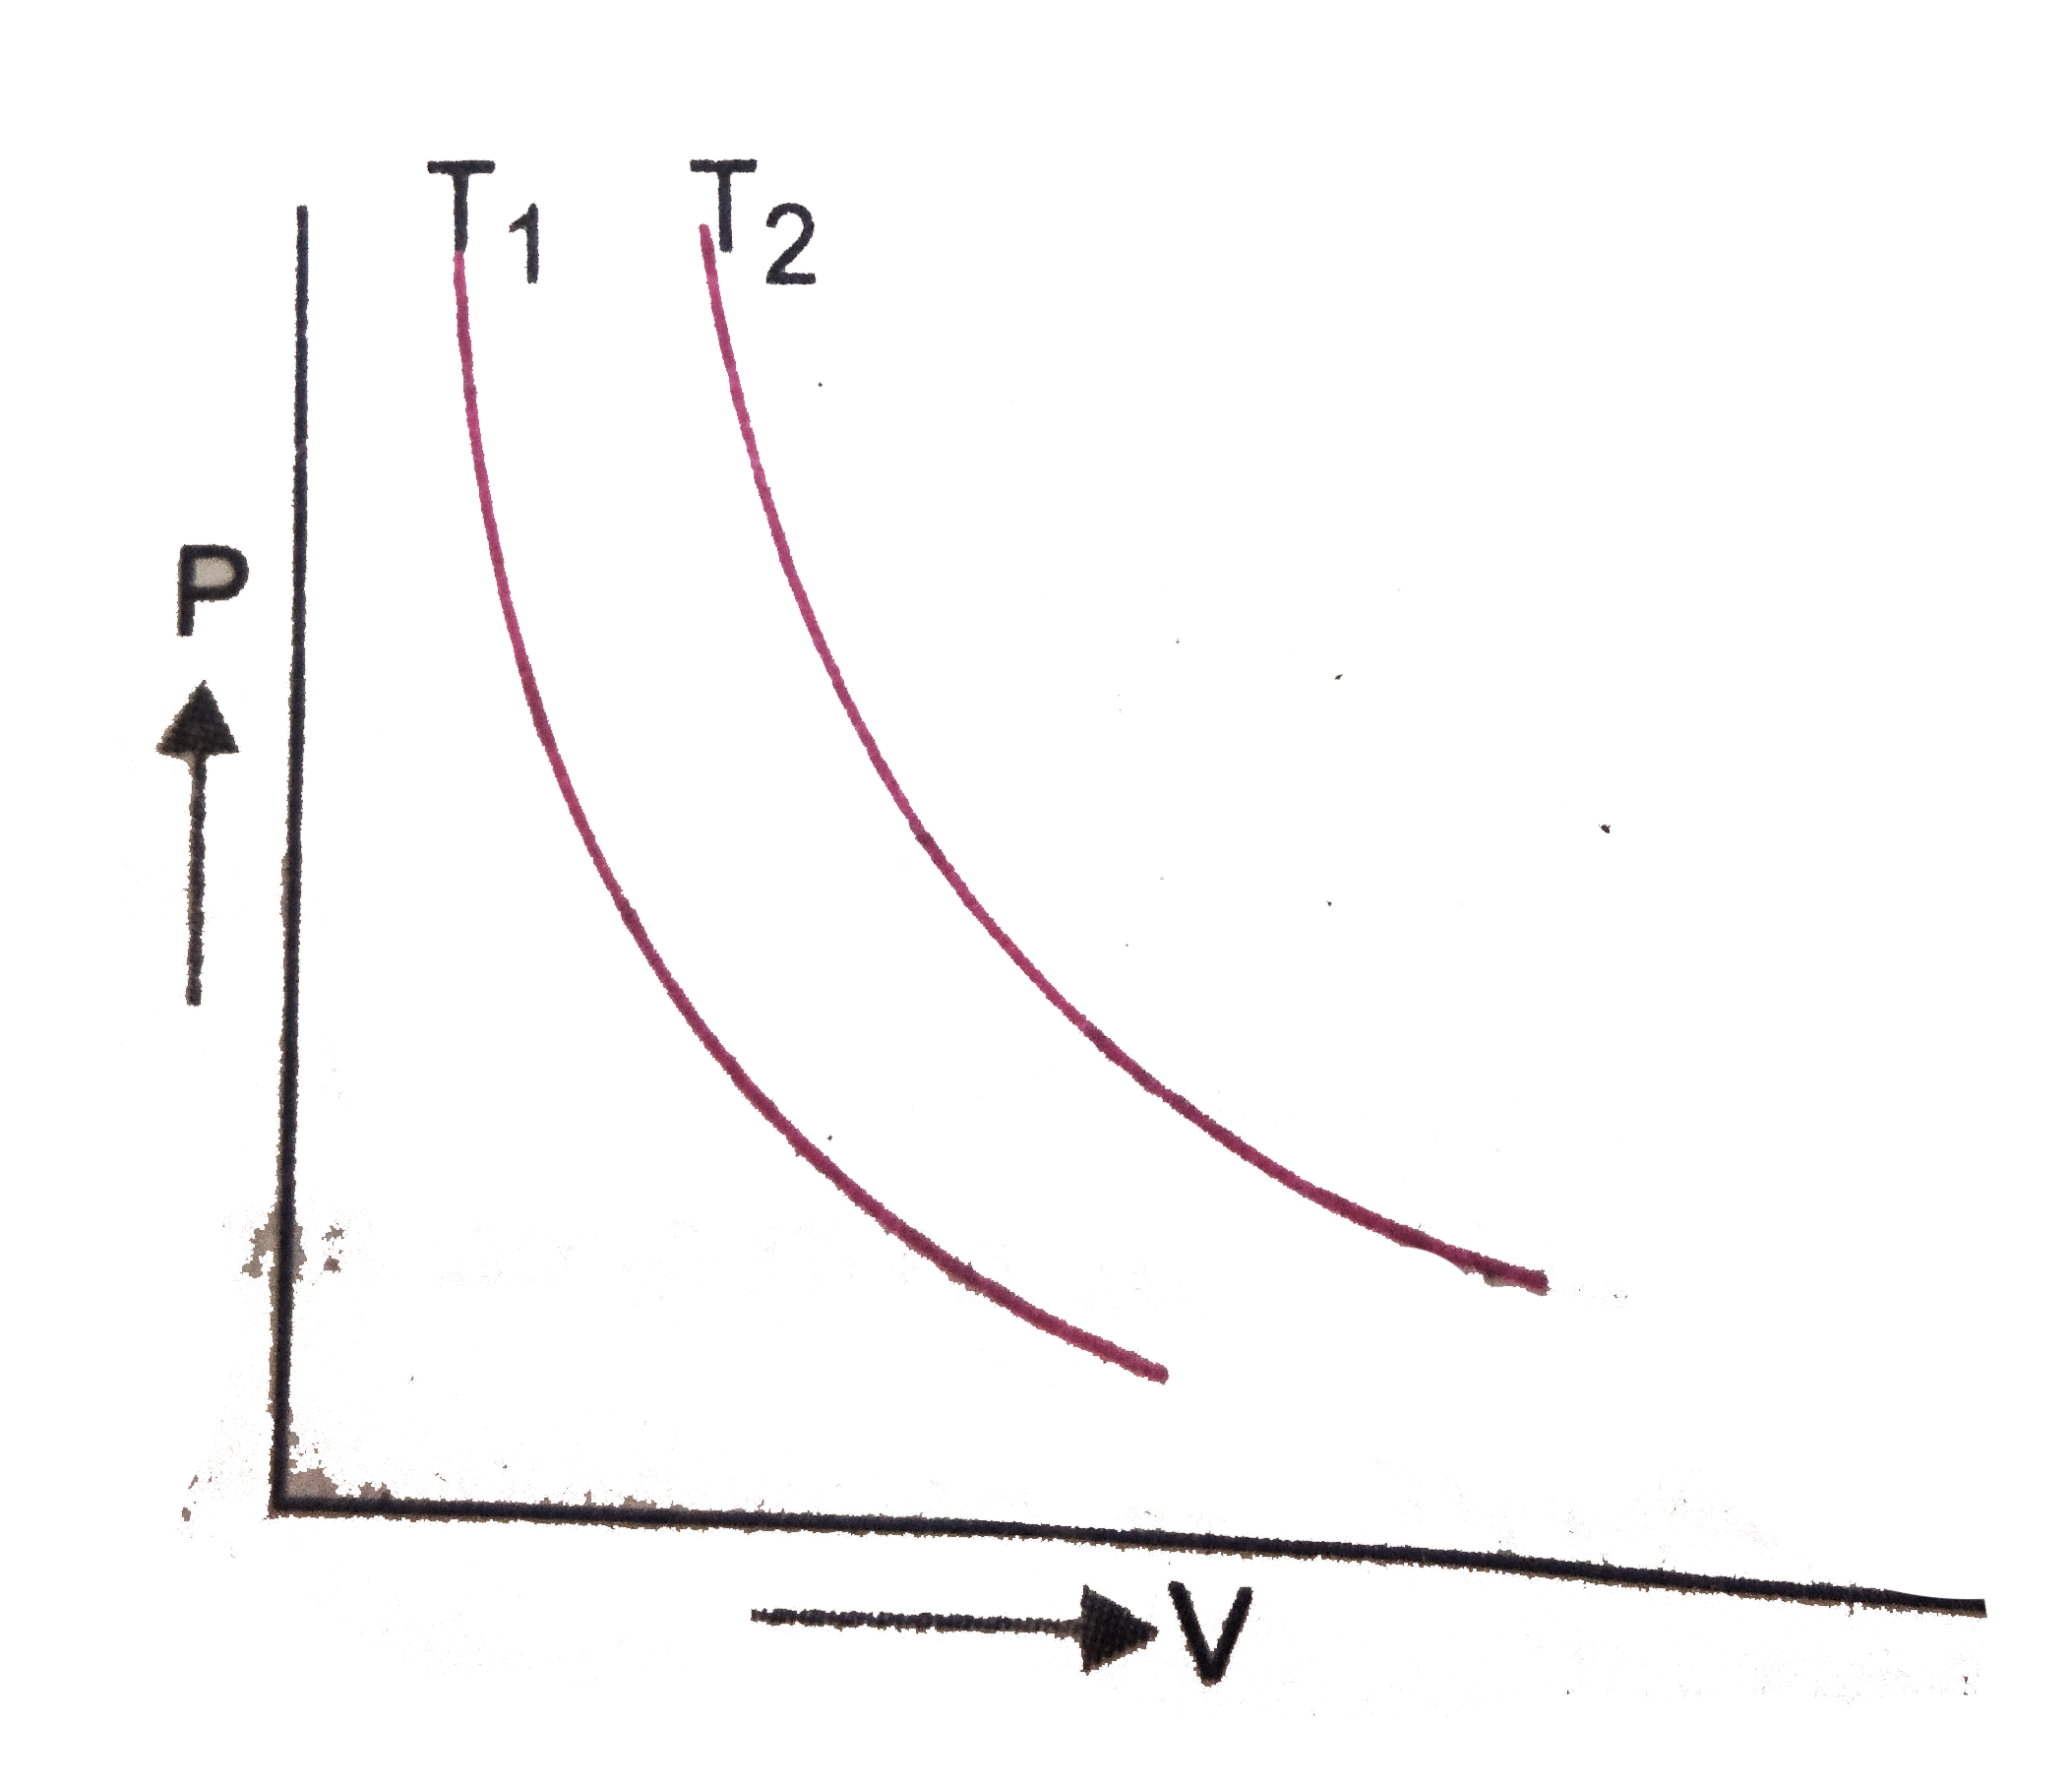
View SolutionIsothermal curves for a given mass of gas are shown at two different temperture T1andT2 in Fig. State whether T1>T2orT2>T1. Justify your answer.
View SolutionThe graph of (xm) vs P at two different temperature T1 and T2 is [where T1>T2]
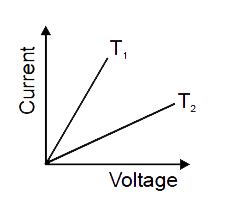
View SolutionThe current in a metllic conductor is plotted against voltage at two different temperatures T1andT2. Which is correct
View Solution
