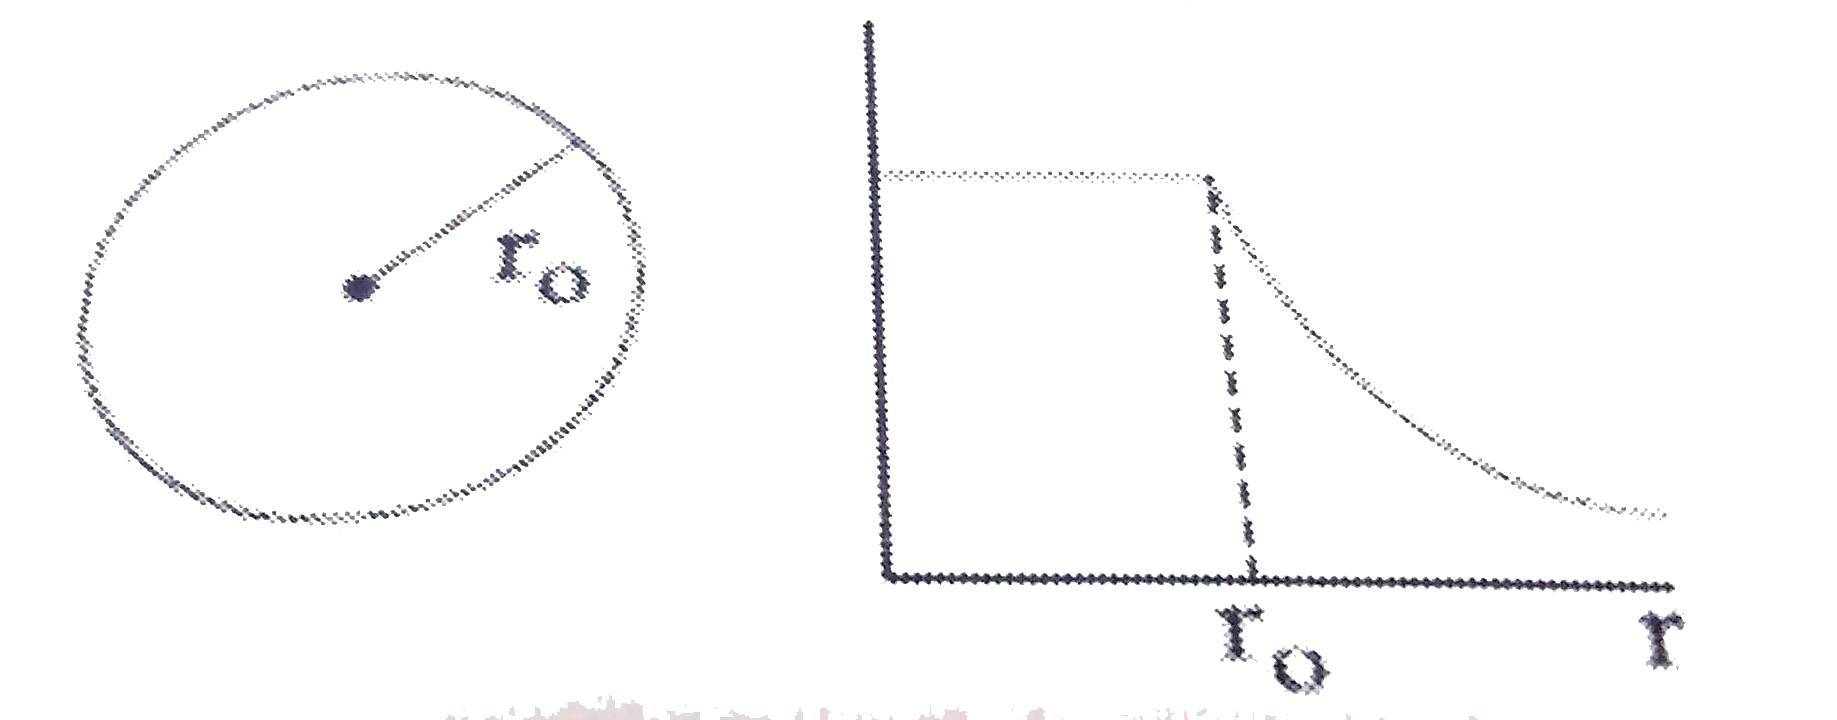
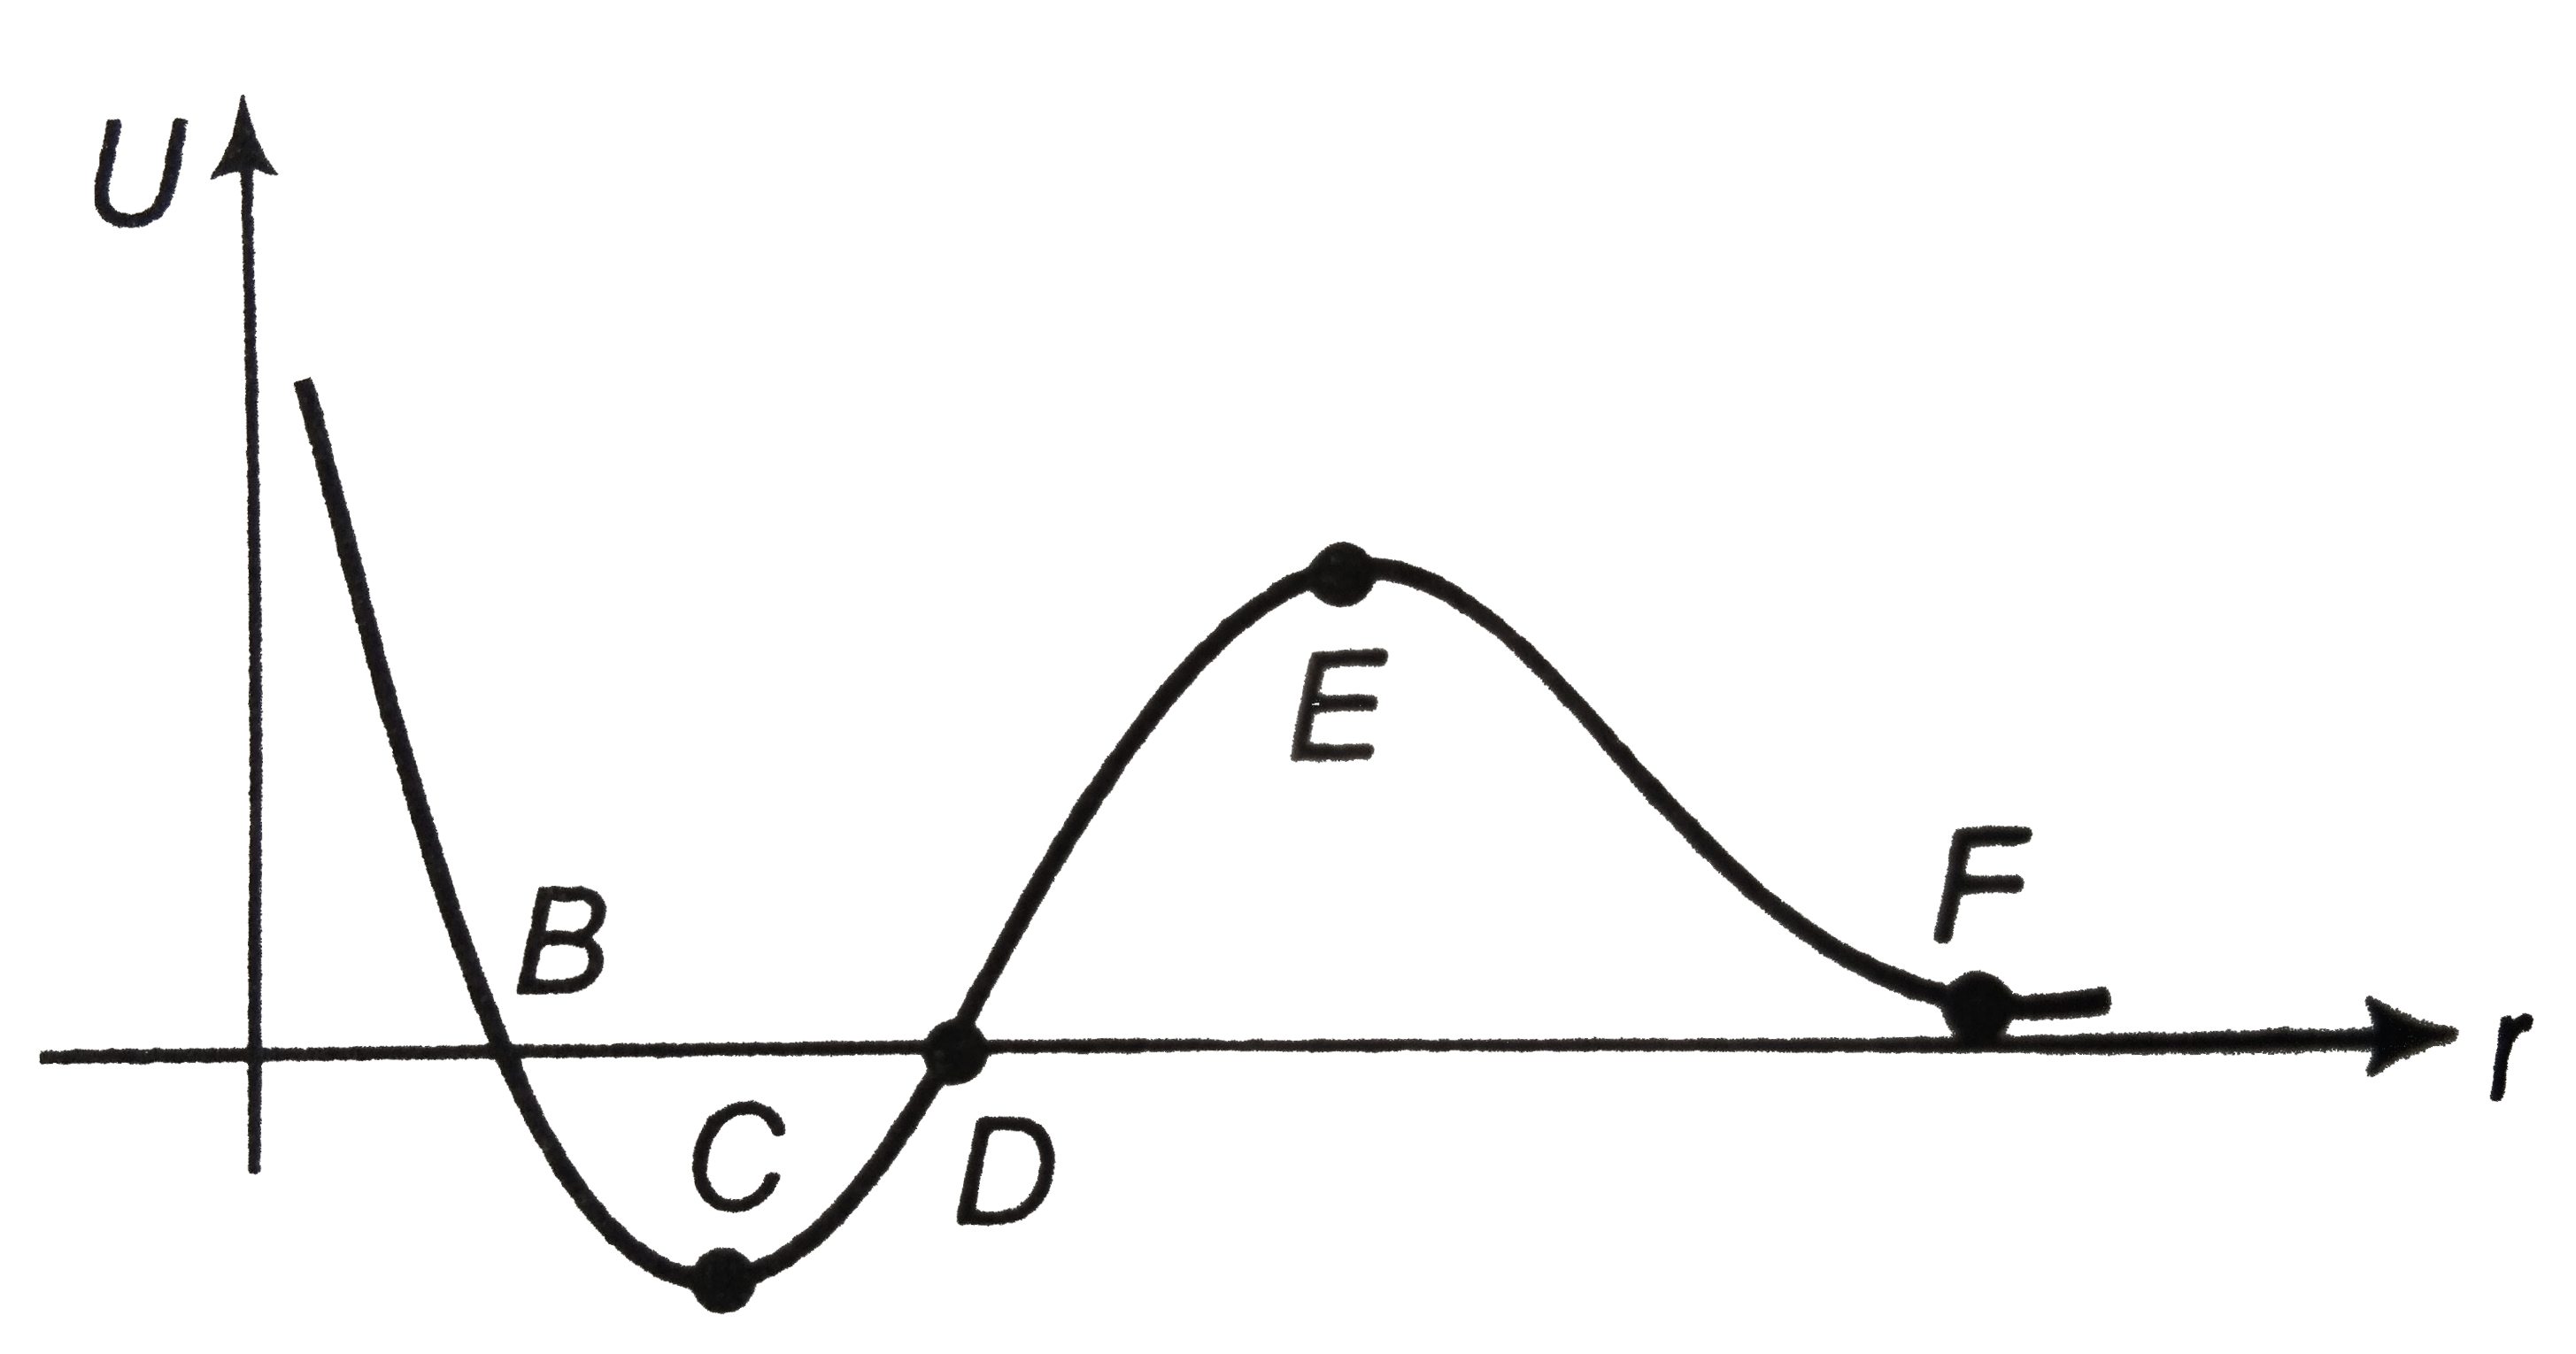
The given plot shows the variation of U, the potential energy of interaction between two particles with the distance separating them r,
(a) 1 and 3
(b) 1 and 4
(c) 2 and 4
(d) 2 and 3
The correct Answer is:C
At point C the potential energy is minimum, hence it is a point of stable equilibrium. Also, from C to A, the slope is negative, i.e.,
dUdr<0
Hence, the force of interaction between the particles is repulsive between points C and A.
Topper's Solved these Questions
- WORK, POWER & ENERGYBook:CENGAGE PHYSICS ENGLISHChapter:WORK, POWER & ENERGYExercise:Multiple Correct
Explore 25 Videos
- WORK, POWER & ENERGYBook:CENGAGE PHYSICS ENGLISHChapter:WORK, POWER & ENERGYExercise:Linked Comprehension
Explore 55 Videos
- WORK, POWER & ENERGYBook:CENGAGE PHYSICS ENGLISHChapter:WORK, POWER & ENERGYExercise:Subjective
Explore 23 Videos
- VECTORSBook:CENGAGE PHYSICS ENGLISHChapter:VECTORSExercise:Exercise Multiple Correct
Explore 5 Videos
Similar Questions
Knowledge Check
Which one of the following plots represents the variation of the gravitational field on a particle with distance r due to a thin spherical shell of raduis R? (r is measured from the centre of the spherical shell).
A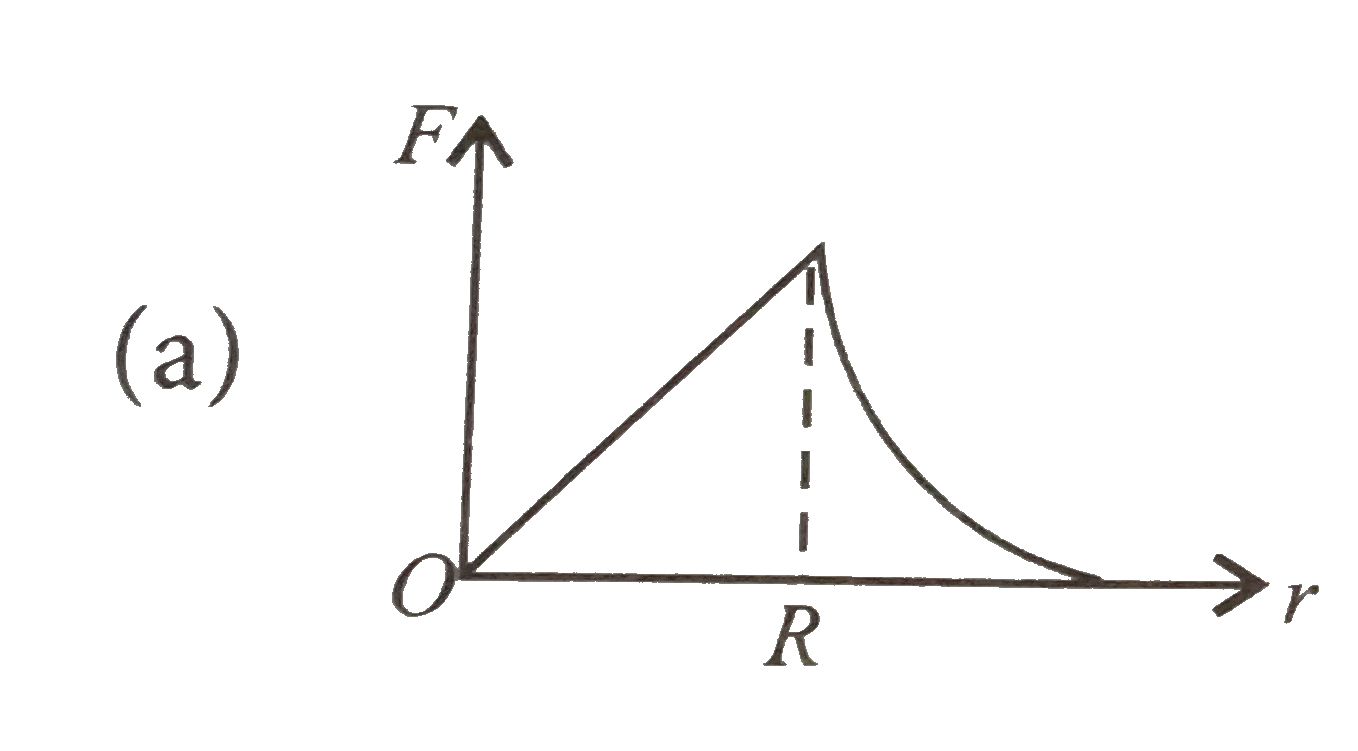 B
B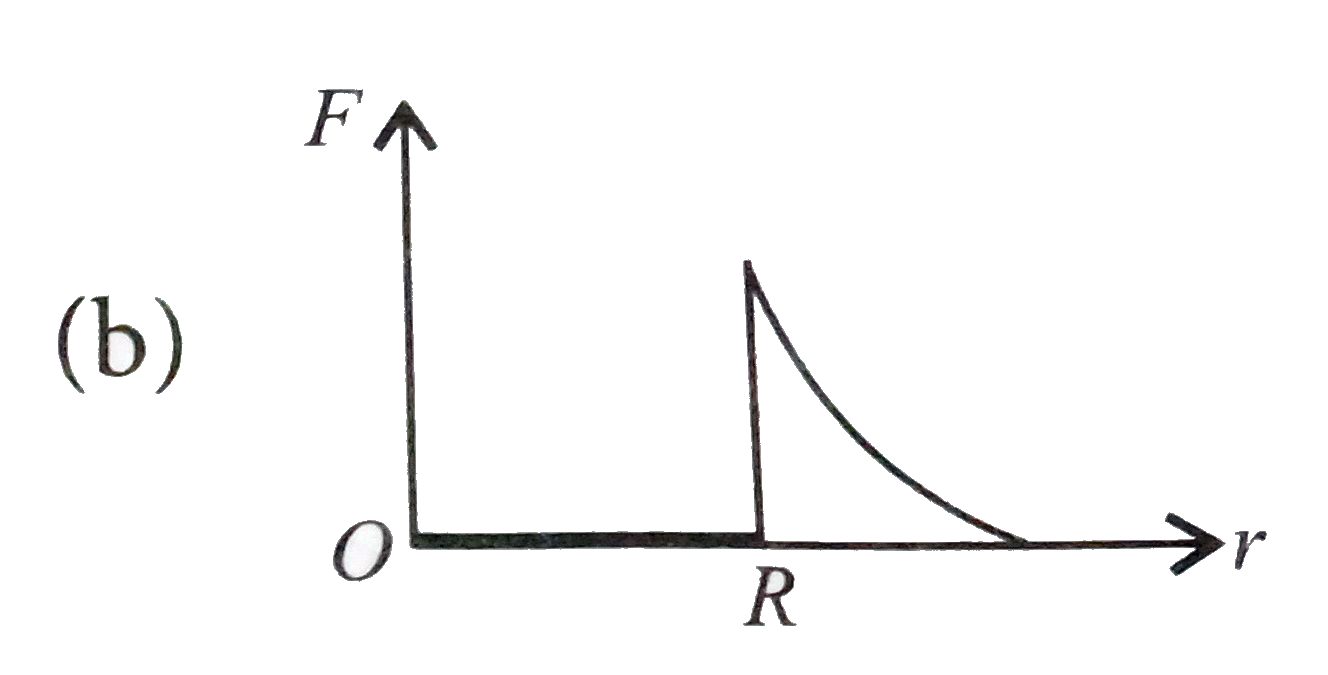 C
C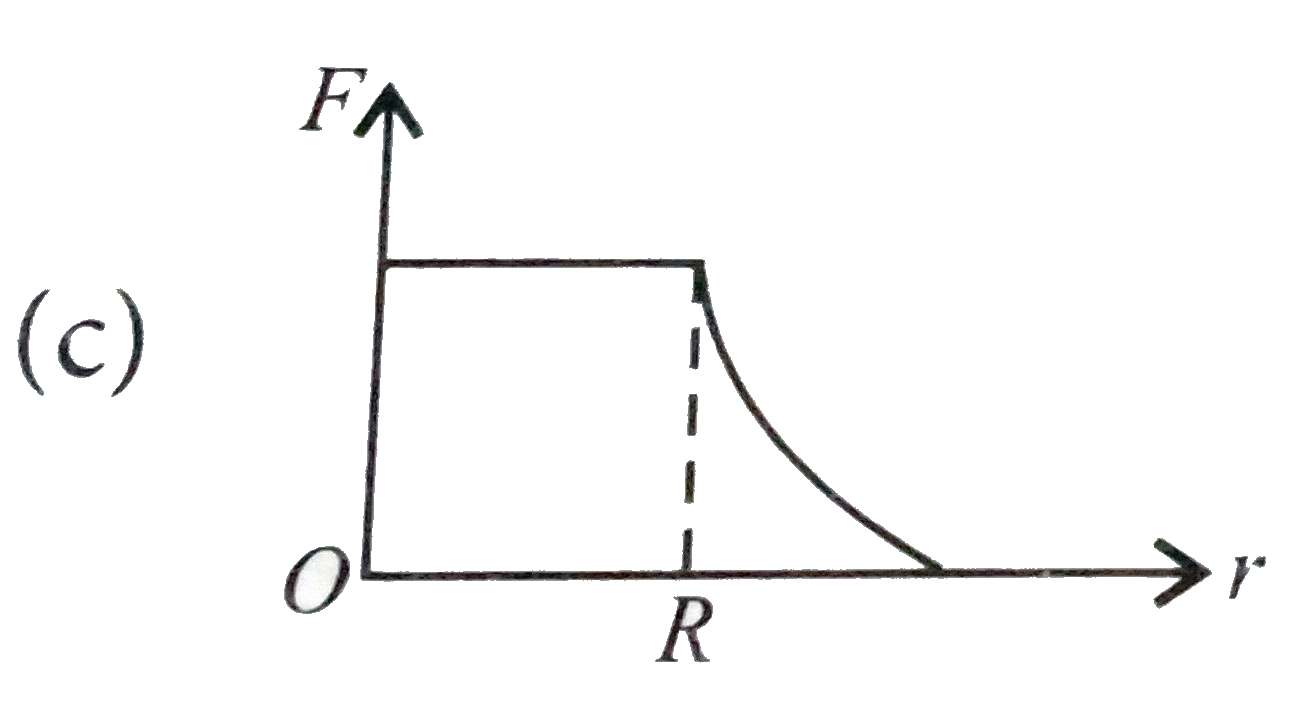 D
D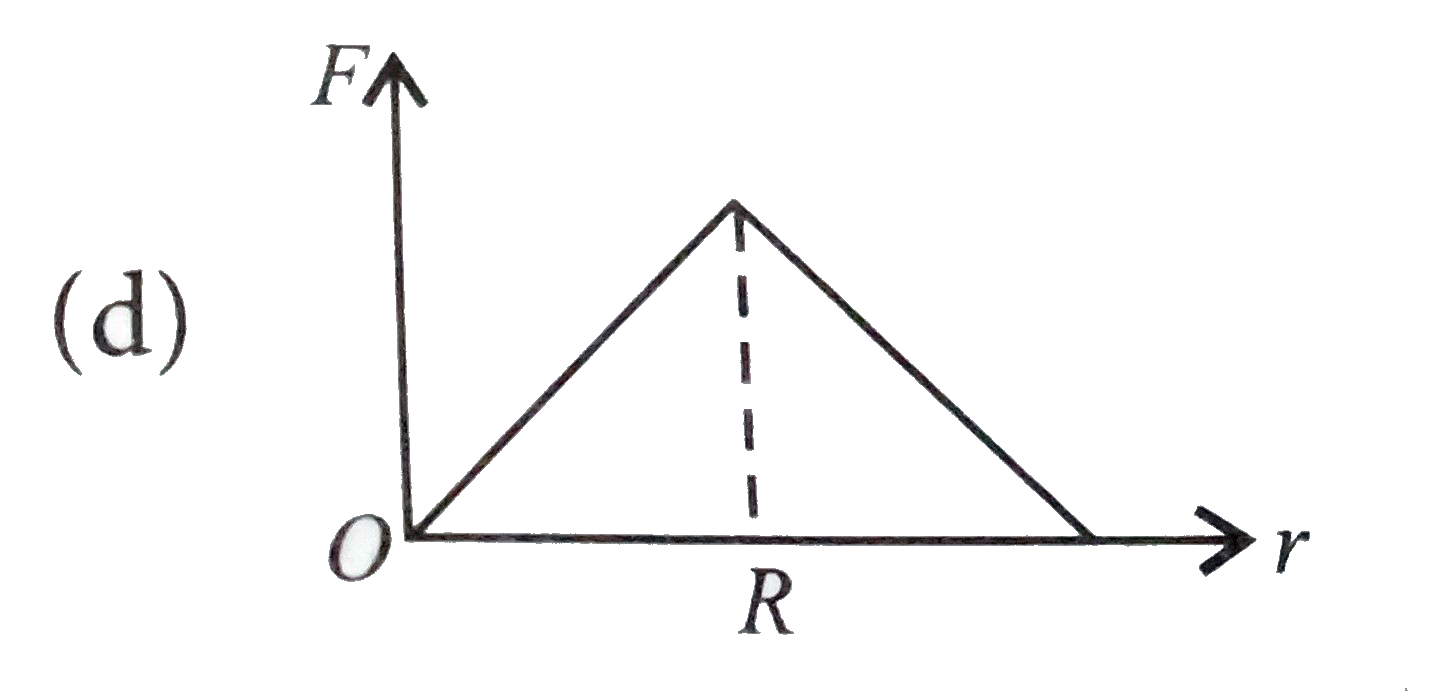
If the distance between two point particles is doubled, then the gravitational force between them
Adecreases by a factor of 4Bdecreases by a factor of 2Cincreases by a factor of 2Dincreases by a factor of 4
The center of mass of a system of two particles divides the distance between them.
View SolutionThe potential energy curve for interaction between two molecules is shown in figure. Which of the following statements are true?
View SolutionThe diagram showing the variation of gravitational potential of earth with distance from the centre of earth is
View SolutionTwo particles of combined mass M, placed in space with certain separation are released interaction between the particles is only of gravitational nature and there is no external force present. Acceleration of one particle with respect to the other when separation between them is R, has a magnitude :
View SolutionThe force between two electrons separated by a distance r varies as
View SolutionThe force between two electrons separated by a distance r is proportional to
View Solution


