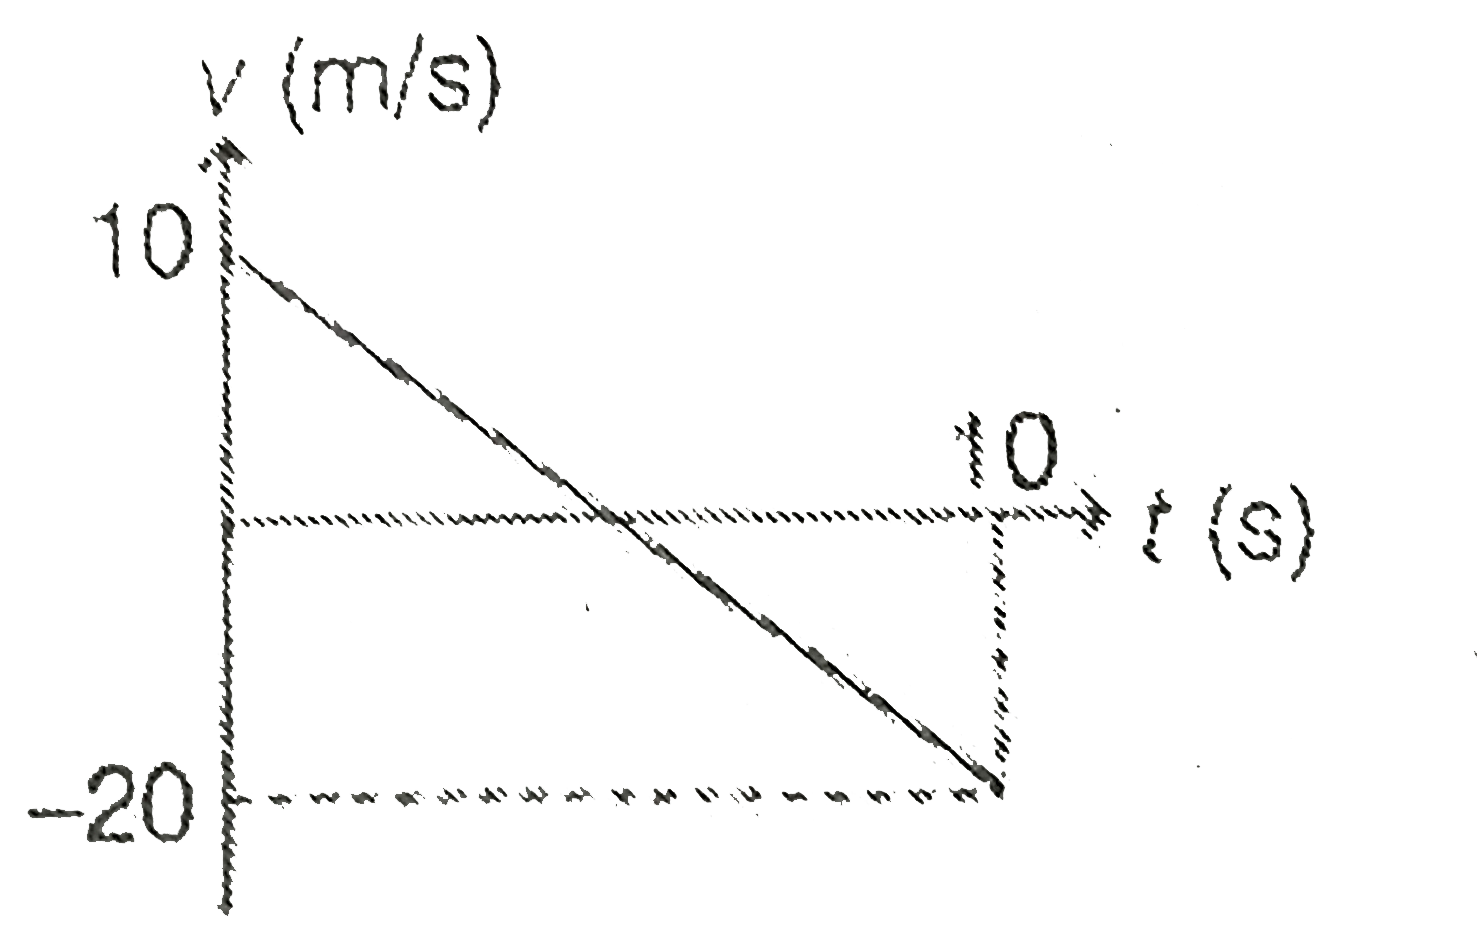
Velocity-time graph of a particle moving in a straight line is as shown in figure. Mass of the particle is 2 kg. Work done by all the forces acting on the particle in time interval between t = 0 to t = 10 s is
(a) 300J
(b) −300J
(c) 400J
(d) −400J
The correct Answer is:A
From work-energy theorem,
W=ΔKE=Kf−Ki=12m(v2f−v2i)
=12×2[(−20)2−(10)2]=300J
Topper's Solved these Questions
- WORK, POWER & ENERGYBOOK - CENGAGE PHYSICS ENGLISHCHAPTER - WORK, POWER & ENERGYEXERCISE - Multiple Correct
25 Videos
- WORK, POWER & ENERGYBOOK - CENGAGE PHYSICS ENGLISHCHAPTER - WORK, POWER & ENERGYEXERCISE - Linked Comprehension
55 Videos
- WORK, POWER & ENERGYBOOK - CENGAGE PHYSICS ENGLISHCHAPTER - WORK, POWER & ENERGYEXERCISE - Subjective
23 Videos
- VECTORSBOOK - CENGAGE PHYSICS ENGLISHCHAPTER - VECTORSEXERCISE - Exercise Multiple Correct
5 Videos
Similar Questions
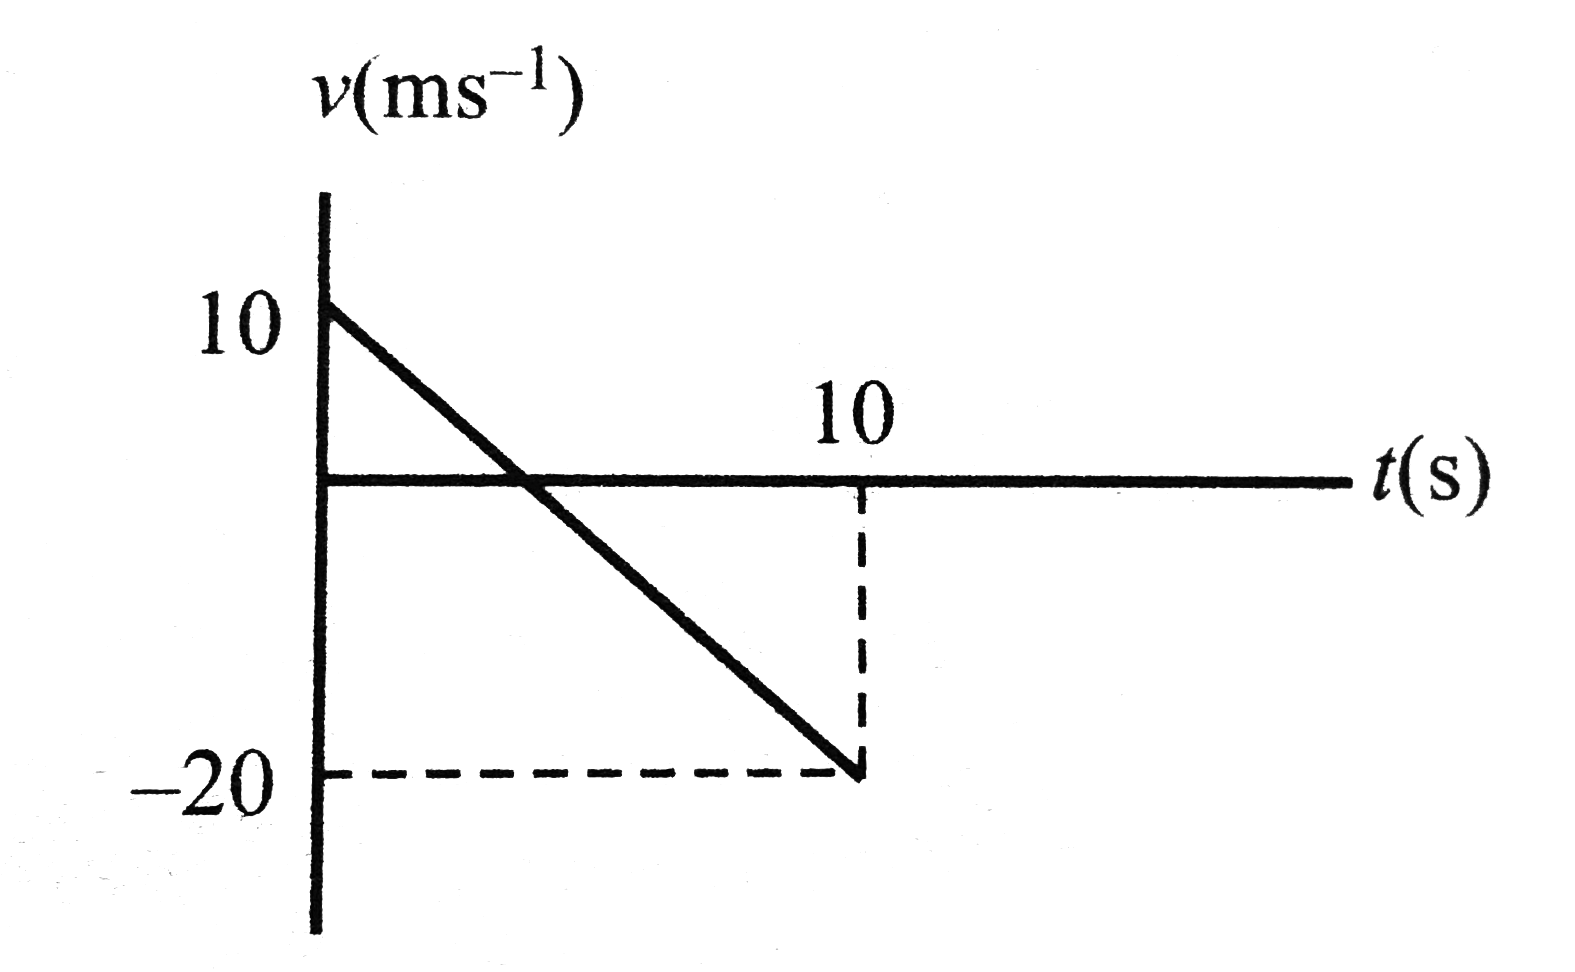
The velocity-time graph of a particle moving in a straight line is shown in figure. The mass of the particle is 2kg. Work done by all the forces acting on the particle in time interval between t=0 to t=10s is
View SolutionDisplacement time graph of a particle moving in a straight line is a shown in figure.

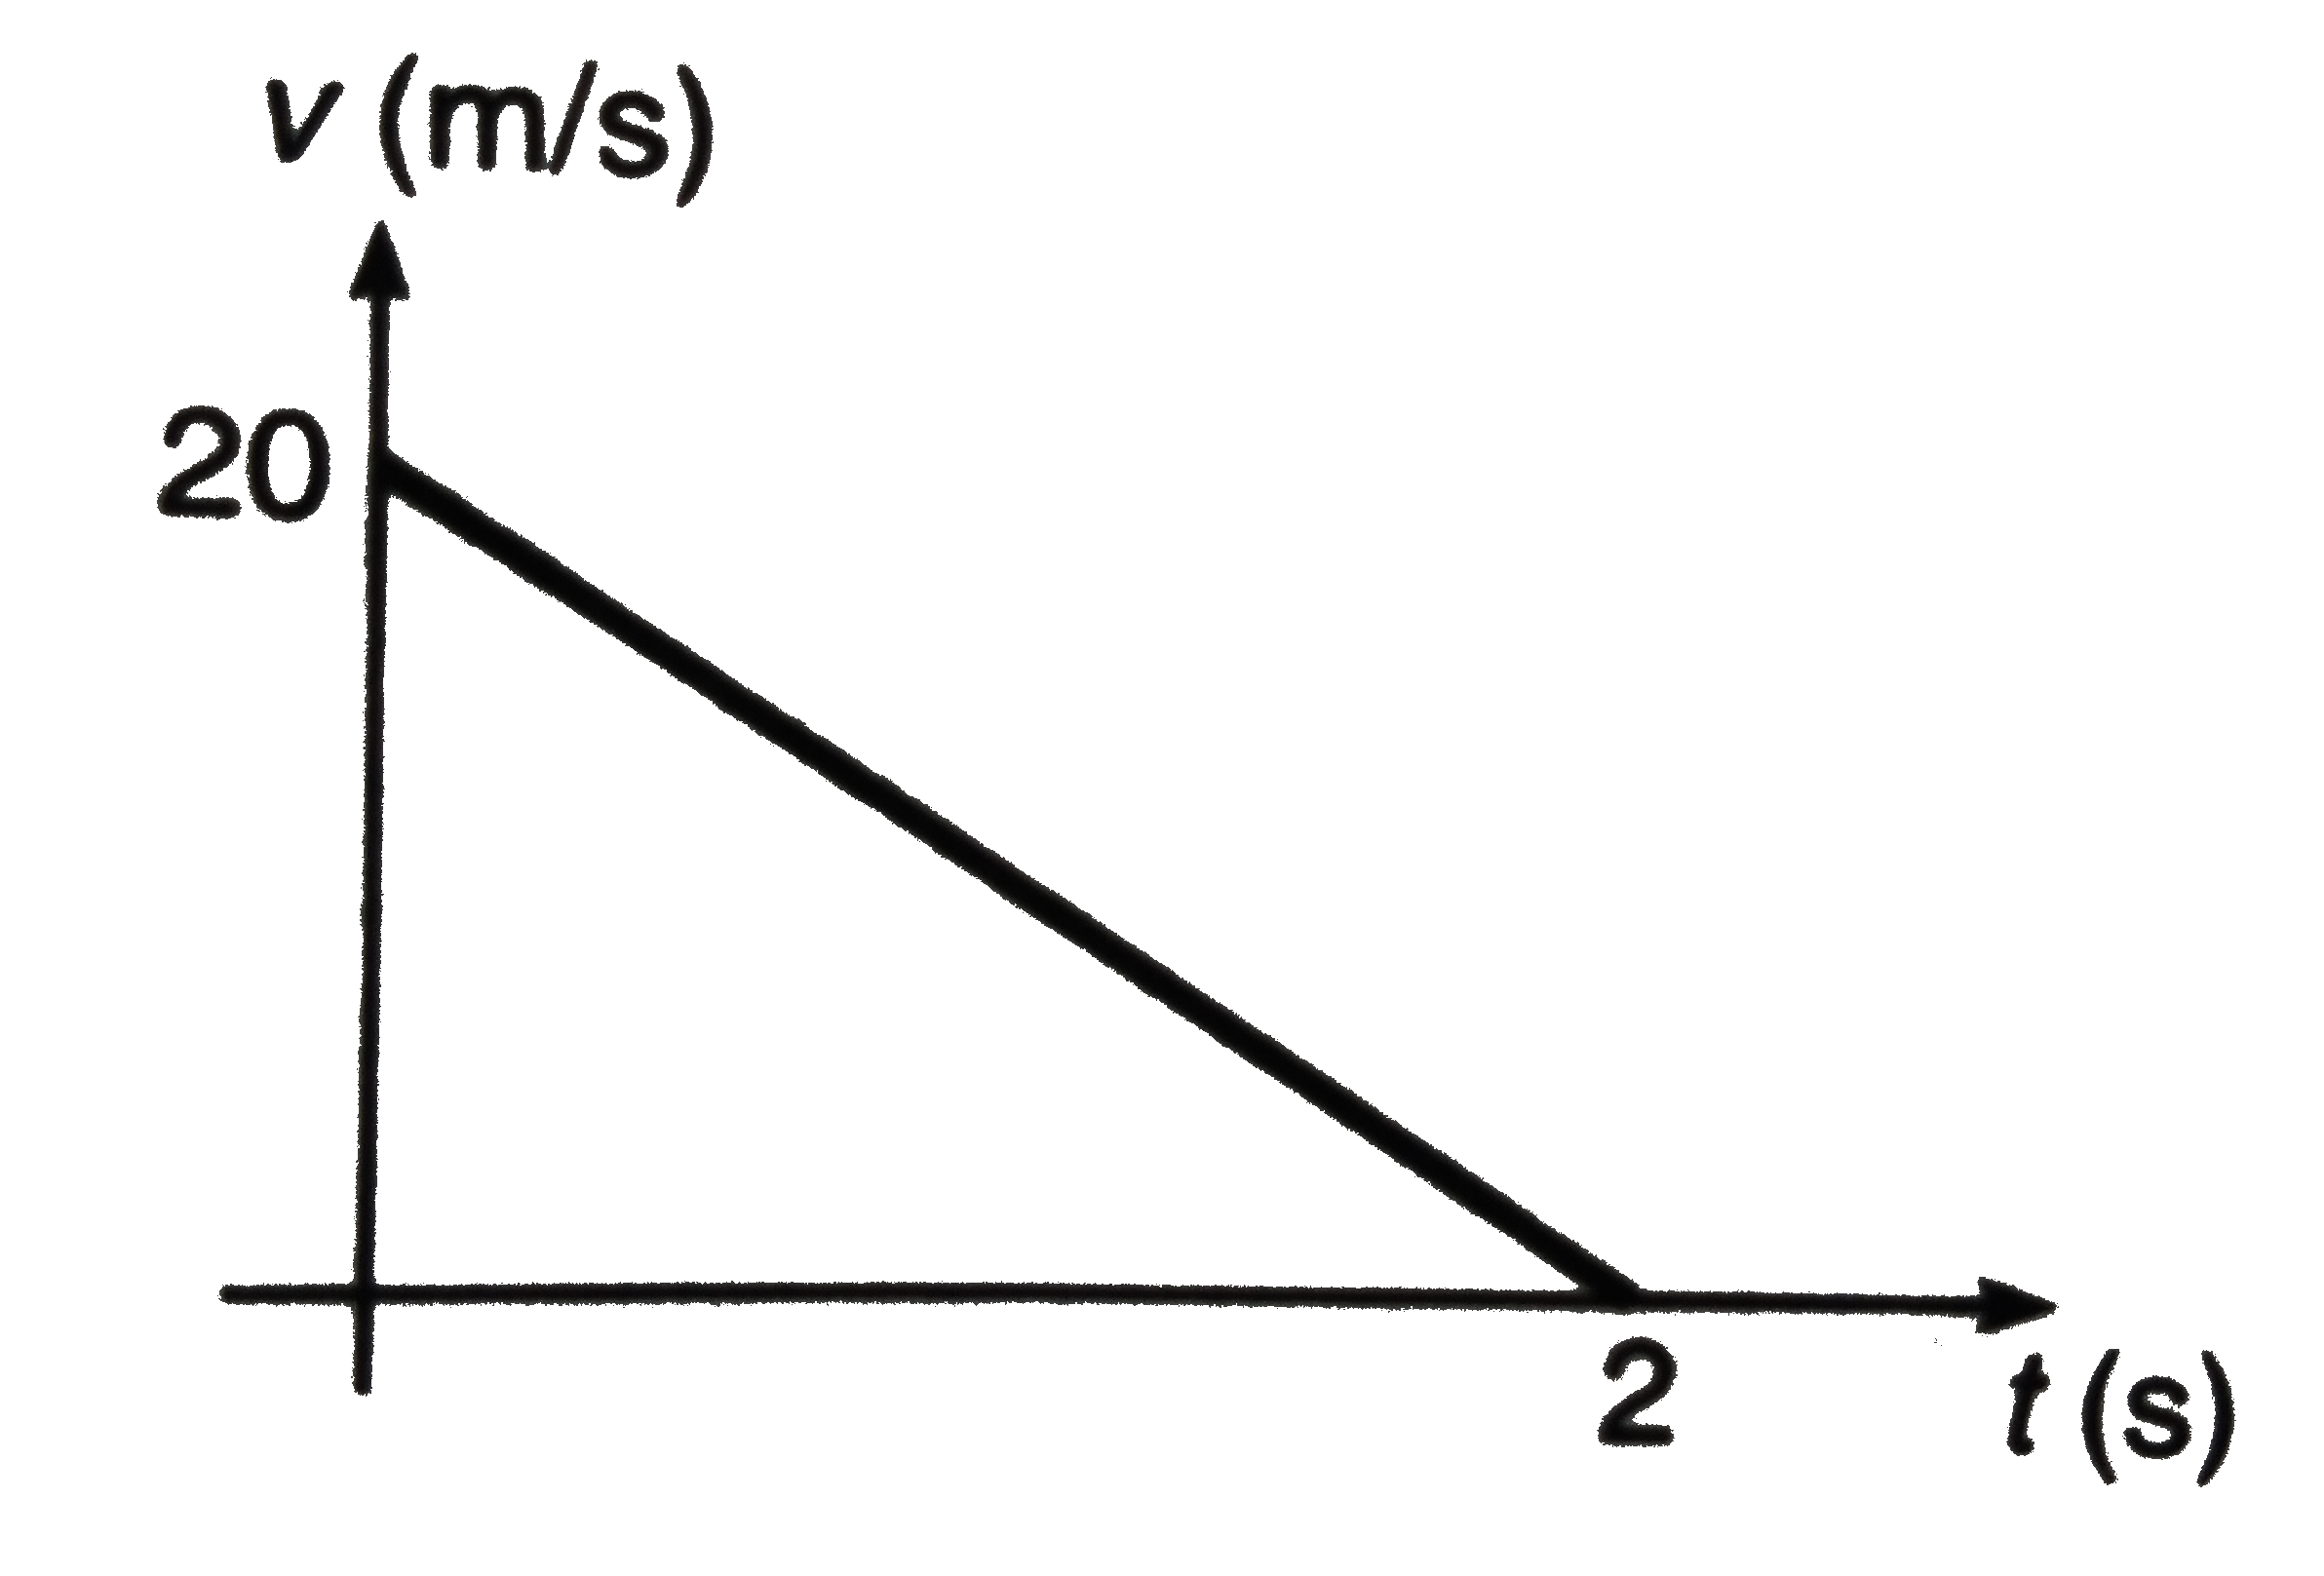
View SolutionVelocity-time graph of a particle of mass (2 kg) moving in a straight line is as shown in Fig. 9.20. Find the word done by all the forces acting on the particle.
 .
.
View SolutionVelocity-time graph of a particle of mass (2 kg) moving in a straight line is as shown in Fig. 9.20. Find the word done by all the forces acting on the particle.
 .
.
View SolutionThe velocity time plot for a particle moving on straight line is shown in the figure.

View SolutionThe velocity time plot for a particle moving on straight line is shown in the figure.

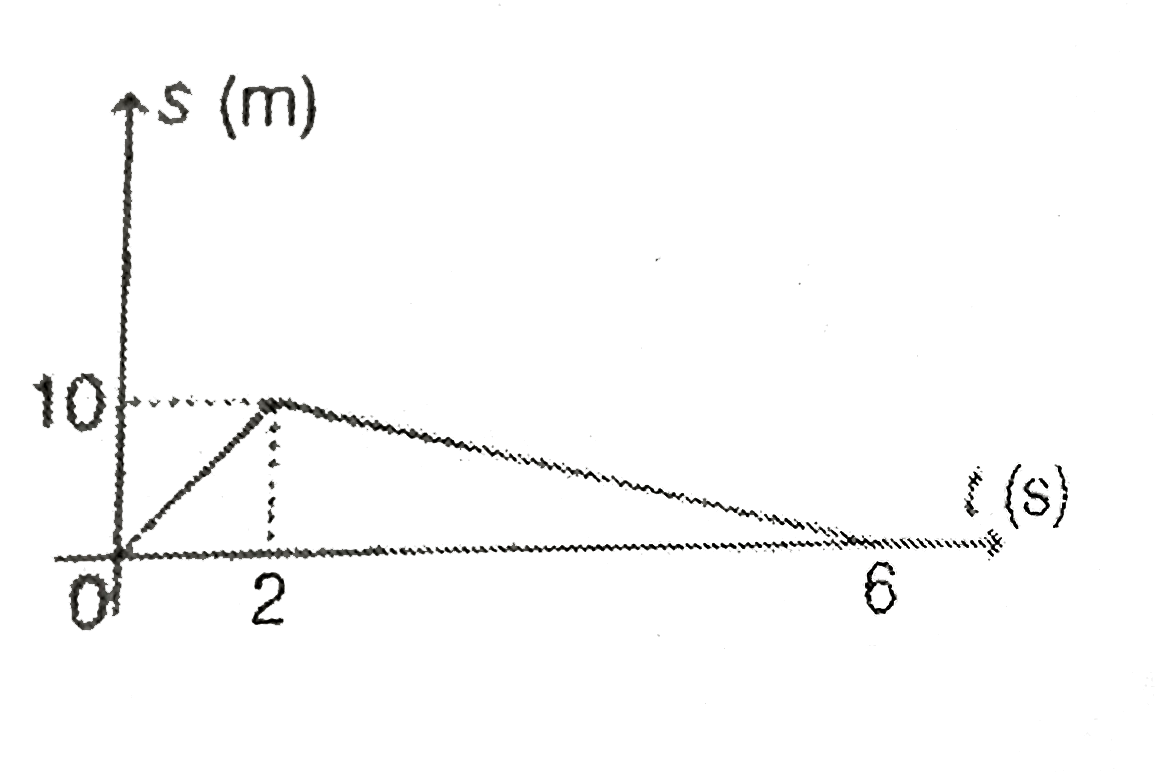
View SolutionDisplacement-time graph of a particle moving in a straight line is as shown in figure. Mass of the particle is 2 kg. The total impulse imparted to the particle in a time interval from t=0 to t=6 s in N-s will be
View SolutionThe x-t graph of a particle moving along a straight line is shown in figure

The v-t graph of the particle is correctly shown by
View SolutionThe x-t graph of a particle moving along a straight line is shown in figure
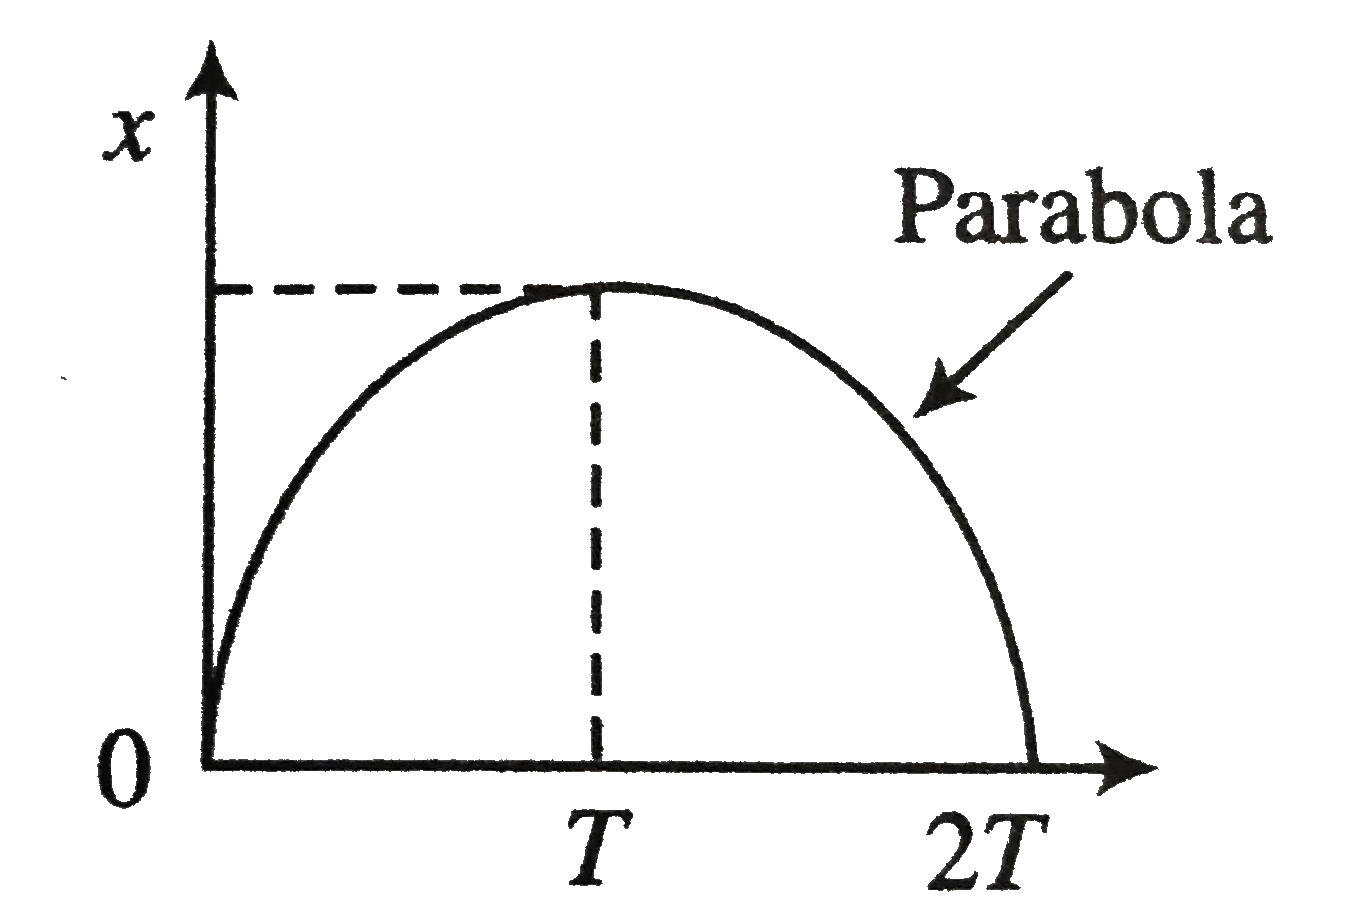
The a-t graph of the particle is correctly shown by
View SolutionThe velovity-time graph of a particle moving in a straitht line is shown in . The acceleration of the particle at t=9s is.
 .
.
View Solution
