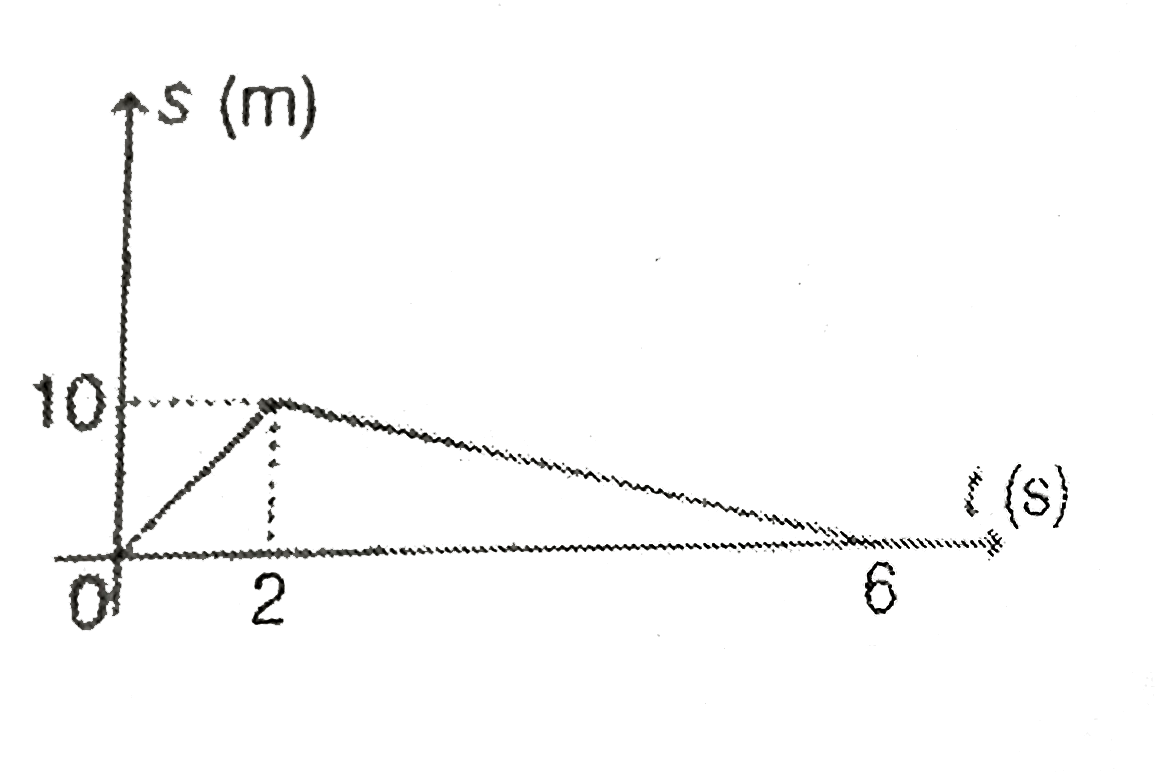
Displacement-time graph of a particle moving in a straight line is as shown in figure. Mass of the particle is 2 kg. The total impulse imparted to the particle in a time interval from t=0 to t=6 s in N-s will be
30
15
−30
−15
Step by step video & image solution for Displacement-time graph of a particle moving in a straight line is as shown in figure. Mass of the particle is 2 kg. The total impulse imparted to the particle in a time interval from t=0 to t=6 s in N-s will be by Physics experts to help you in doubts & scoring excellent marks in Class 11 exams.
Updated on:21/07/2023Topper's Solved these Questions
- CENTRE OF MASS, IMPULSE AND MOMENTUMBook:DC PANDEY ENGLISHChapter:CENTRE OF MASS, IMPULSE AND MOMENTUMExercise:More a than one option is Correct
Explore 1 Video
- CENTRE OF MASS, IMPULSE AND MOMENTUMBook:DC PANDEY ENGLISHChapter:CENTRE OF MASS, IMPULSE AND MOMENTUMExercise:Comprehension type questions
Explore 15 Videos
- CENTRE OF MASS, IMPULSE AND MOMENTUMBook:DC PANDEY ENGLISHChapter:CENTRE OF MASS, IMPULSE AND MOMENTUMExercise:Comprehension type questions
Explore 15 Videos
- CENTRE OF MASSBook:DC PANDEY ENGLISHChapter:CENTRE OF MASSExercise:Medical entrances gallery
Explore 27 Videos
- CENTRE OF MASS, LINEAR MOMENTUM AND COLLISIONBook:DC PANDEY ENGLISHChapter:CENTRE OF MASS, LINEAR MOMENTUM AND COLLISIONExercise:Level 2 Subjective
Explore 21 Videos
Similar Questions
Displacement time graph of a particle moving in a straight line is a shown in figure.

View SolutionVelocity displacement graph of a particle moving in a straight line is as shown in figure.

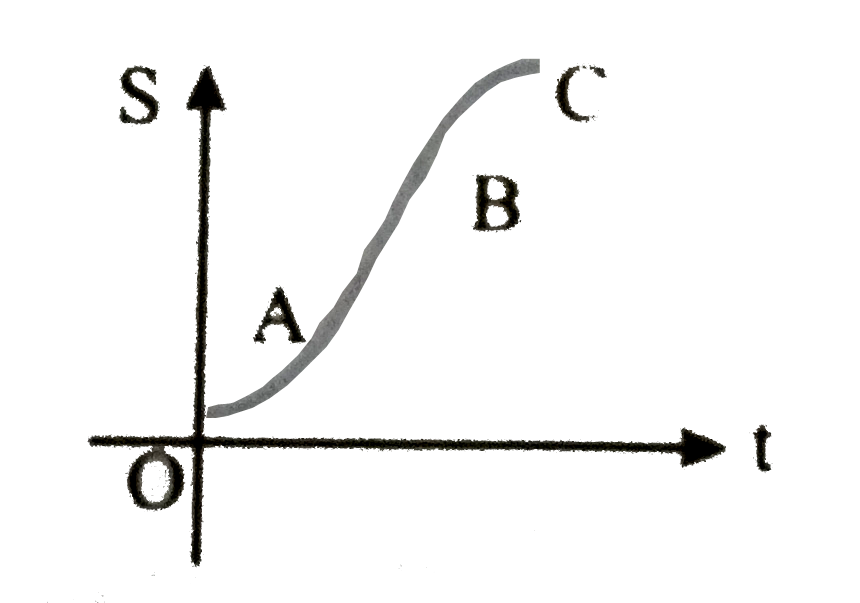
View SolutionDisplacement time graph of a particle moving in a straight line is as shown in figure. Select the correct alternative (s) :
 .
.
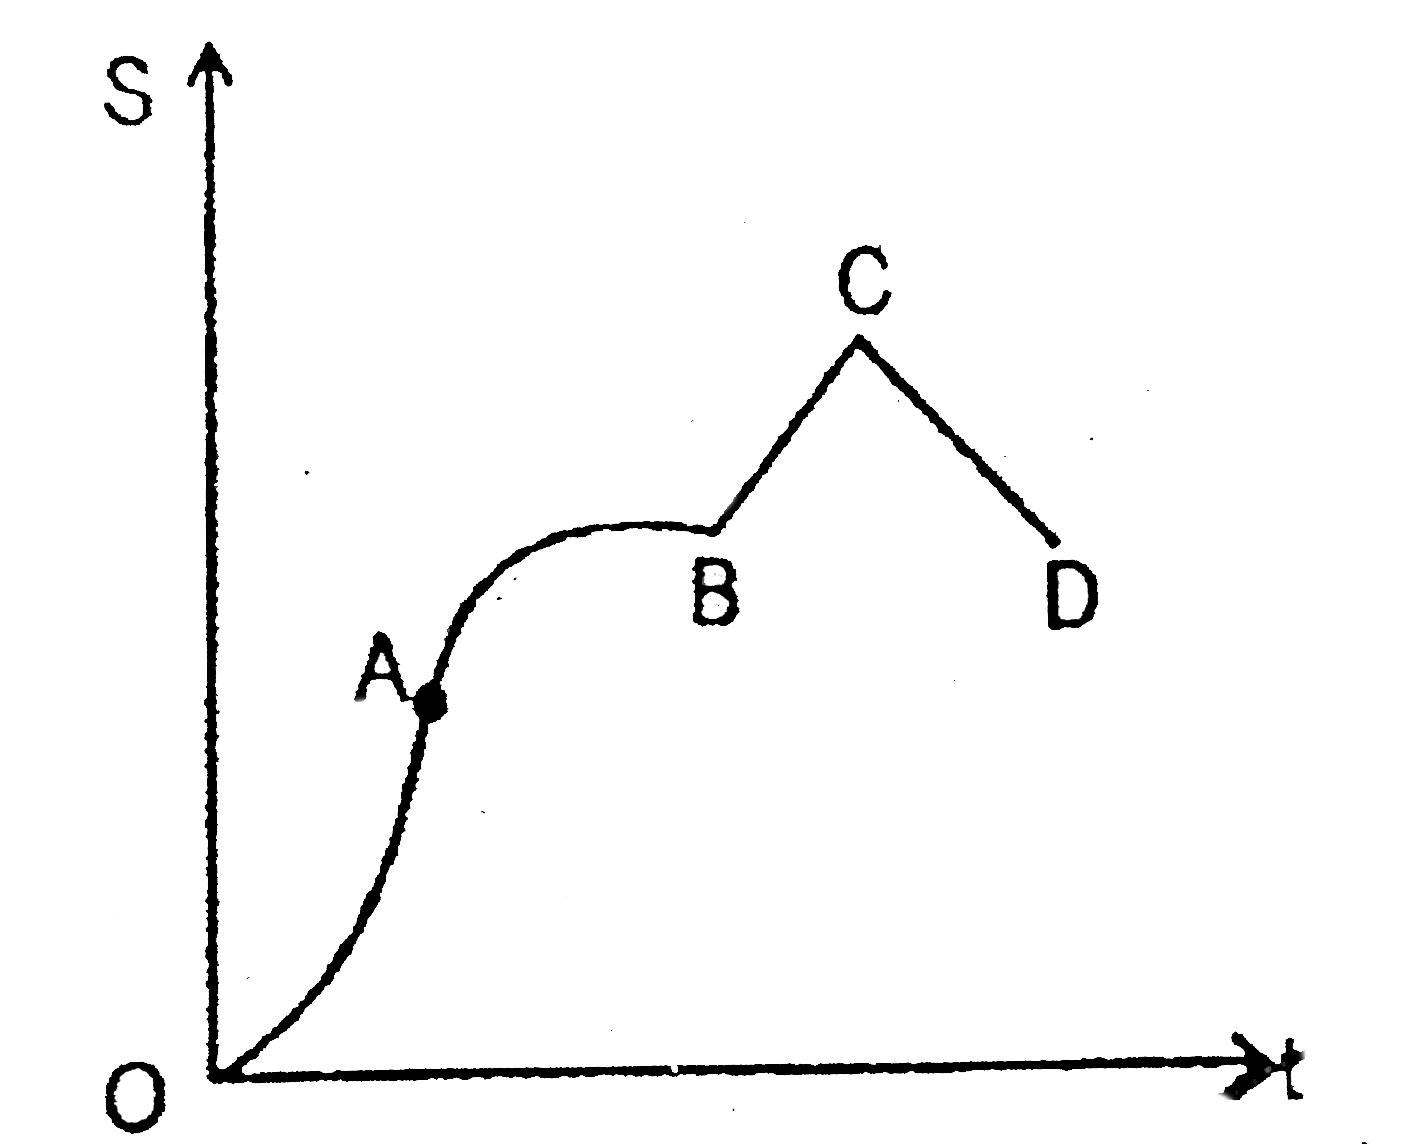
View SolutionDisplacment-time graph of a particle moving in a straight line is as shown in figure. Choose the INCORRECT statement(s)
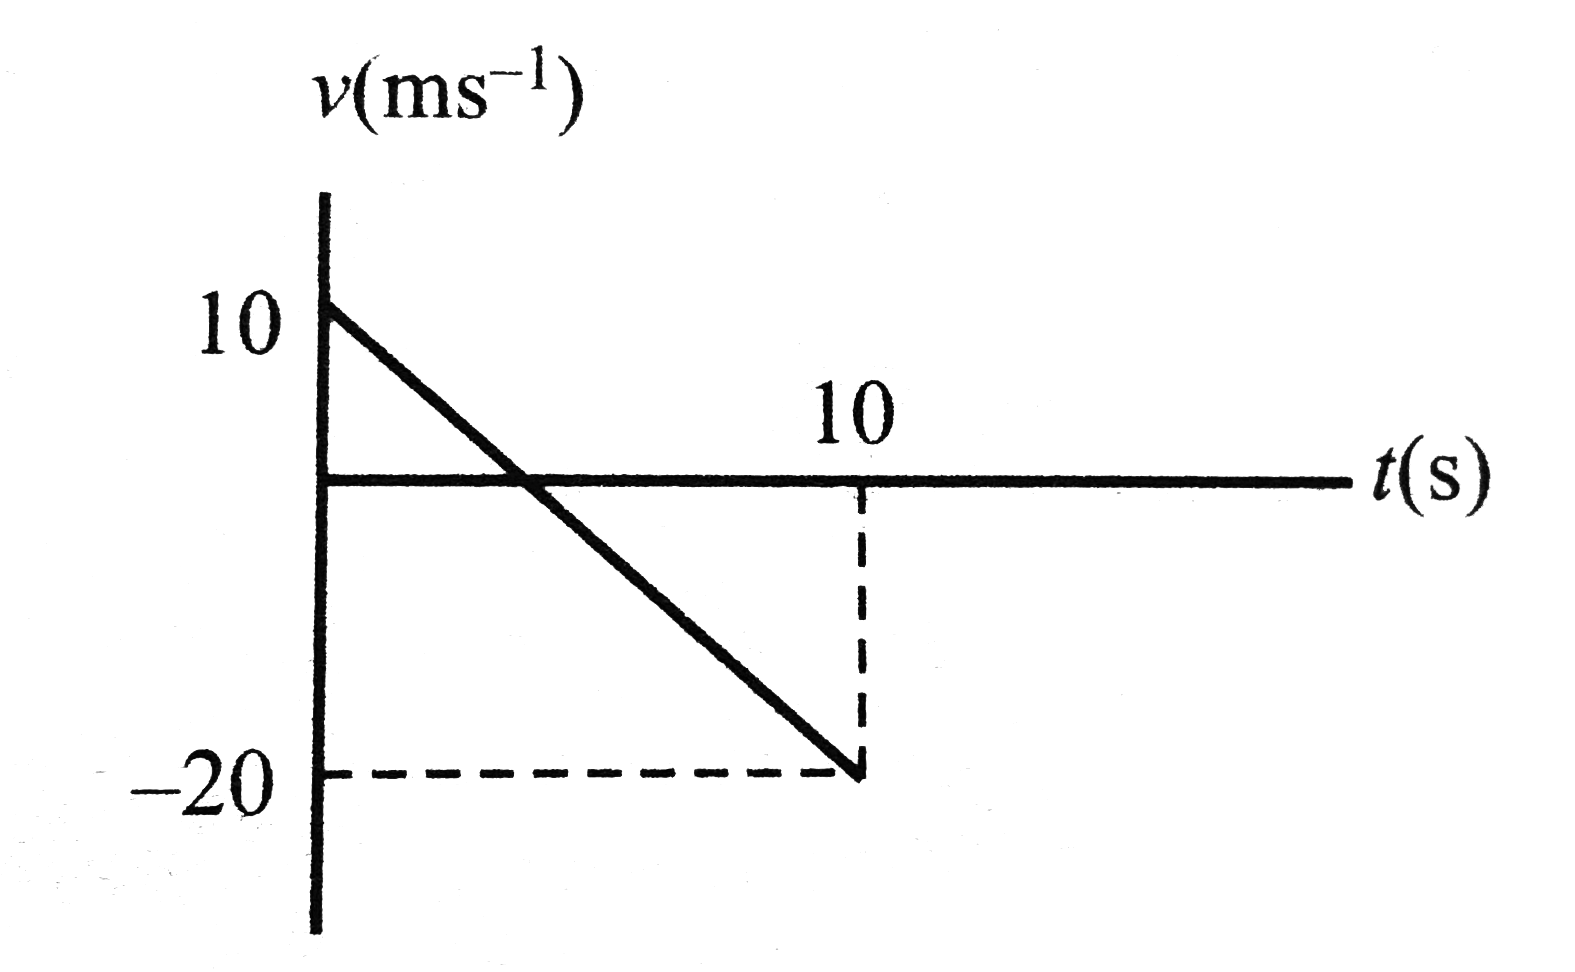
View SolutionThe velocity-time graph of a particle moving in a straight line is shown in figure. The mass of the particle is 2kg. Work done by all the forces acting on the particle in time interval between t=0 to t=10s is
View SolutionThe x-t graph of a particle moving along a straight line is shown in figure

The v-t graph of the particle is correctly shown by
View SolutionThe x-t graph of a particle moving along a straight line is shown in figure
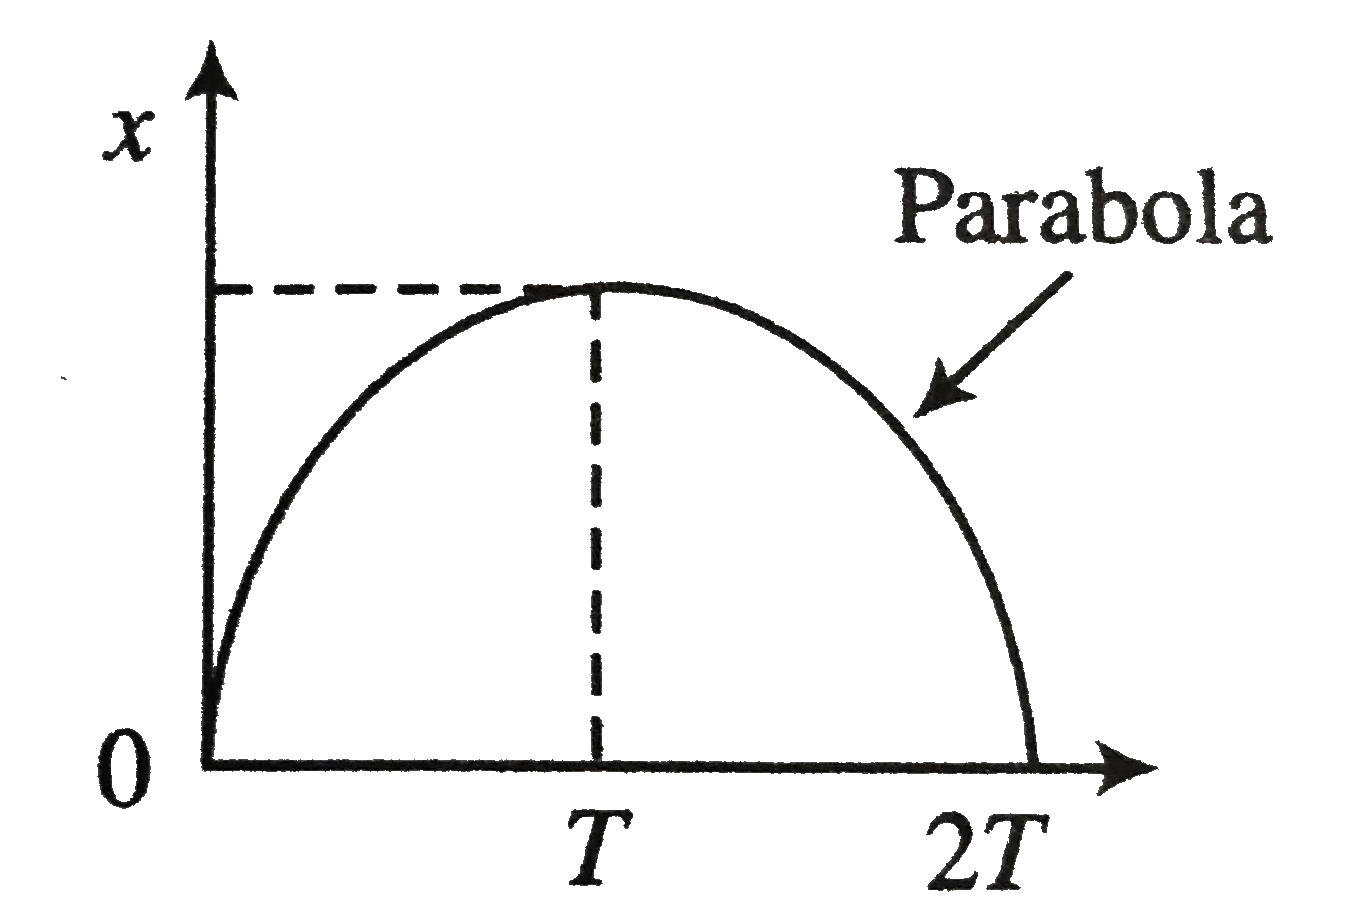
The a-t graph of the particle is correctly shown by
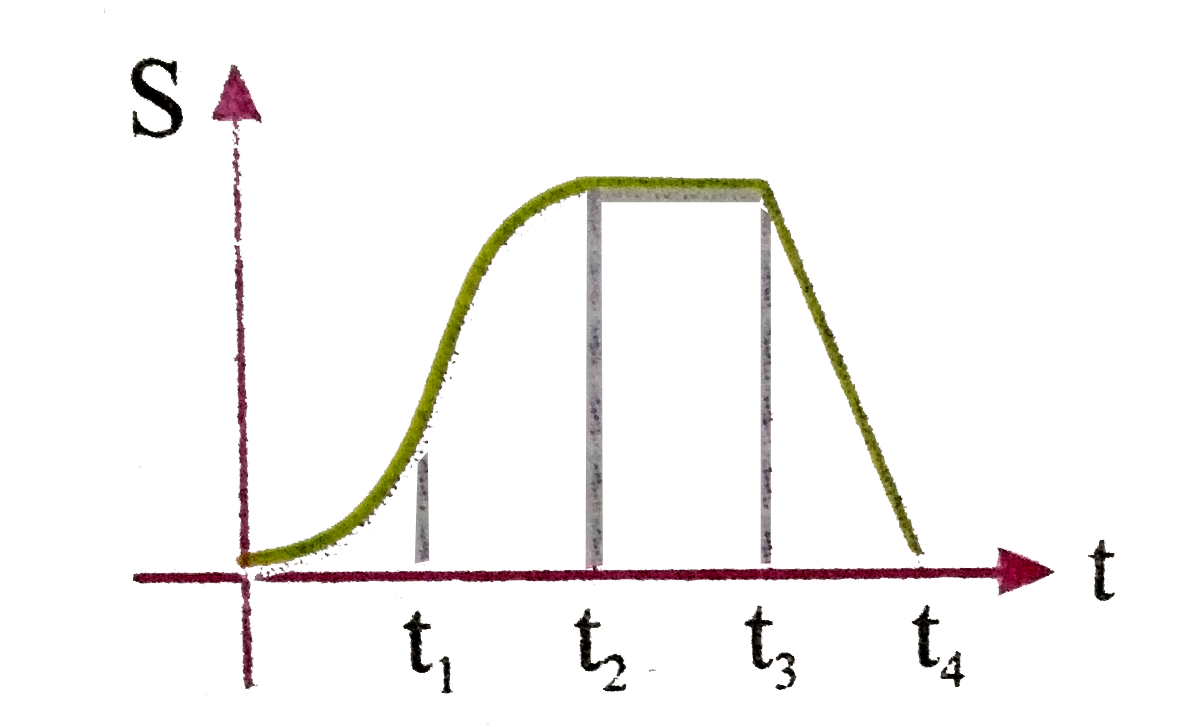
View SolutionDisplacement time graph of a particle moving in a straight line is as shown in figure.
From the graph we can conclude that work done on the block is :
 .
.
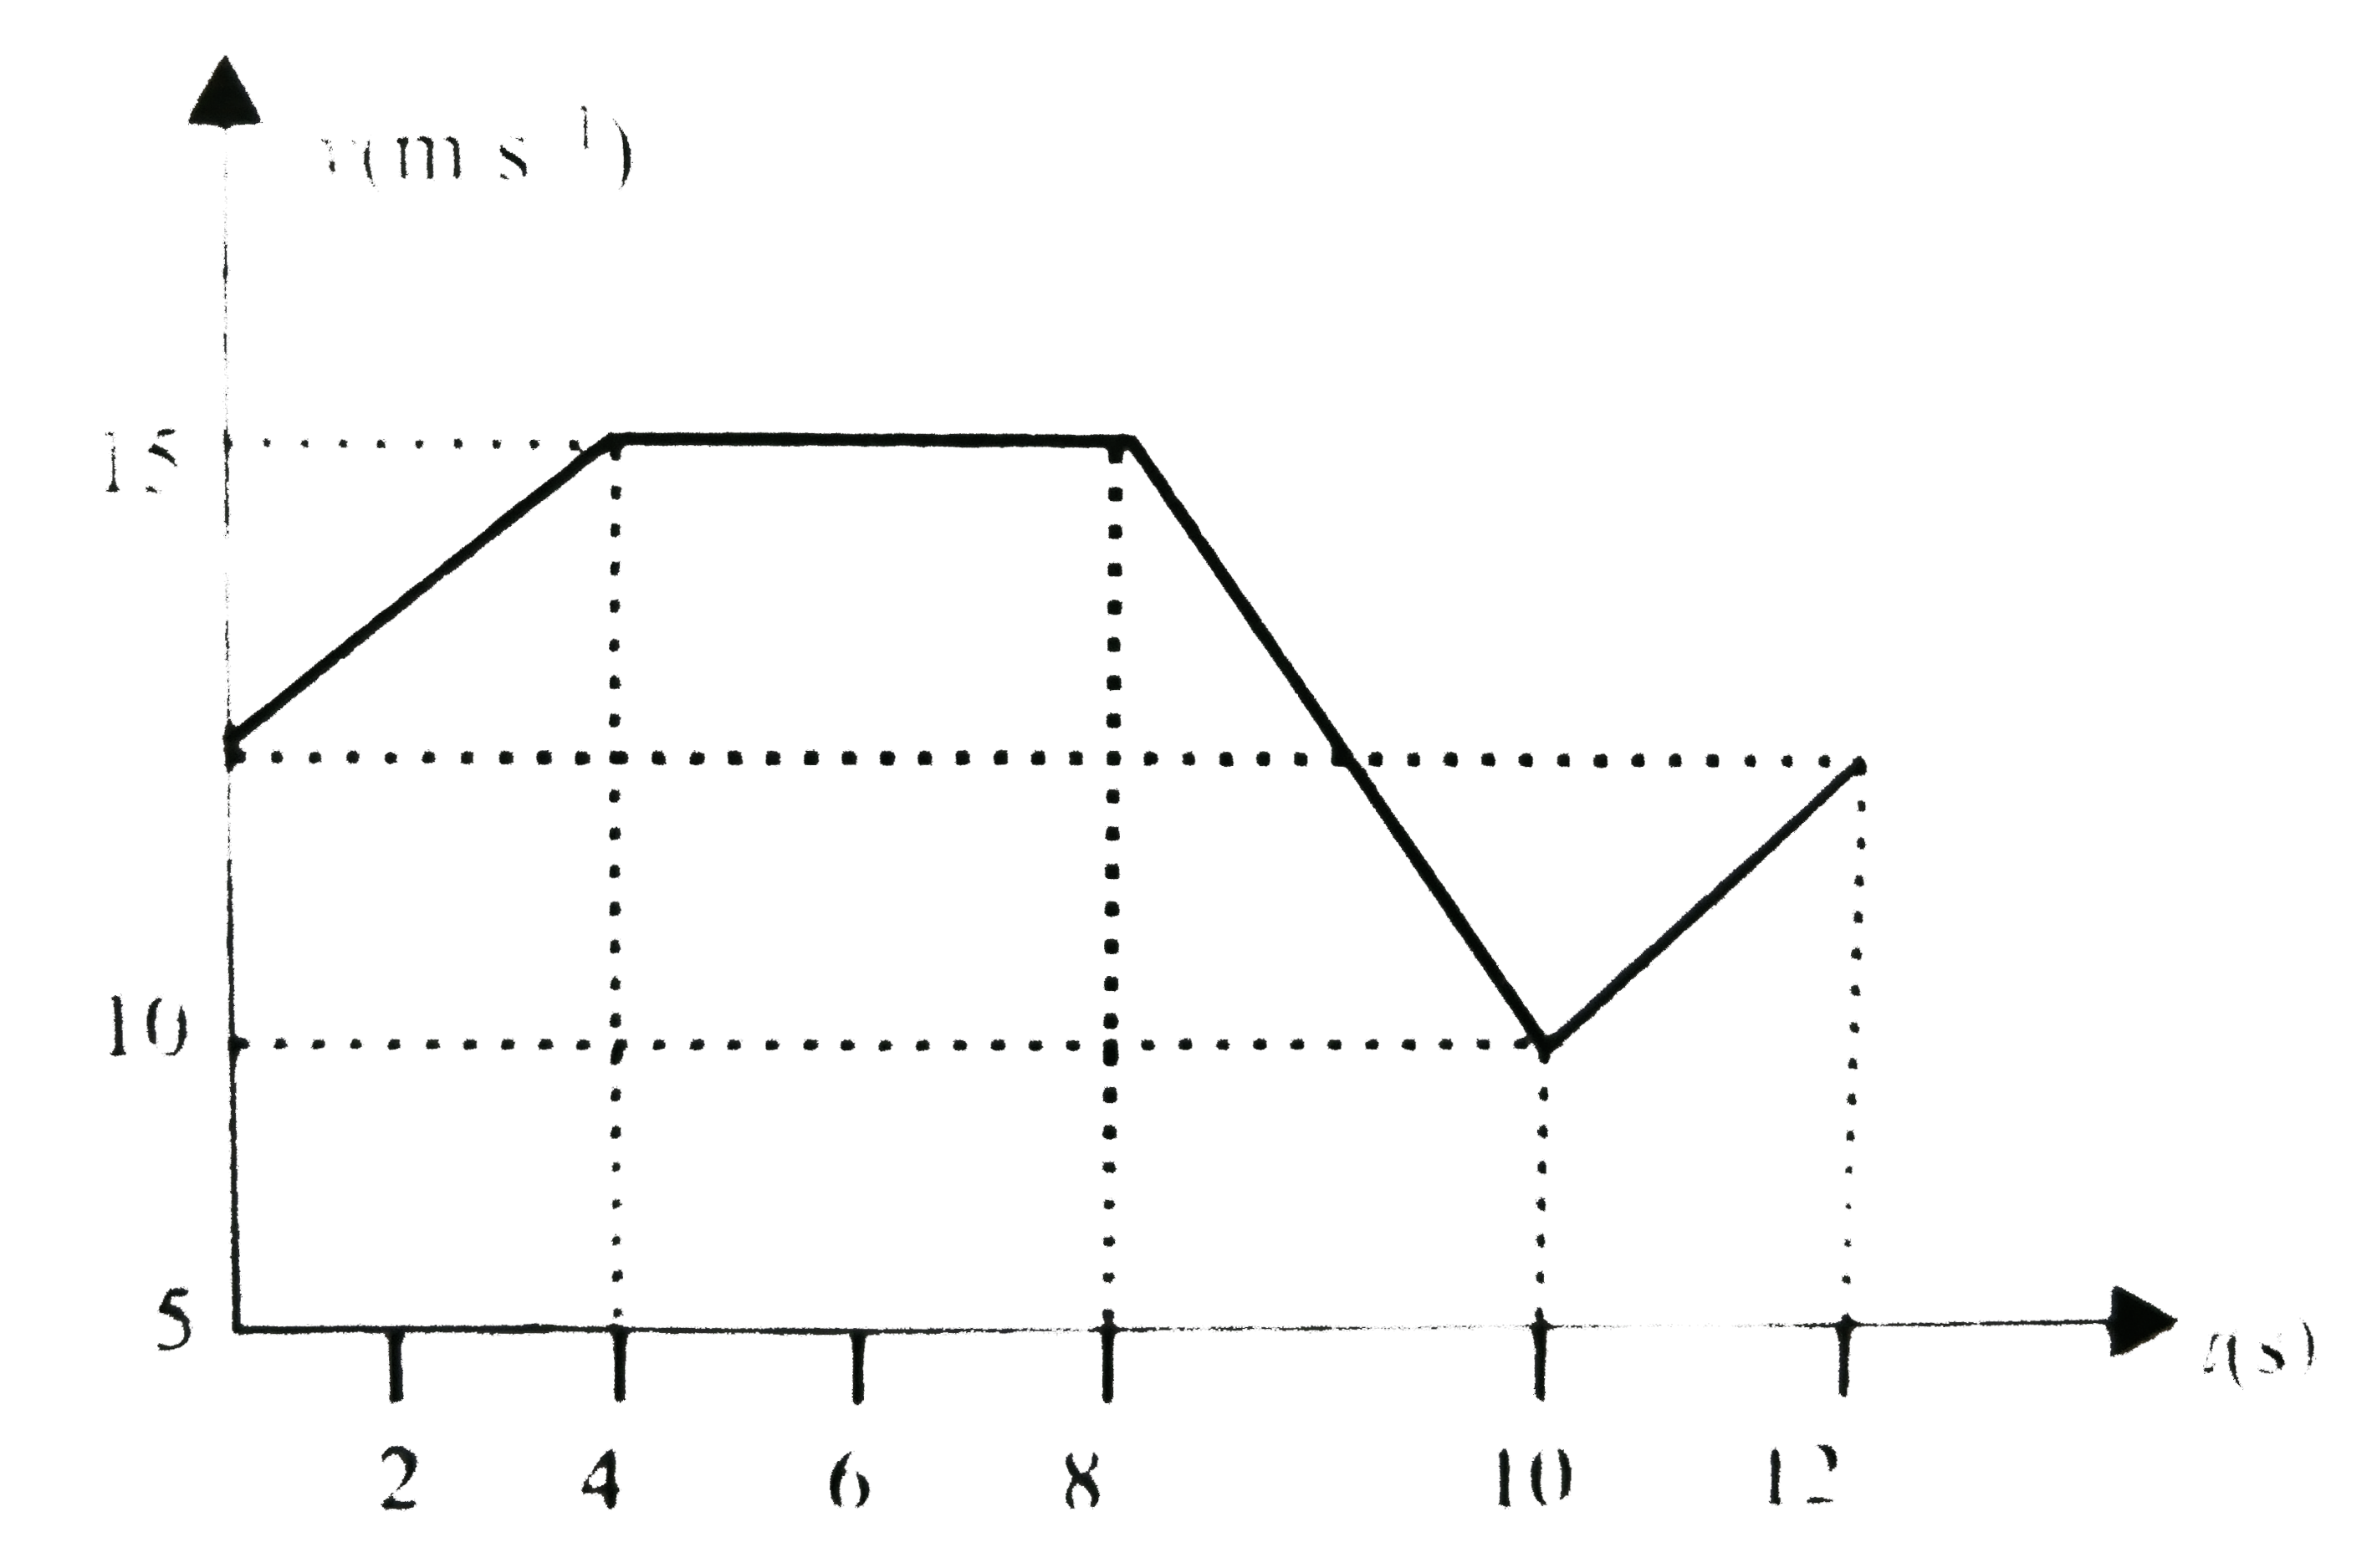
View SolutionThe velovity-time graph of a particle moving in a straitht line is shown in . The acceleration of the particle at t=9s is.
 .
.
View SolutionThe x-t graph of a particle moving along a straight line is shown in figure
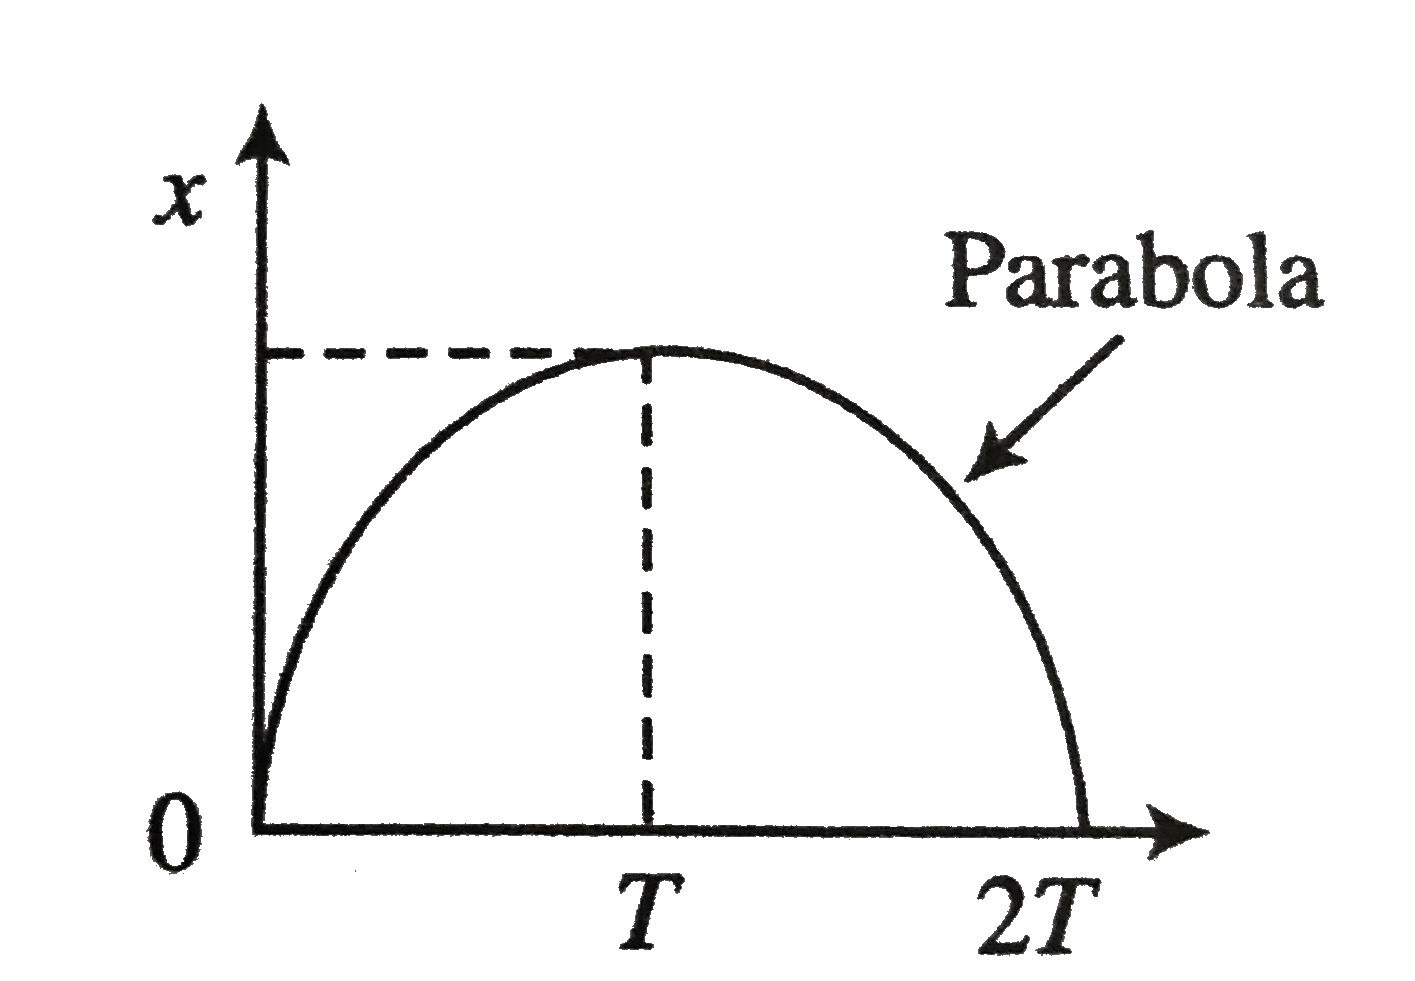
The speed-time graph of the particle is correctly shown by
View Solution

