The area enclosed by the position-time graph of a stationary body,
gives its speed
gives its velocity
gives its acceleration
has no physical significance
The correct Answer is:d
To solve the question regarding the area enclosed by the position-time graph of a stationary body, we can follow these steps:
1. Understand the Graph:
- A position-time graph represents the position of an object over time. For a stationary body, the position remains constant over time.
2. Draw the Graph:
- On the graph, the x-axis represents time (t) and the y-axis represents position (P). For a stationary body, the graph will be a horizontal line at a constant position value.
3. Identify the Area:
- The area under the curve (or line) in a position-time graph is calculated as the product of the base (time interval) and the height (position value). However, since the body is stationary, the height does not change.
4. Calculate the Area:
- If the position is constant (let's say at position P0) over a time interval from t1 to t2, the area would be:
Area=Base×Height=(t2−t1)×P0
5. Interpret the Area:
- The area calculated does not correspond to any physical quantity like speed, velocity, or acceleration. In kinematics, the area under a velocity-time graph represents displacement, but in this case, since the body is stationary, the area does not represent any meaningful physical quantity.
6. Conclusion:
- Therefore, the area enclosed by the position-time graph of a stationary body has no physical significance.
Final Answer:
The area enclosed by the position-time graph of a stationary body has no physical significance.
- A position-time graph represents the position of an object over time. For a stationary body, the position remains constant over time.
- On the graph, the x-axis represents time (t) and the y-axis represents position (P). For a stationary body, the graph will be a horizontal line at a constant position value.
- The area under the curve (or line) in a position-time graph is calculated as the product of the base (time interval) and the height (position value). However, since the body is stationary, the height does not change.
- If the position is constant (let's say at position P0) over a time interval from t1 to t2, the area would be:
Area=Base×Height=(t2−t1)×P0
- The area calculated does not correspond to any physical quantity like speed, velocity, or acceleration. In kinematics, the area under a velocity-time graph represents displacement, but in this case, since the body is stationary, the area does not represent any meaningful physical quantity.
- Therefore, the area enclosed by the position-time graph of a stationary body has no physical significance.
The area enclosed by the position-time graph of a stationary body has no physical significance.
Topper's Solved these Questions
- COMPETITION CARE UNITBOOK - ICSECHAPTER - COMPETITION CARE UNITEXERCISE - Dynamics (PROJECTILE MOTION)
31 Videos
- COMPETITION CARE UNITBOOK - ICSECHAPTER - COMPETITION CARE UNITEXERCISE - Dynamics ( Laws of motion )
36 Videos
- COMPETITION CARE UNITBOOK - ICSECHAPTER - COMPETITION CARE UNITEXERCISE - VECTORS AND SCALARS [Selected from Previoius Years Engg. & Med. & IIT Exam Qns]
35 Videos
- CIRCULAR MOTION BOOK - ICSECHAPTER - CIRCULAR MOTION EXERCISE - MODULE 2 (FROM ROTATIONAL KINETIC ENERGY , WORK ,POWER)
24 Videos
- DIMENSIONSBOOK - ICSECHAPTER - DIMENSIONSEXERCISE - SELECTED PROBLEMS (FROM CONVERSIONS OF ONE SYSTEMS OF UNITS INTO ANOTHER)
9 Videos
Similar Questions
Knowledge Check
The area under acceleration-time graph gives
Aintial velocityBfinal velocityCchange in velocityDdistance travelledWhich of the following graphs represents the position time-graph of a particle moving with negative velocity?
A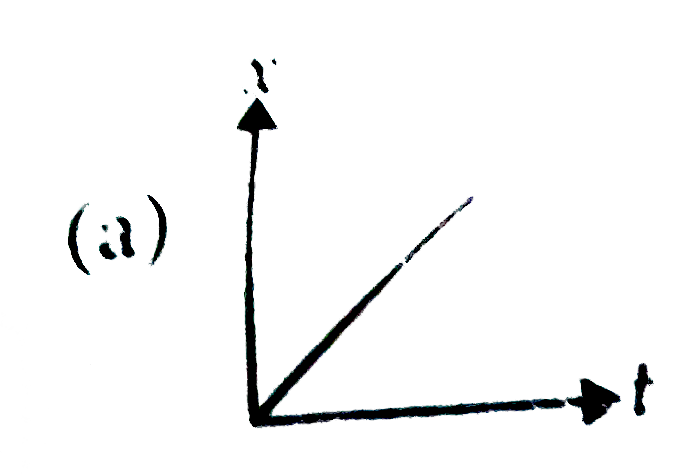 B
B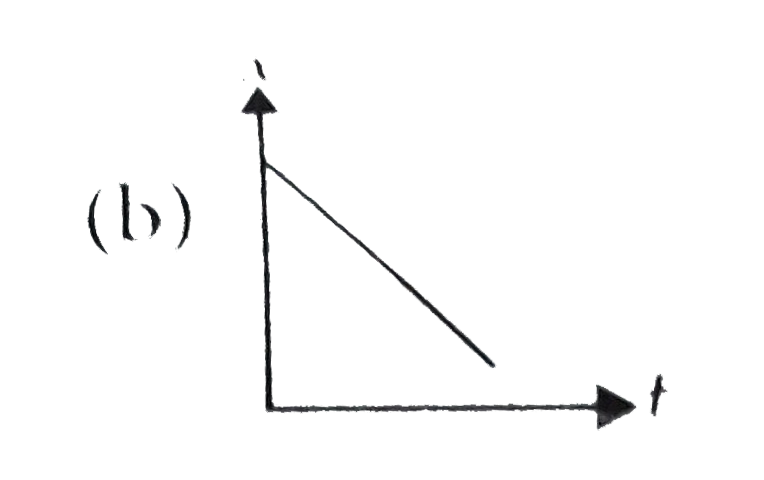 C
C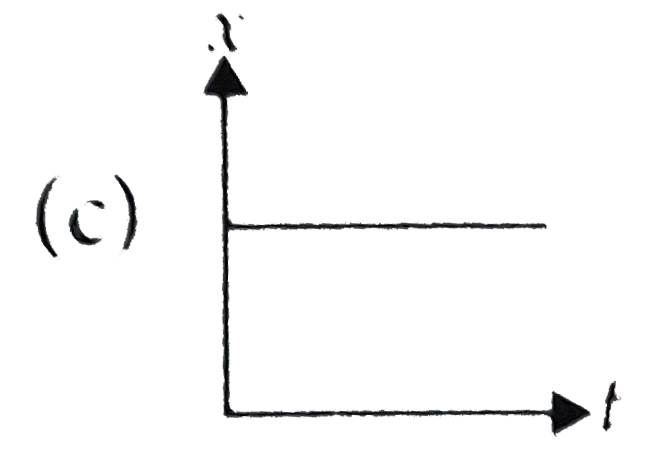 D
D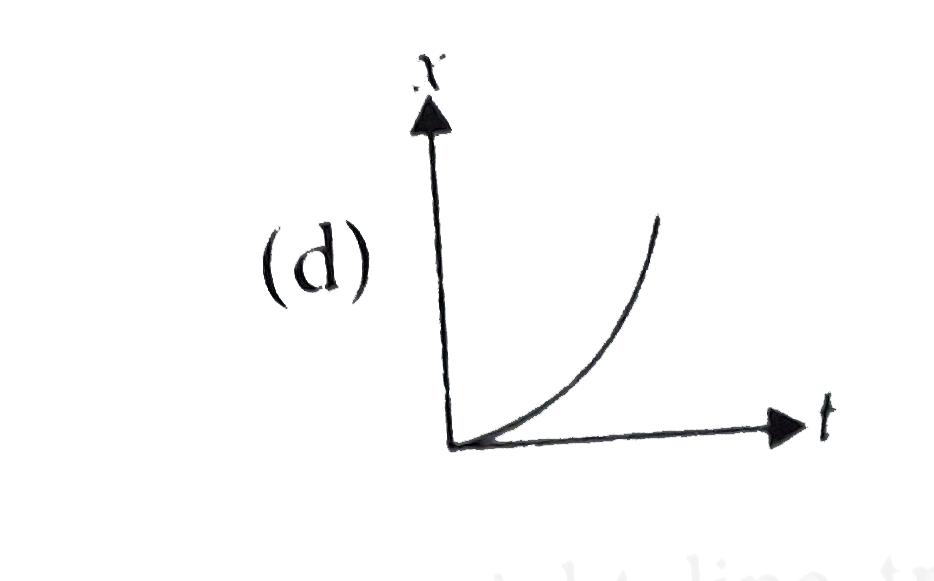
Figure shows the position-time (x-t) graph of one dimensional motion of a mass 500g. What is the time interval between two consecutive impulses received by the body?
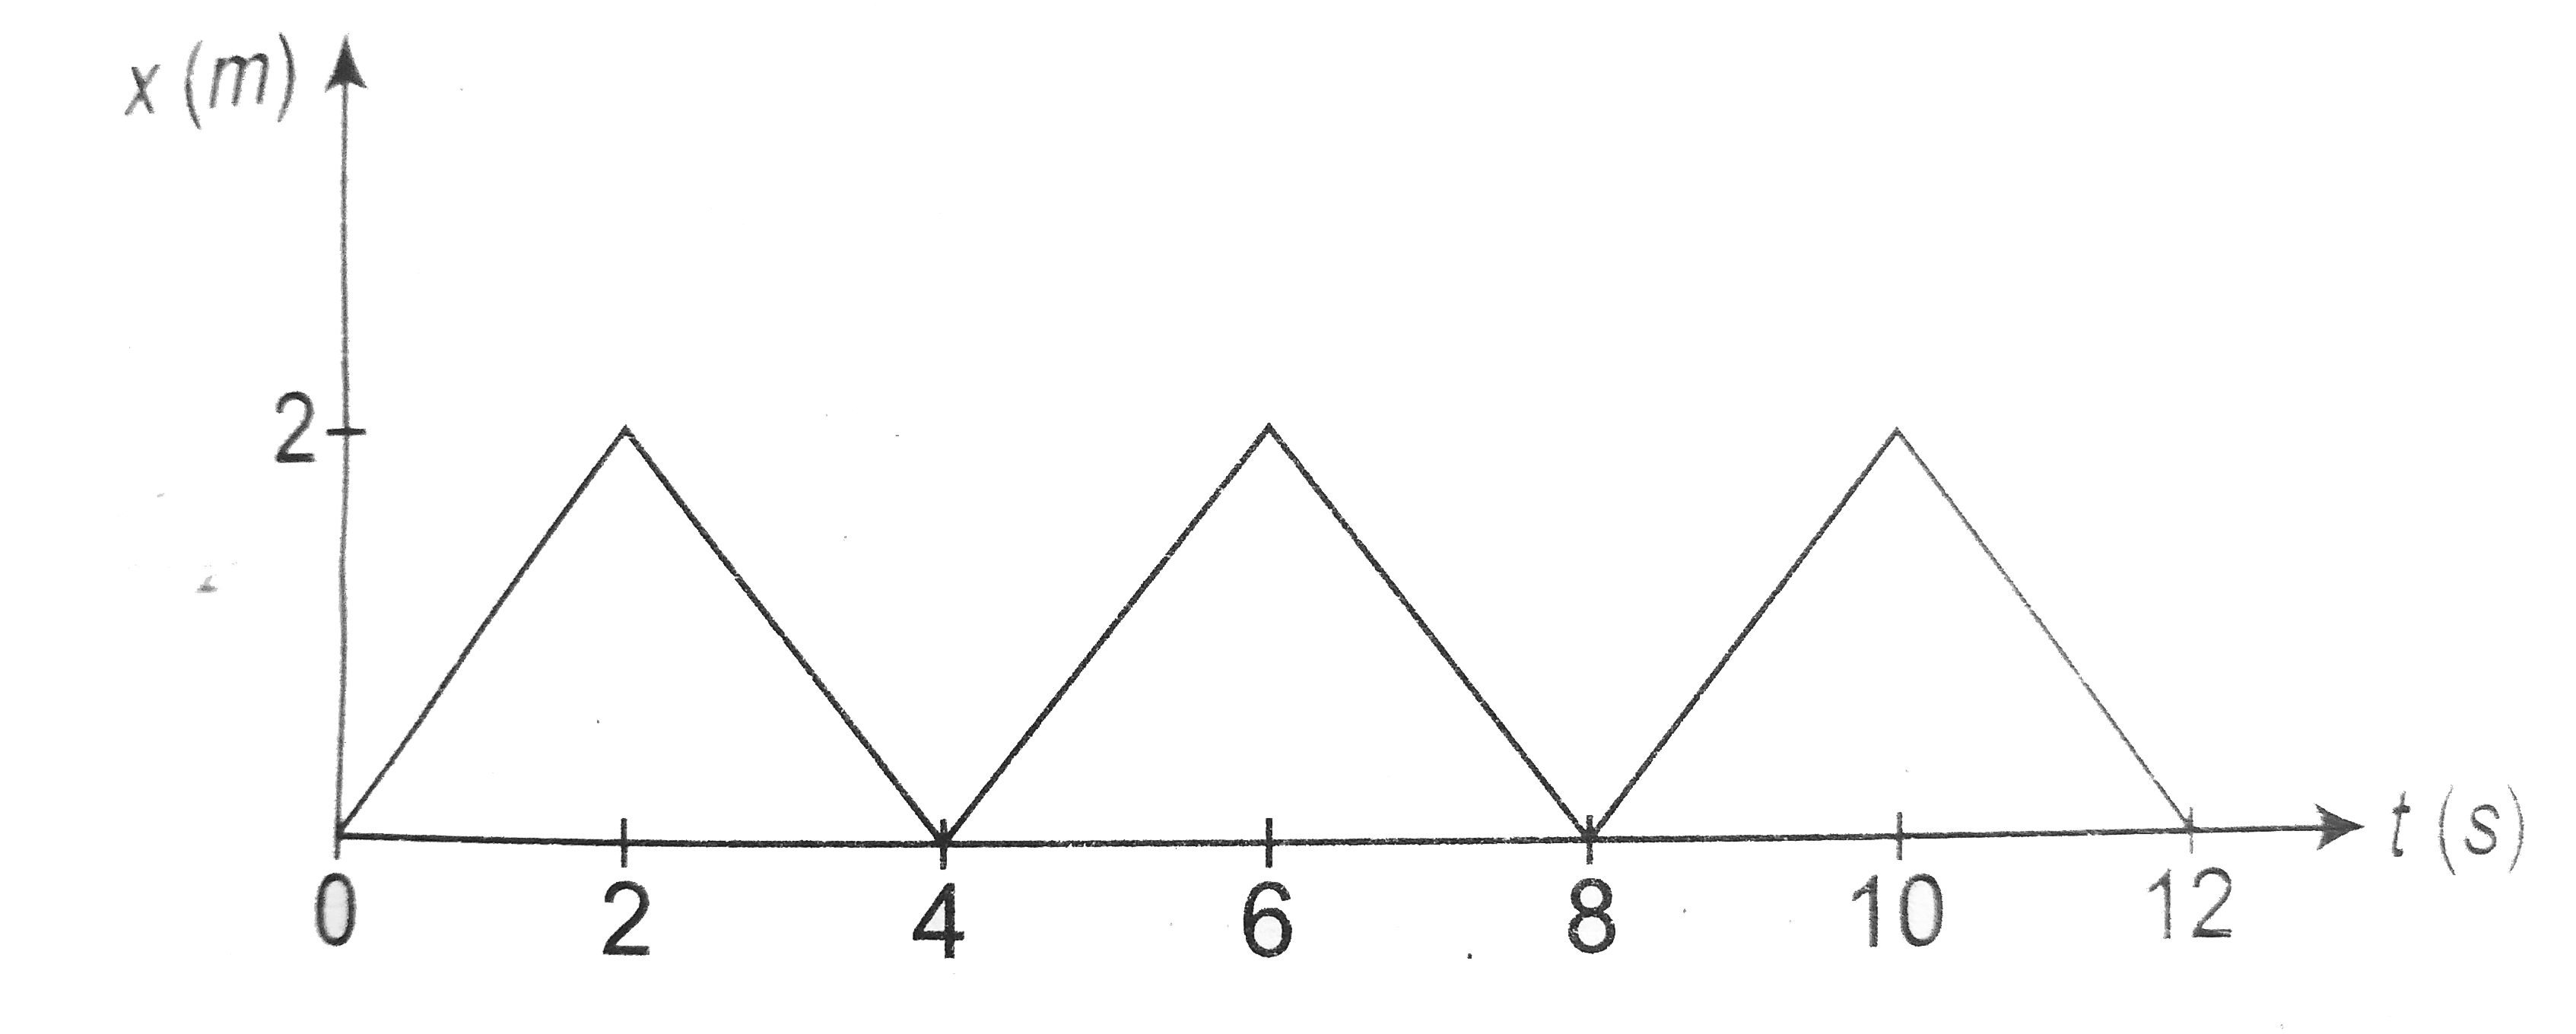 A2sB4sC6sD8s
The area under acceleration-time graph gives
View SolutionYou are given the position-time graph of three deffernt bodies A,B, and C, Find which will have grater velocity an which will have least velocity.
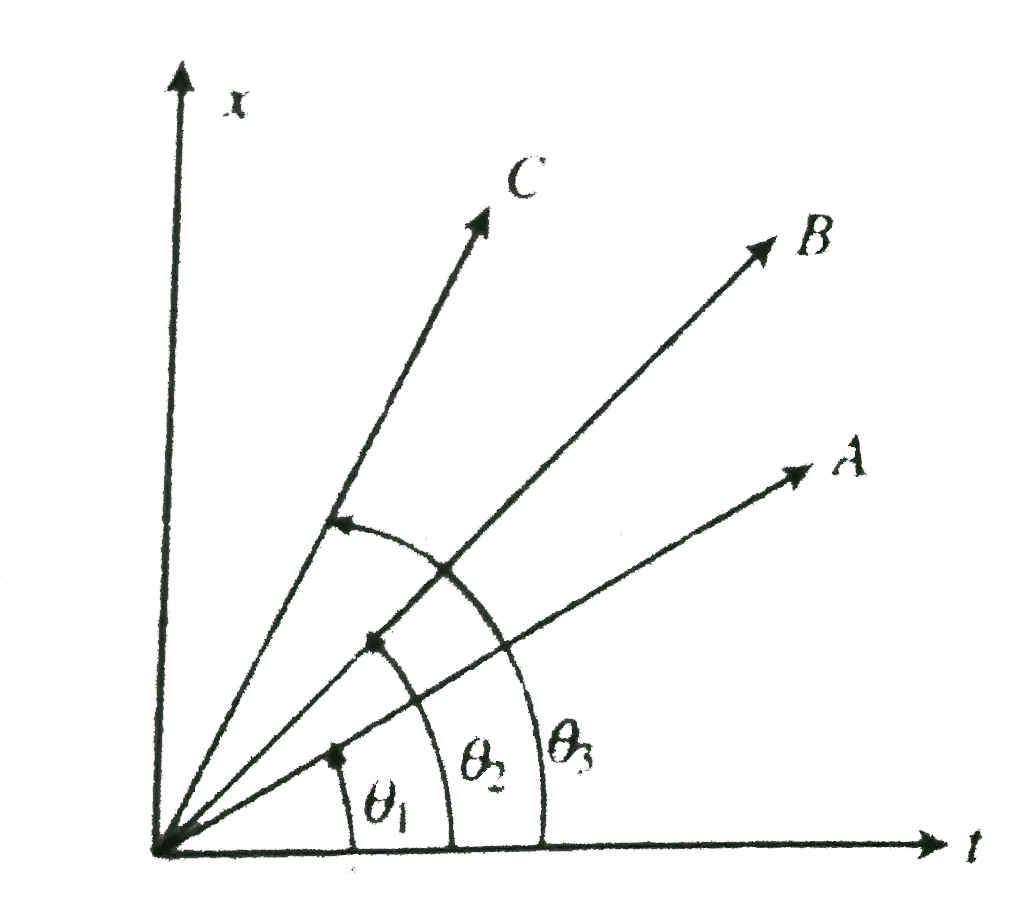 .
.
View SolutionFind the area enclosed by the circle of radius a.
View SolutionSTATEMENT - 1 : Equation of motion (v=u+at) is applicable even if the acceleration is non-uniform.
STATEMENT - 2 : The initial velocity of a body is u and its acceleration is ft where f is a constant and t is time.
The displacement in time t is (ut+12ft2).
STATEMENT - 3 : The area enclosed by the a-t graph and time axis gives the change in velocity of the body.
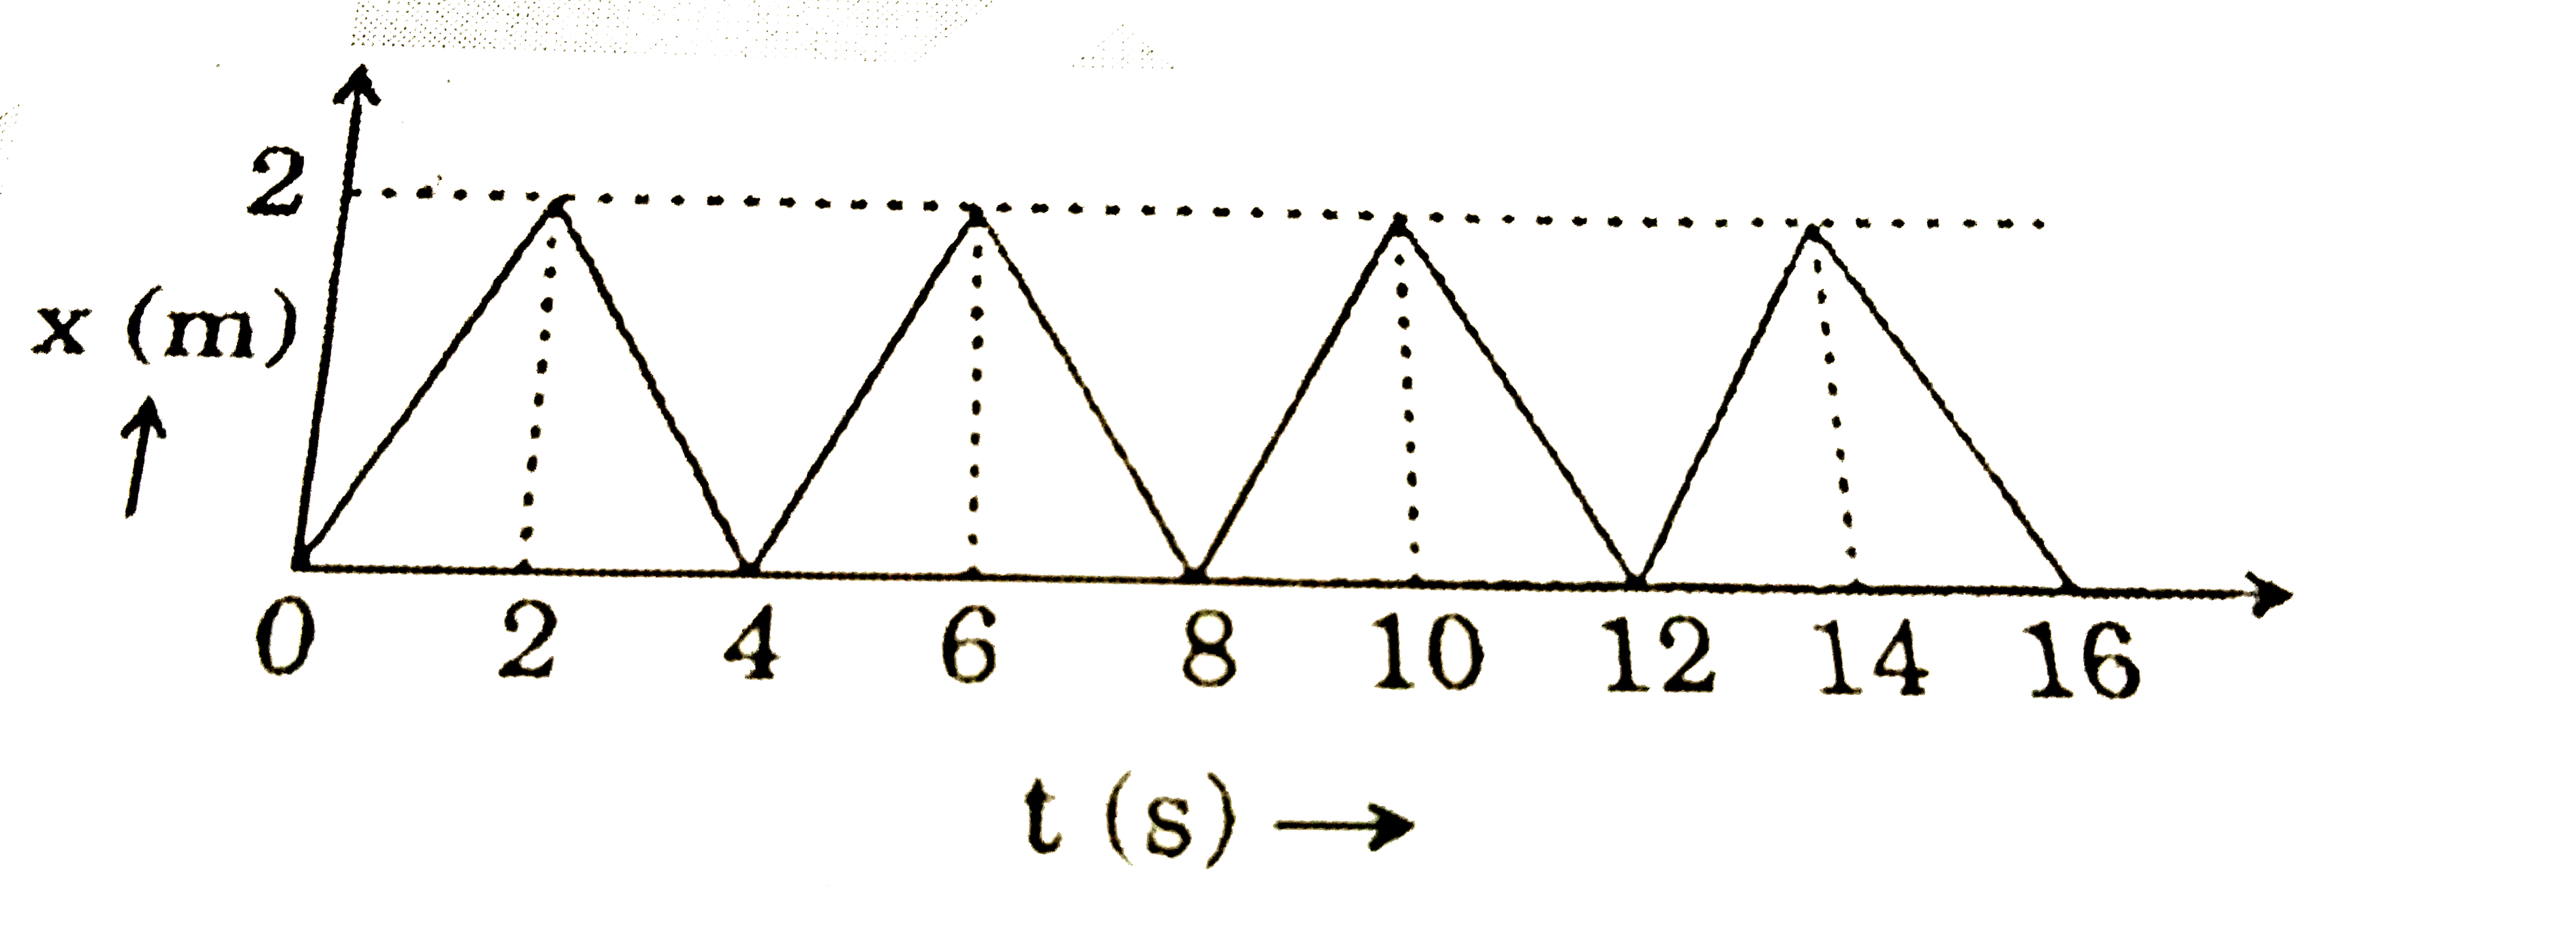
View SolutionThe figure shows the position - time (x - t) graph of one-dimensional motion of a body of mass 0.4 kg. The magnetic of each impulse is
View Solution
