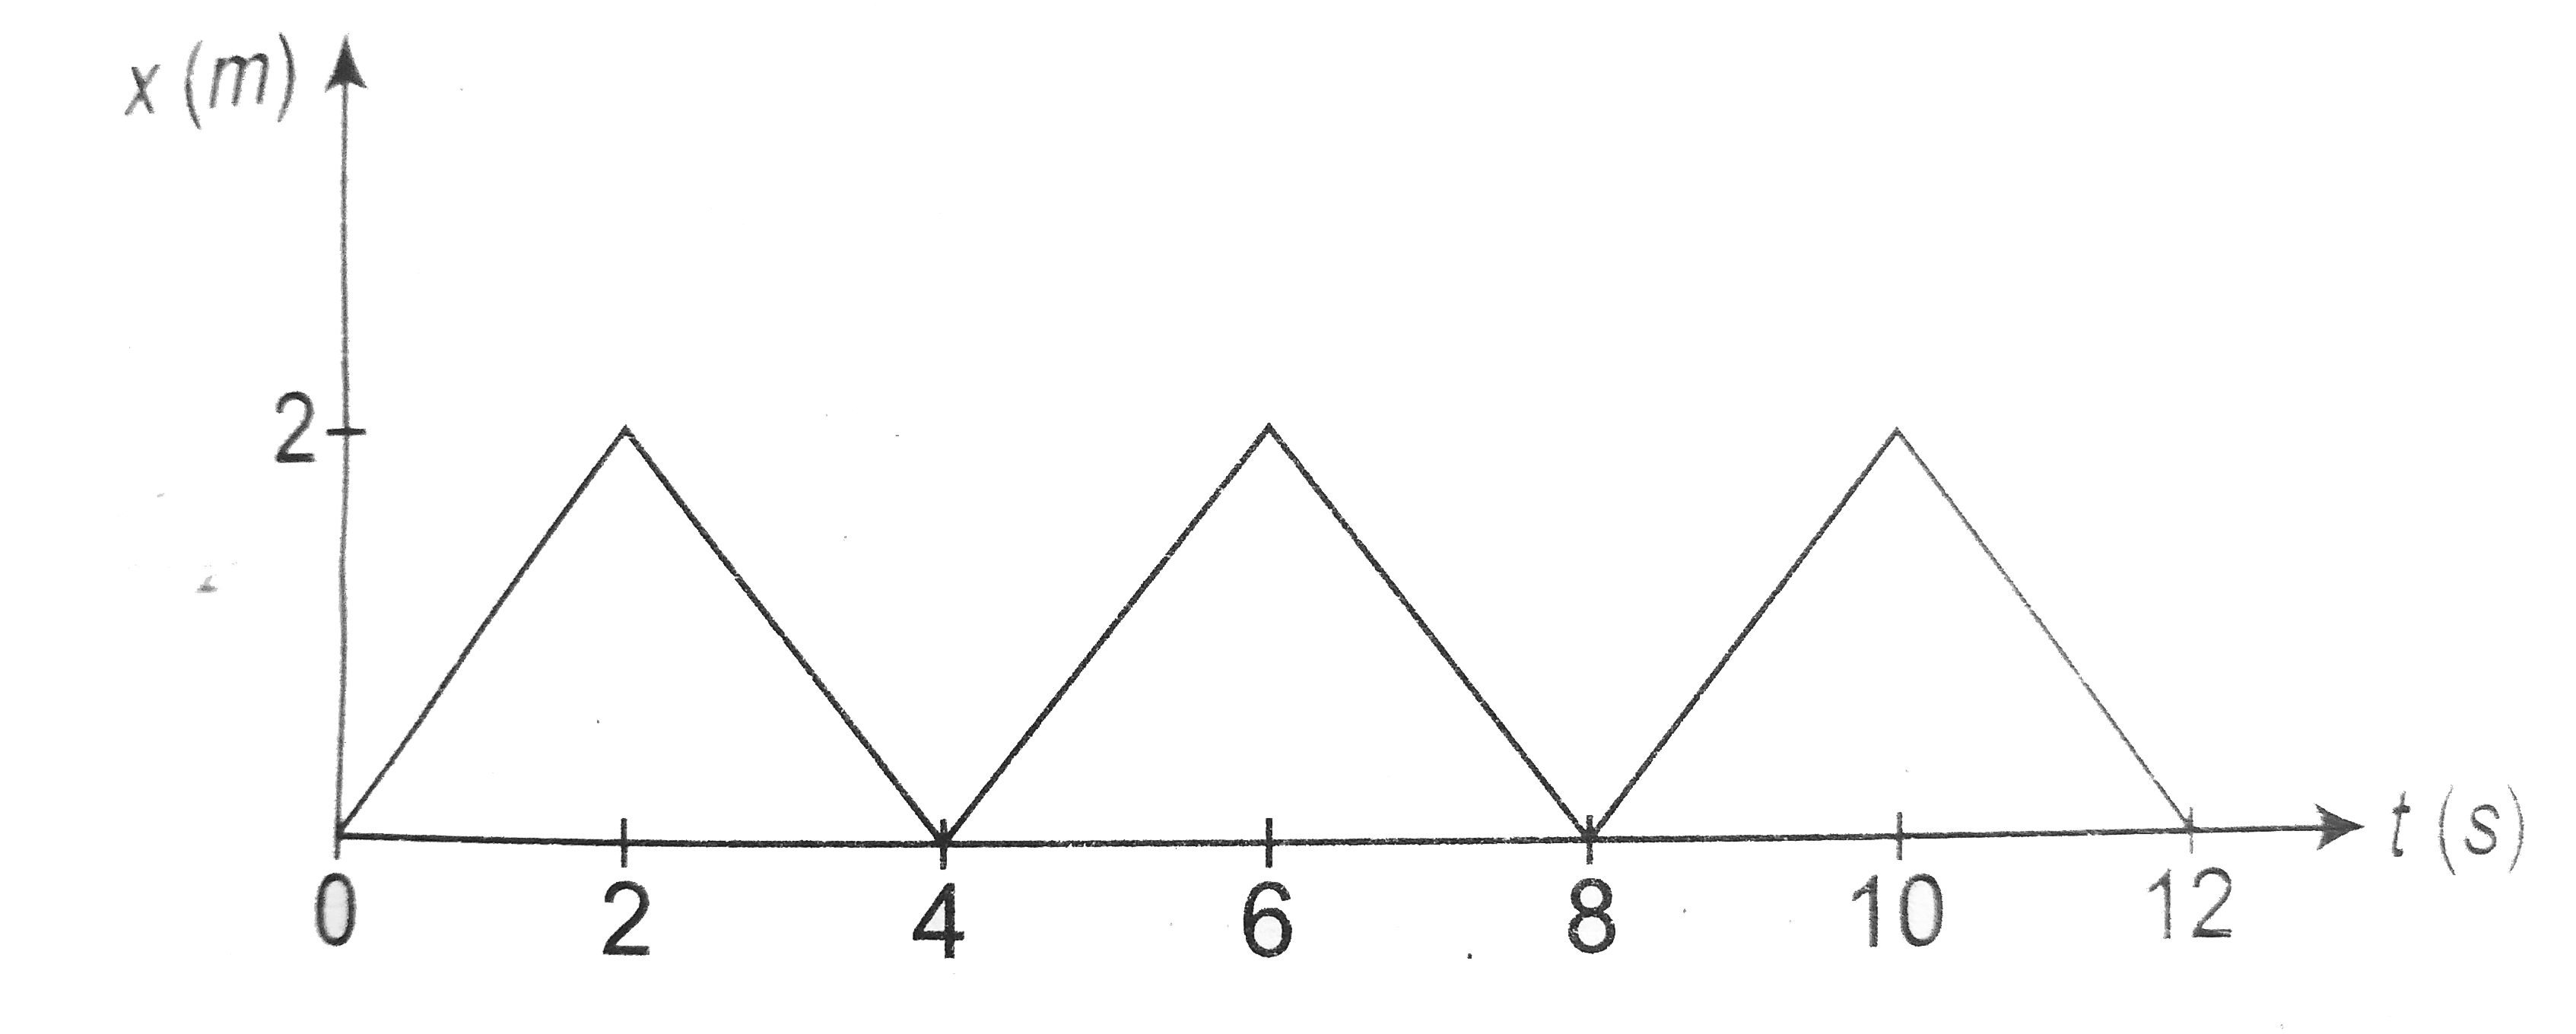
Figure shows the position-time (x-t) graph of one dimensional motion of a mass 500g. What is the time interval between two consecutive impulses received by the body?
2s
4s
6s
8s
The correct Answer is:A
Figure shows that slope of x-t graph changes from positive to negative at t=2s, and it changes from negative to positive at t=4 and so on. Thus direction of velocity is reversed after every tow seconds. Hence, the body must be receing consecutinve impulses after every two seconds.
Topper's Solved these Questions
- LAWS OF MOTIONBook:NCERT FINGERTPS ENGLISHChapter:LAWS OF MOTIONExercise:HOTS
Explore 8 Videos
- LAWS OF MOTIONBook:NCERT FINGERTPS ENGLISHChapter:LAWS OF MOTIONExercise:Exemplar Problems
Explore 9 Videos
- KINETIC THEORYBook:NCERT FINGERTPS ENGLISHChapter:KINETIC THEORYExercise:Assertion And Reason
Explore 10 Videos
- MECHANICAL PROPERTIES OF FLUIDSBook:NCERT FINGERTPS ENGLISHChapter:MECHANICAL PROPERTIES OF FLUIDSExercise:NCERT Exemplar
Explore 5 Videos
Similar Questions
The figure shows the position - time (x - t) graph of one-dimensional motion of a body of mass 0.4 kg. The magnetic of each impulse is
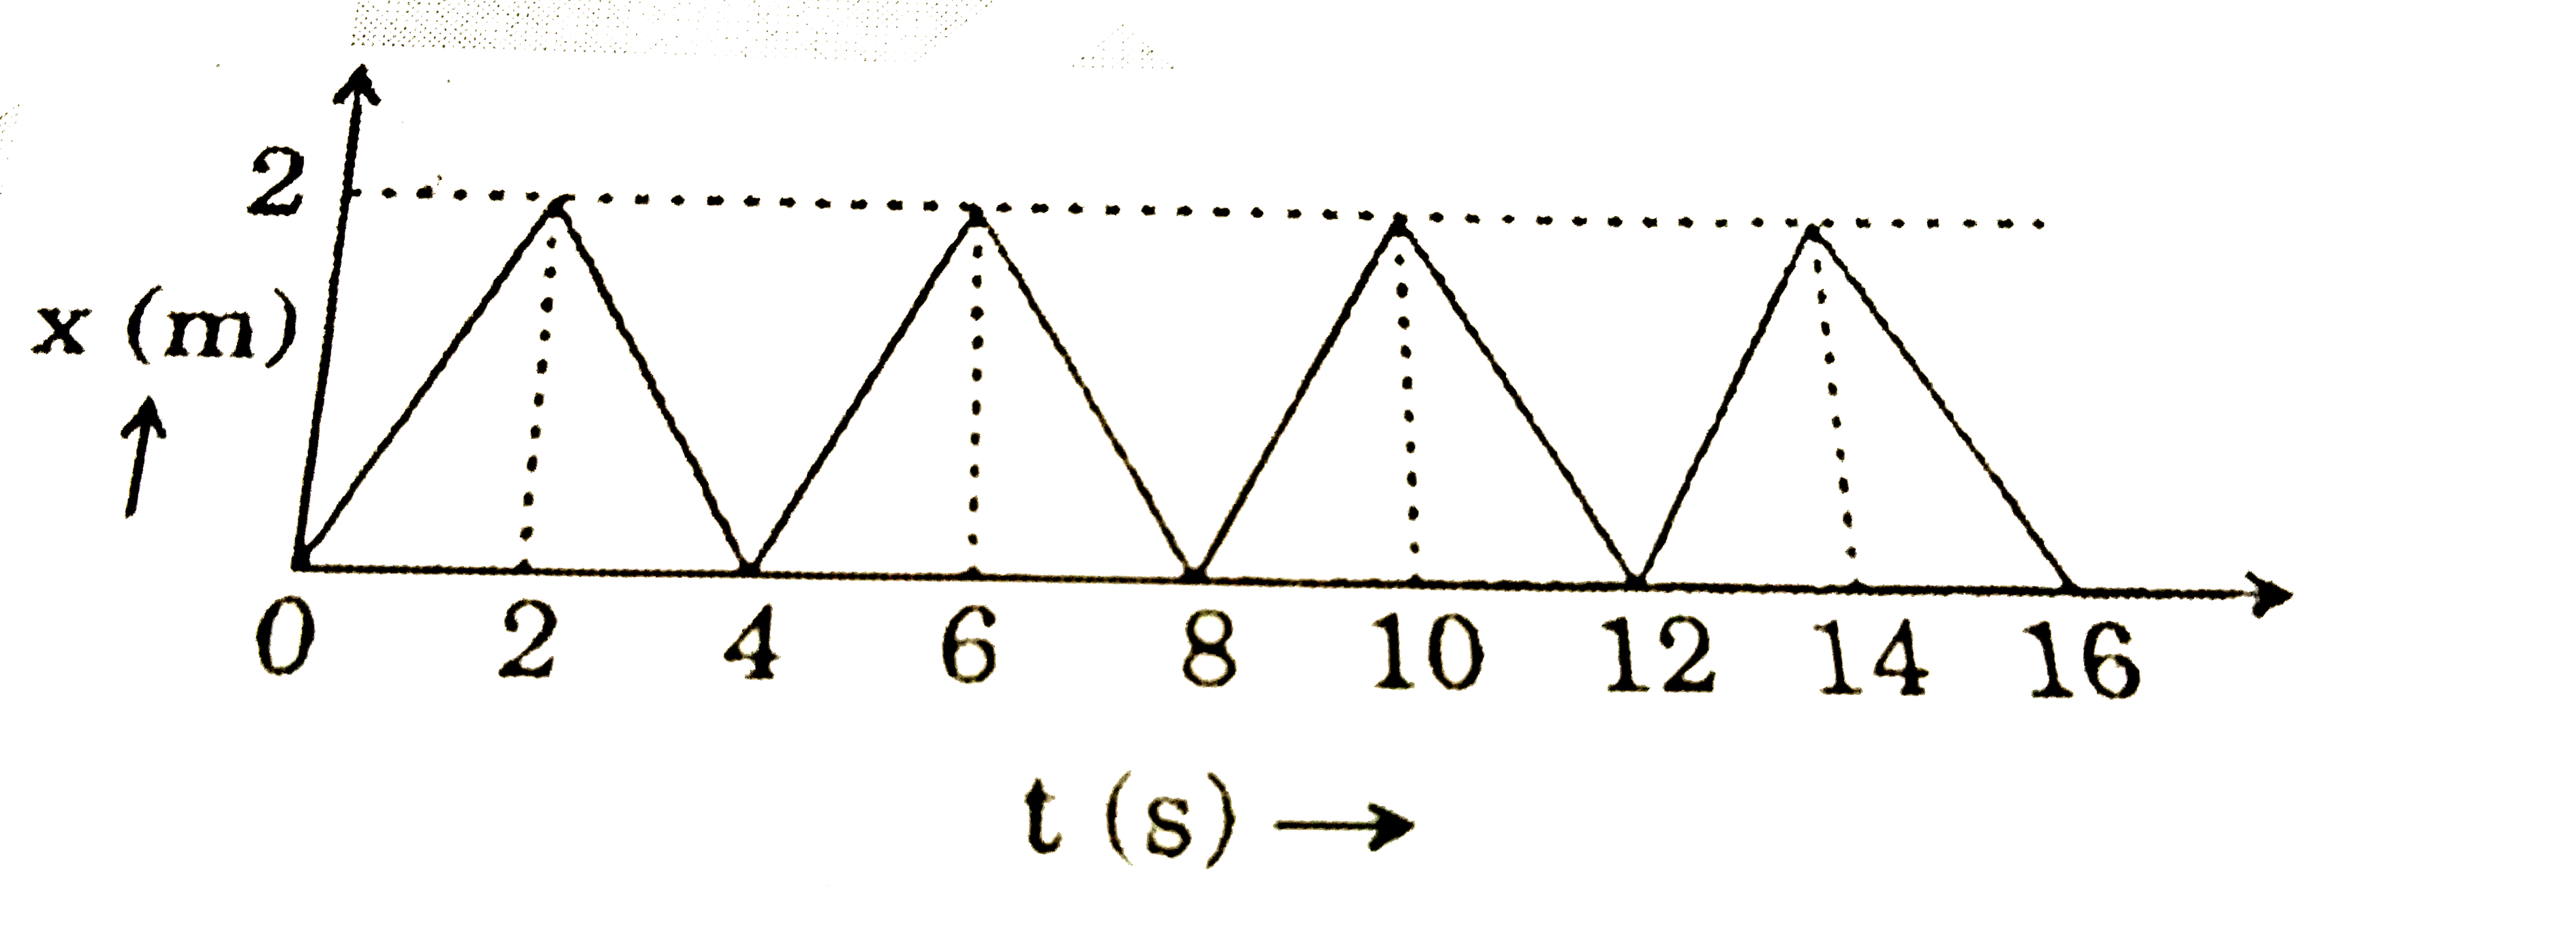
View SolutionThe figure shows the position time graph of a particle of mass 40 kg. What is the force acting on the particle of 0<t<4 s
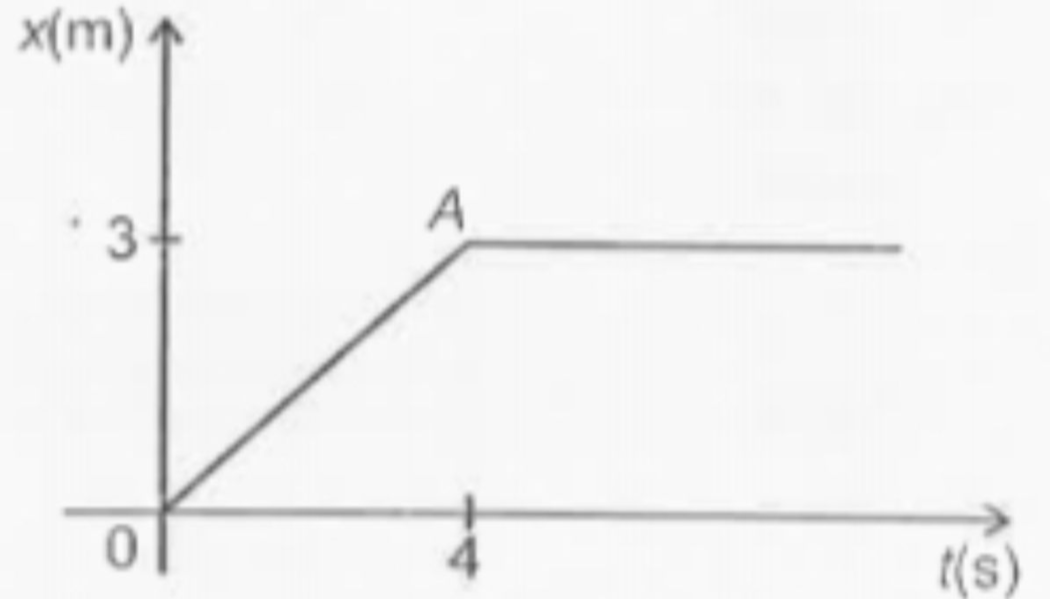
View SolutionFigure shows the position-time graph of a particle of mass 0.04kg. Suggest a suitable physical context for this motion. What is the time between two consecutive impulses received by the particle? What is the magnitude of each impulse?
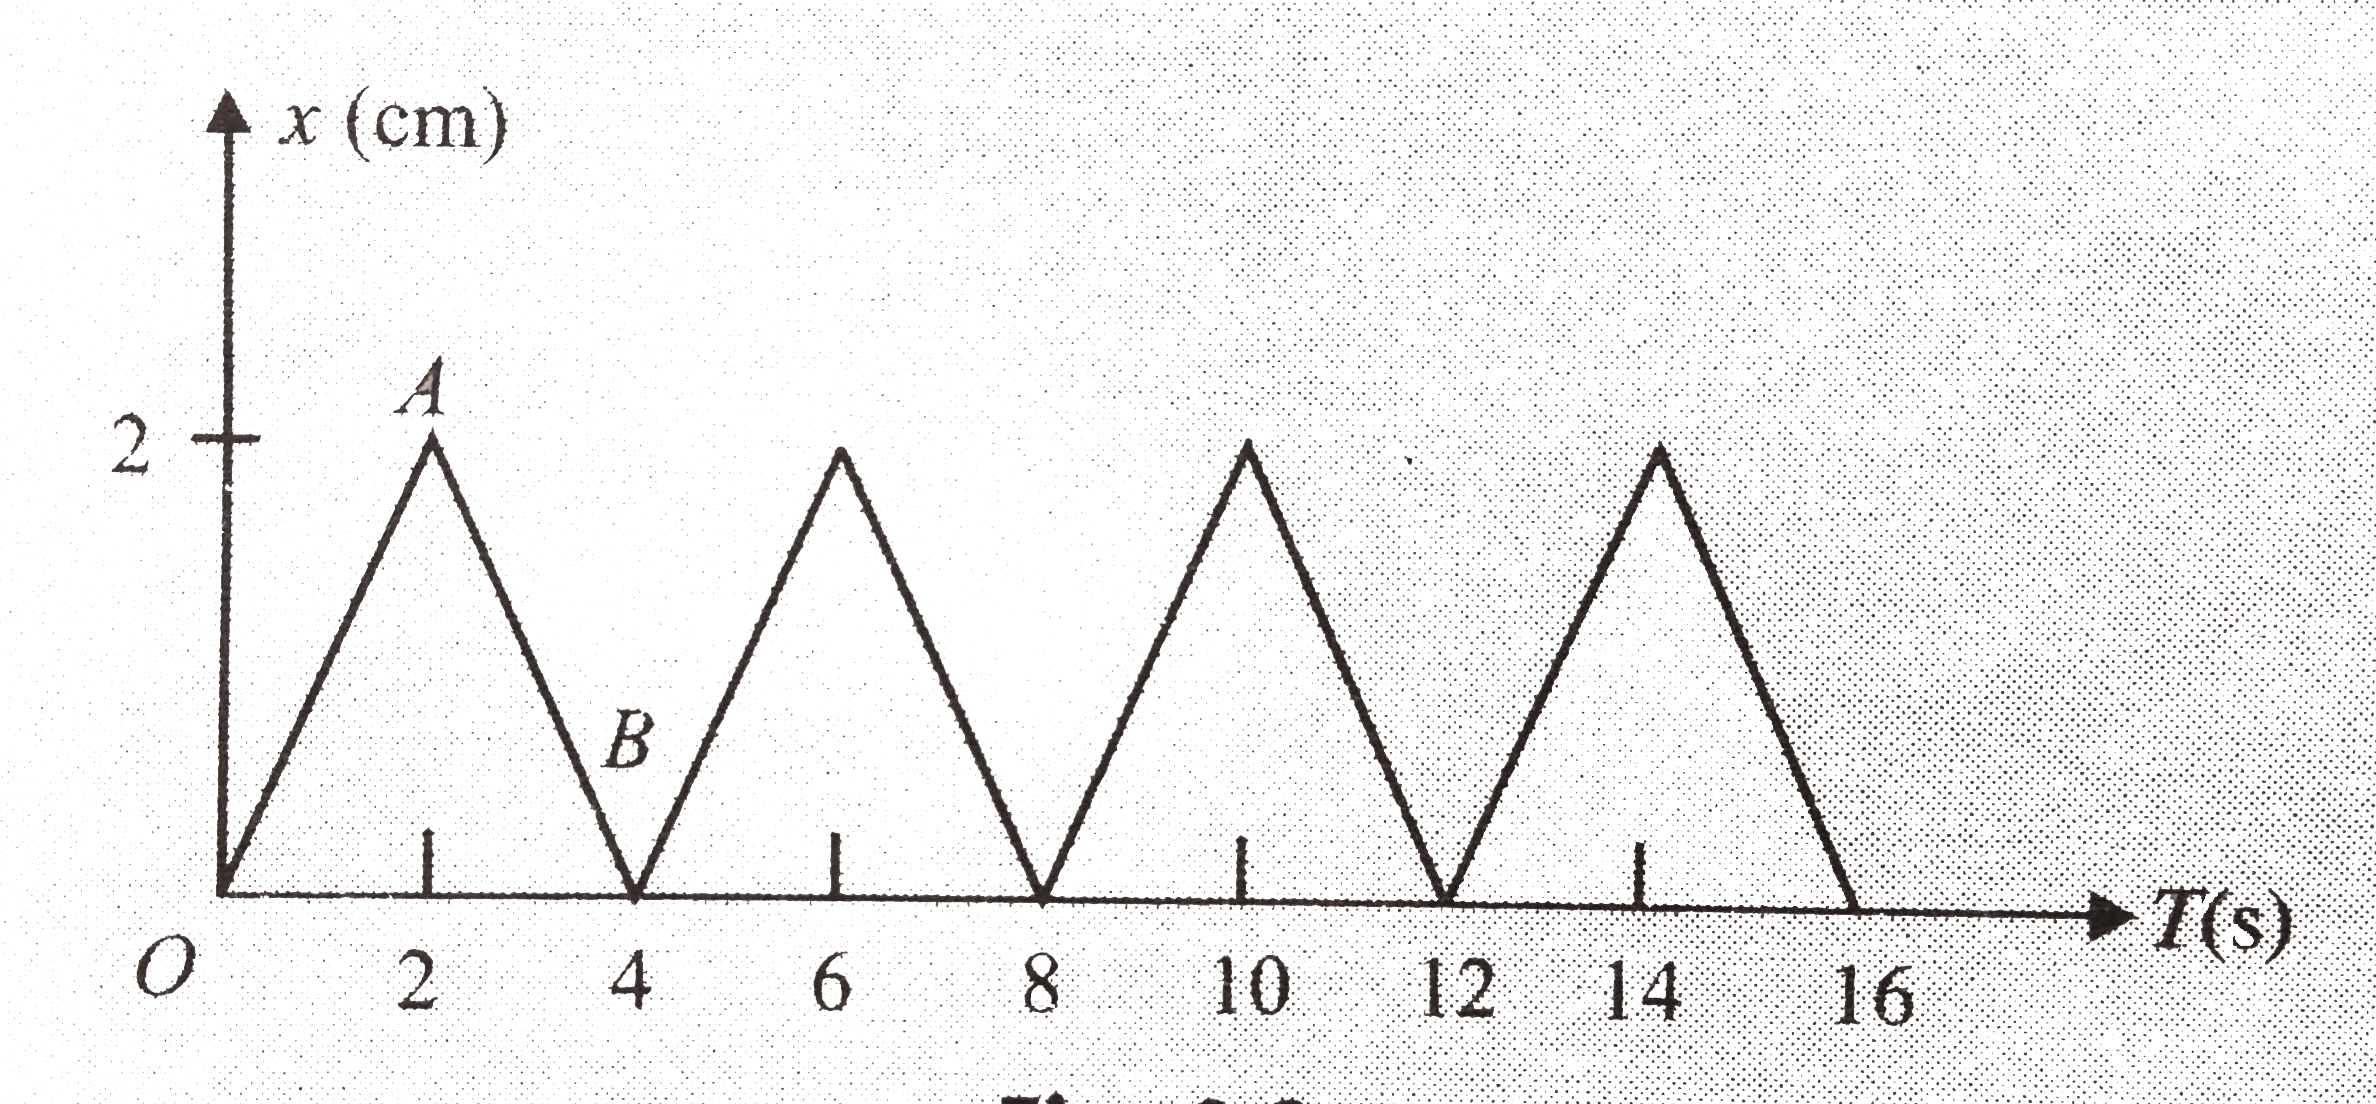
View SolutionFigure shows the position-time graph of a particle of mass 0.04kg. Suggest a suitable physical context for this motion. What is the time between two consecutive impulses received by the particle? What is the magnitude of each impluse?

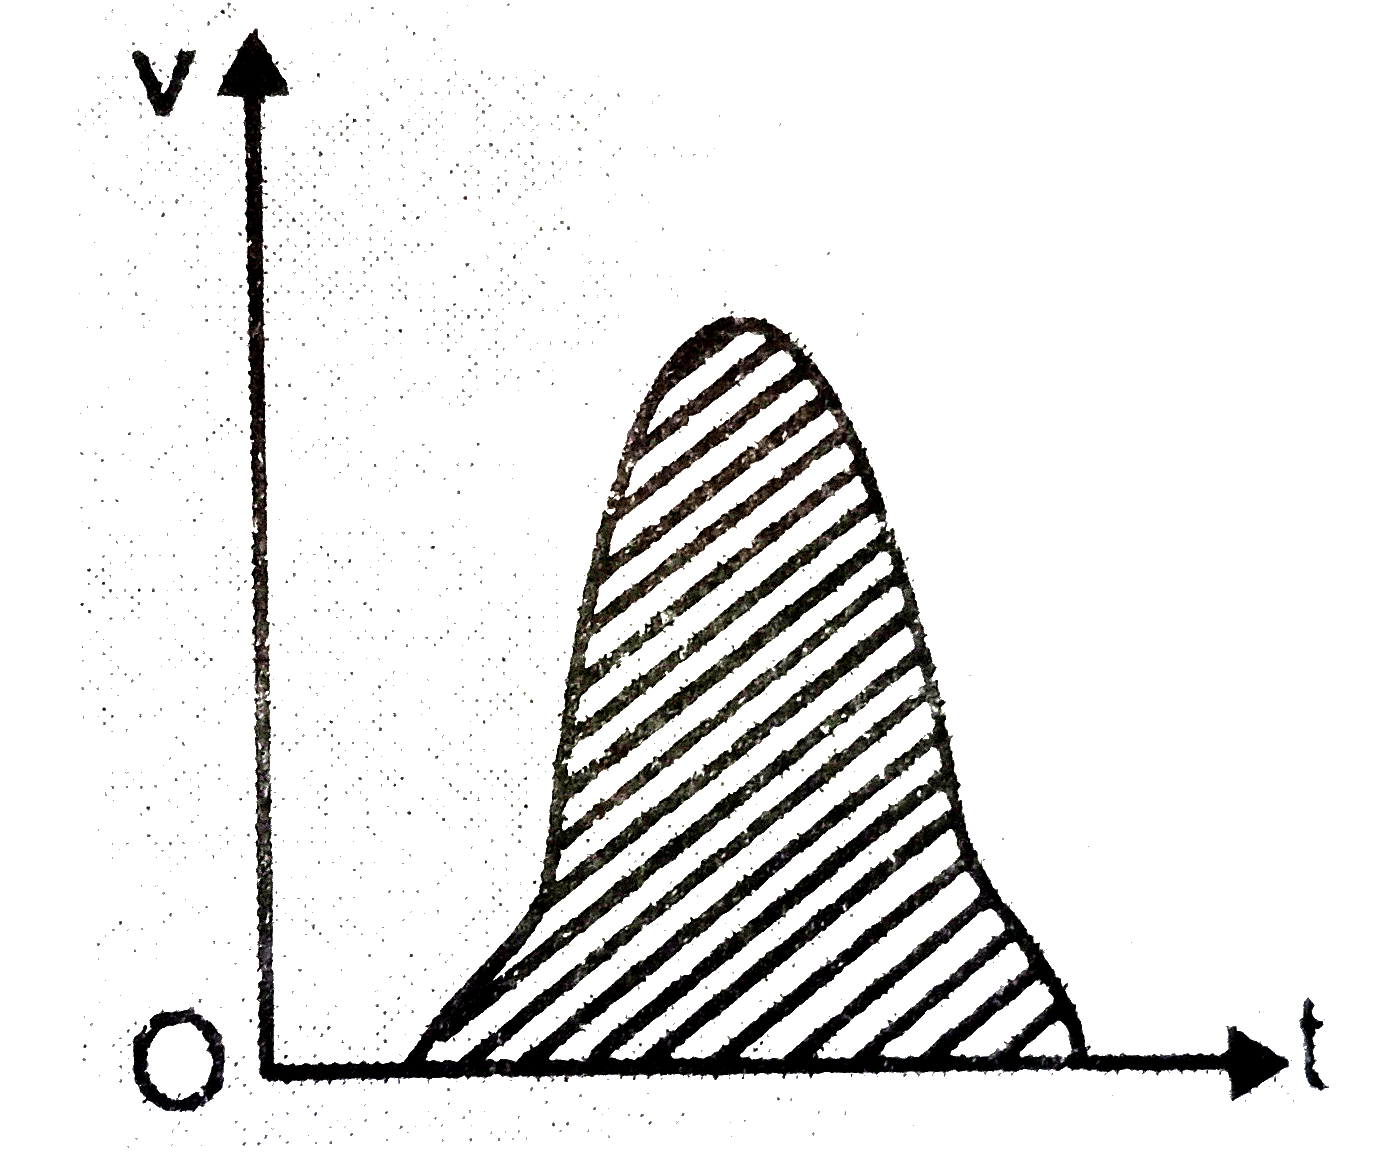
View SolutionFigure below shows the velocity-time graph of a one dimensional motion. Which of the following characteristic of the particle is represented by the shaded area?
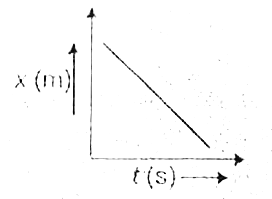
View SolutionThe position - time (x−t) graph of an object in uniform motion is shown below, the velocity of object is
View SolutionFigure shows the displacement-time graph of a particle moving on the X-axis

View SolutionFigure shows the displacement time graph of a particle moving on the X-axis

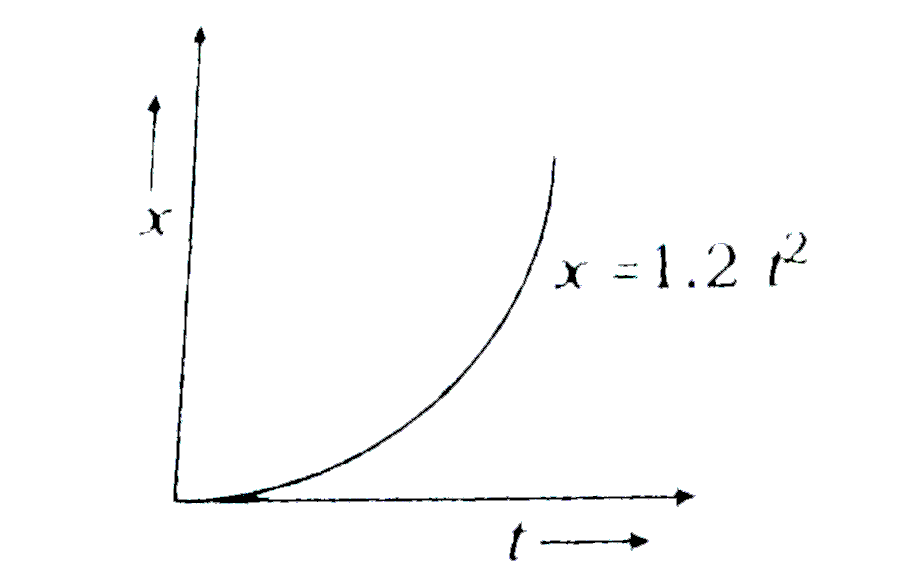
View SolutionFigure shows the position -time graph of an object in SHM. The correct equation representing this motion is

View SolutionFigure given shows the distance - time graph of the motion of a car. It follows from the graph that the car is
View Solution

