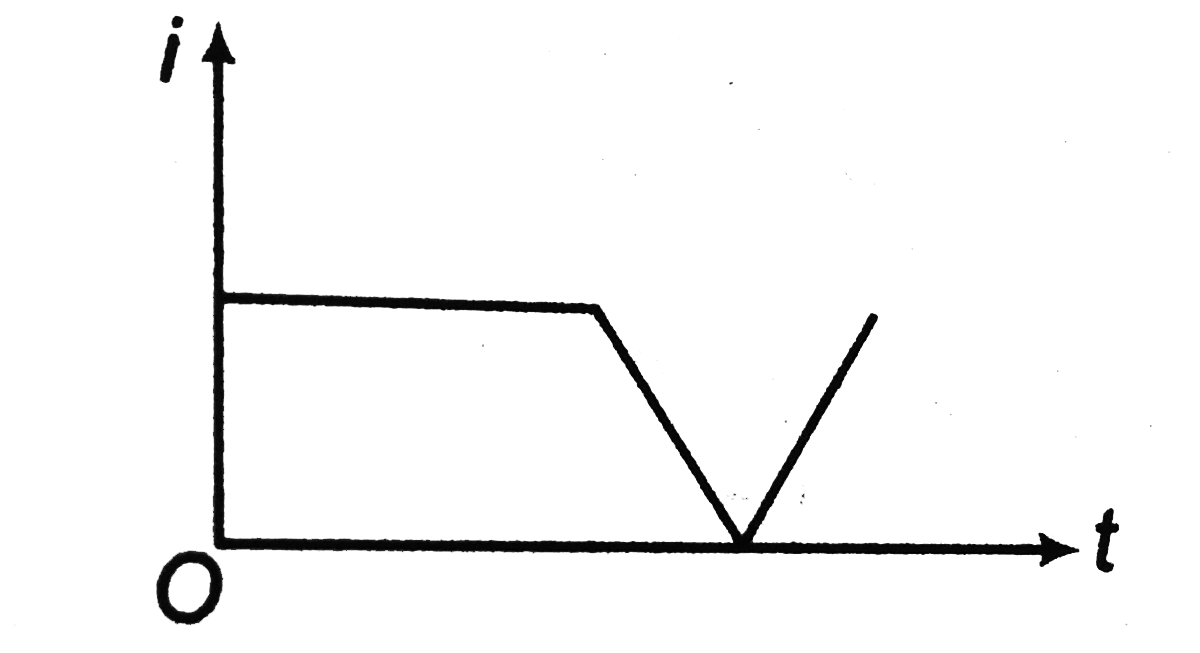
The current (I) in the inductance is varying with time according to the plot shown in figure.
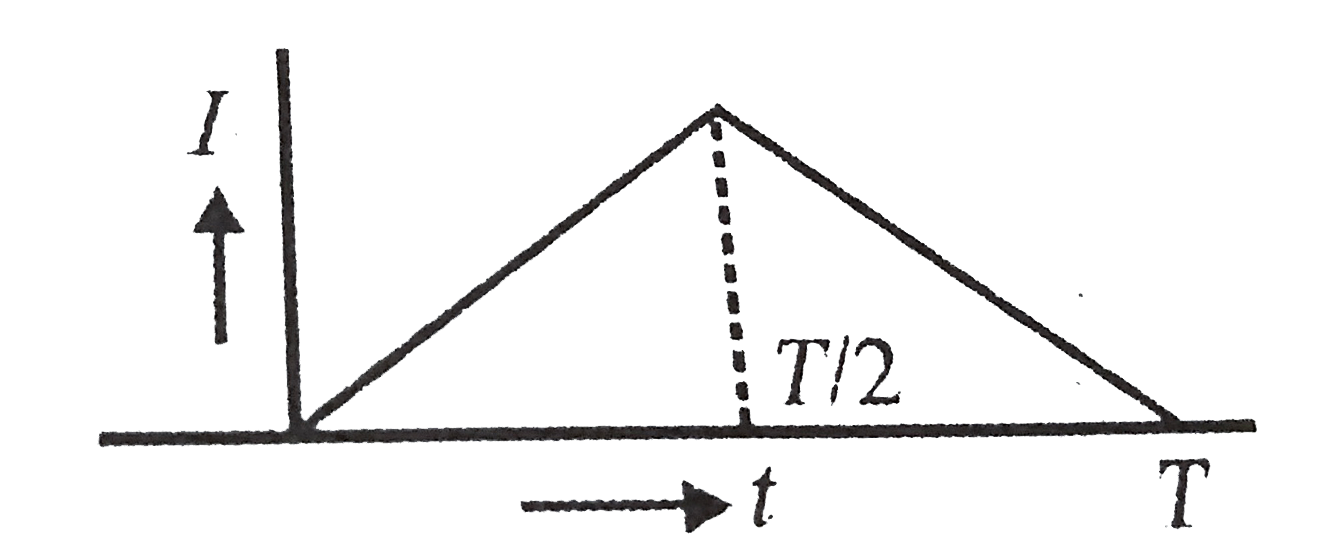
Which one of the following is the correct variation of voltage with time in the coil?
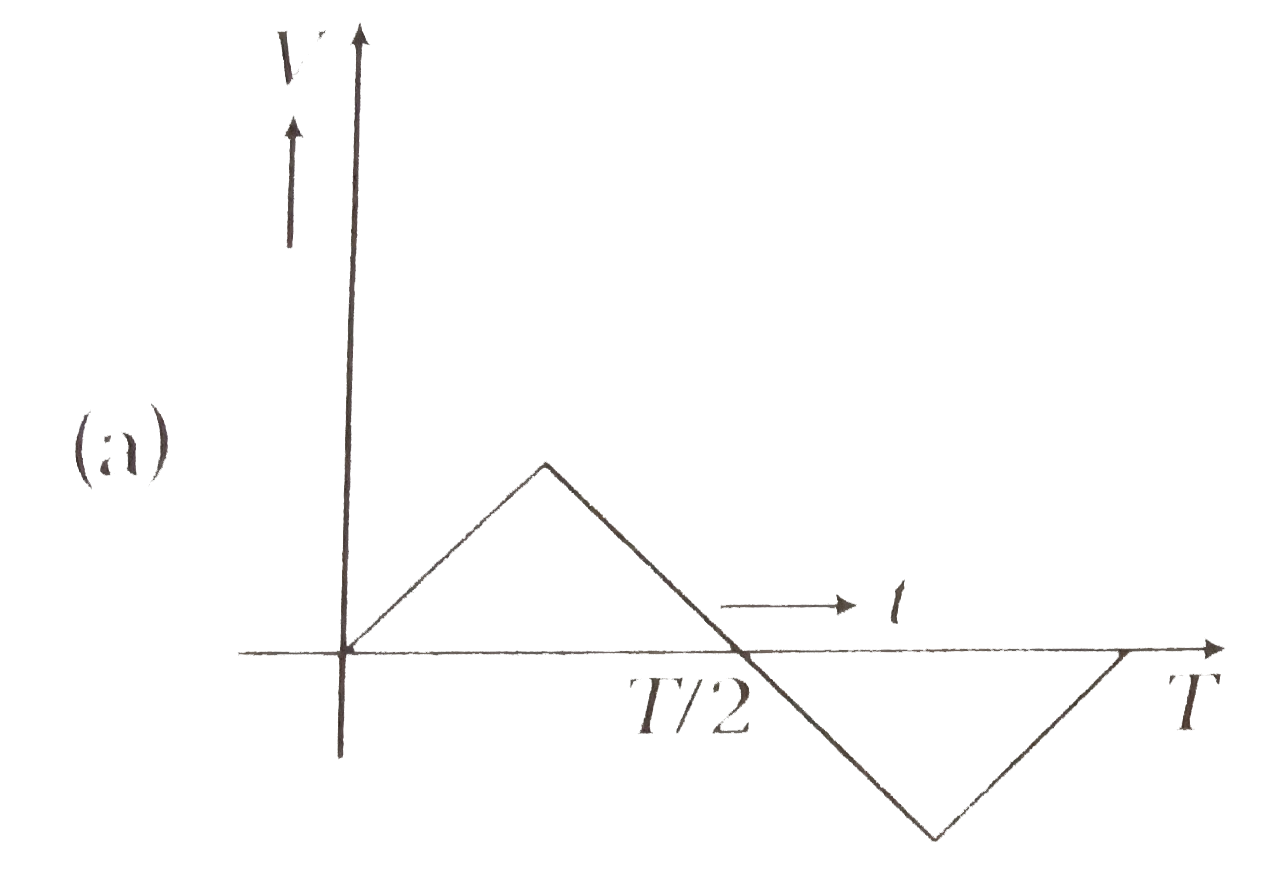
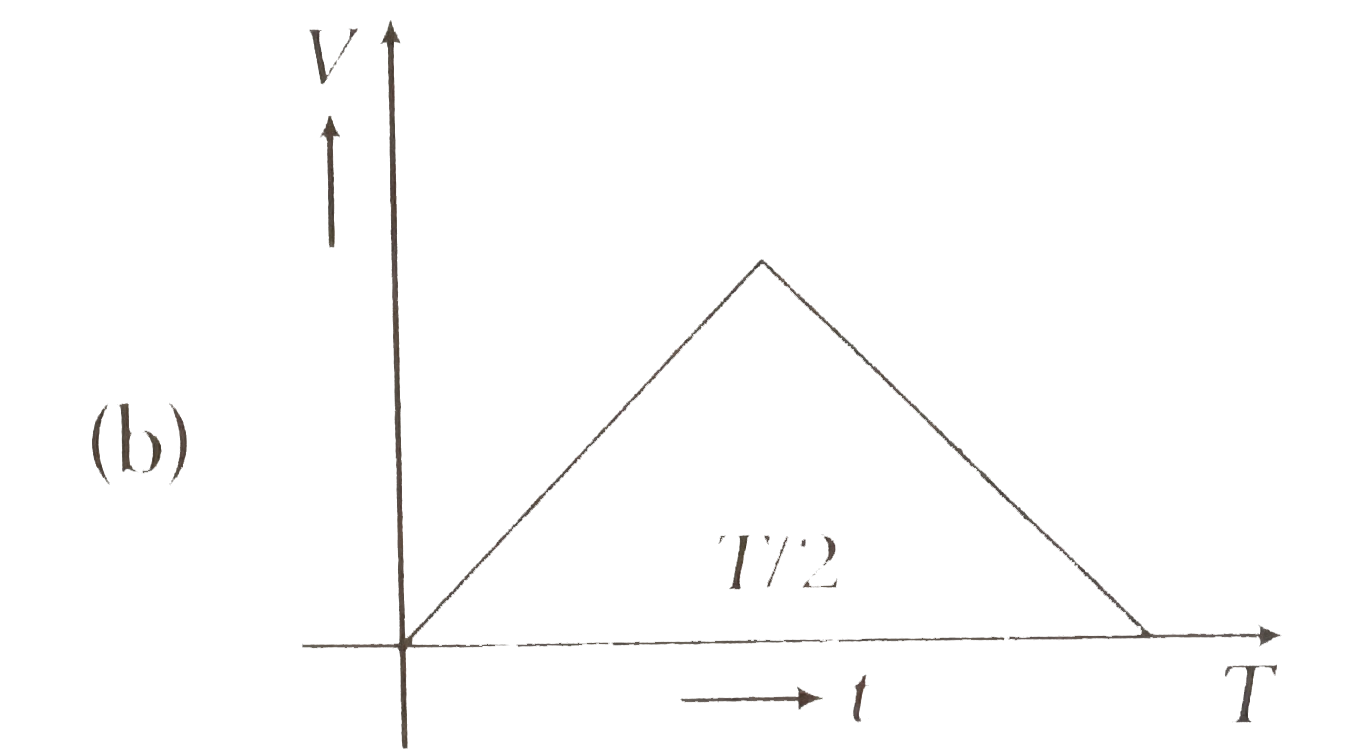
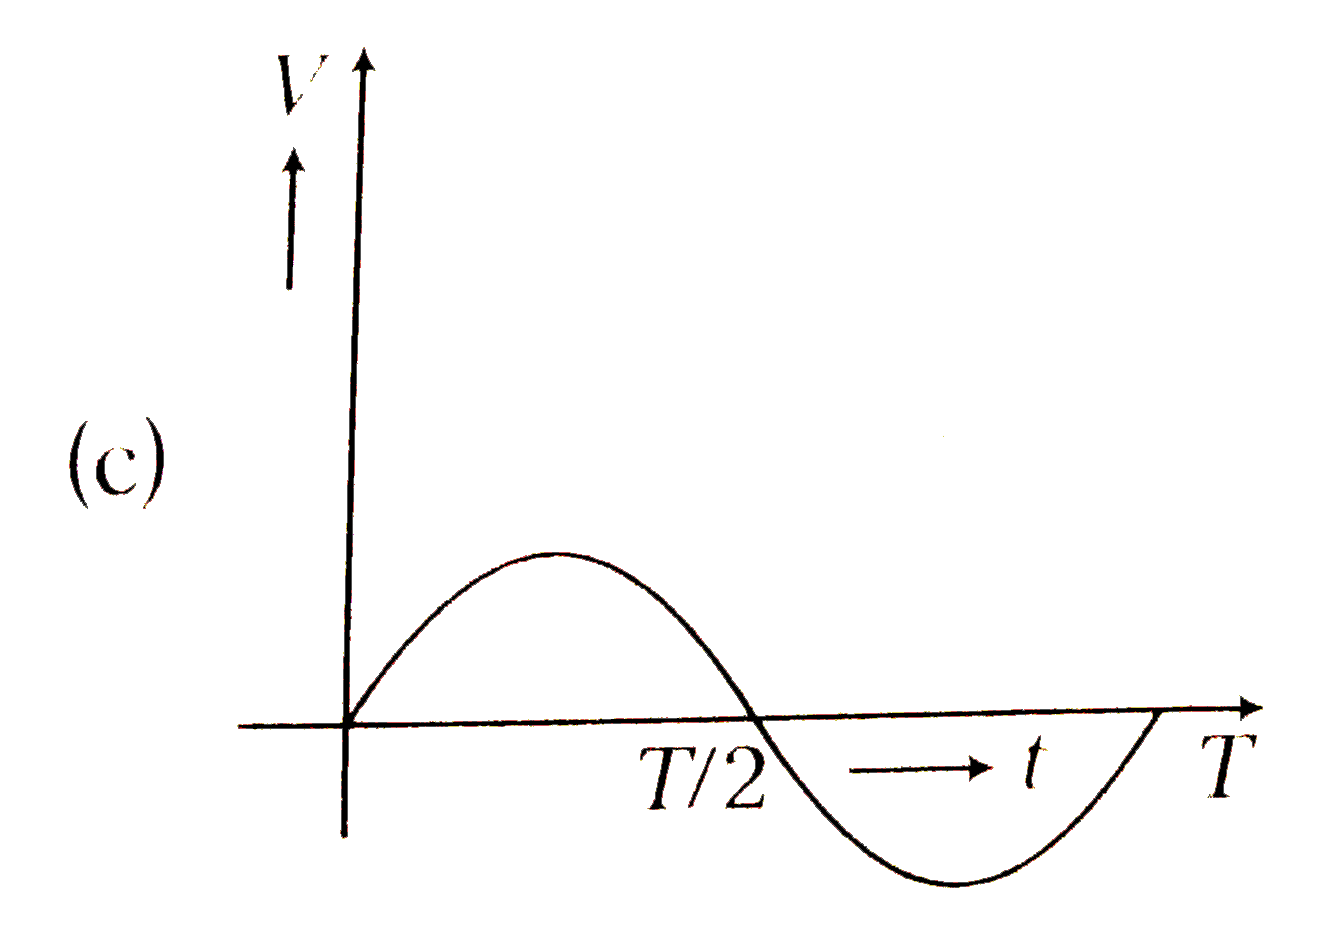
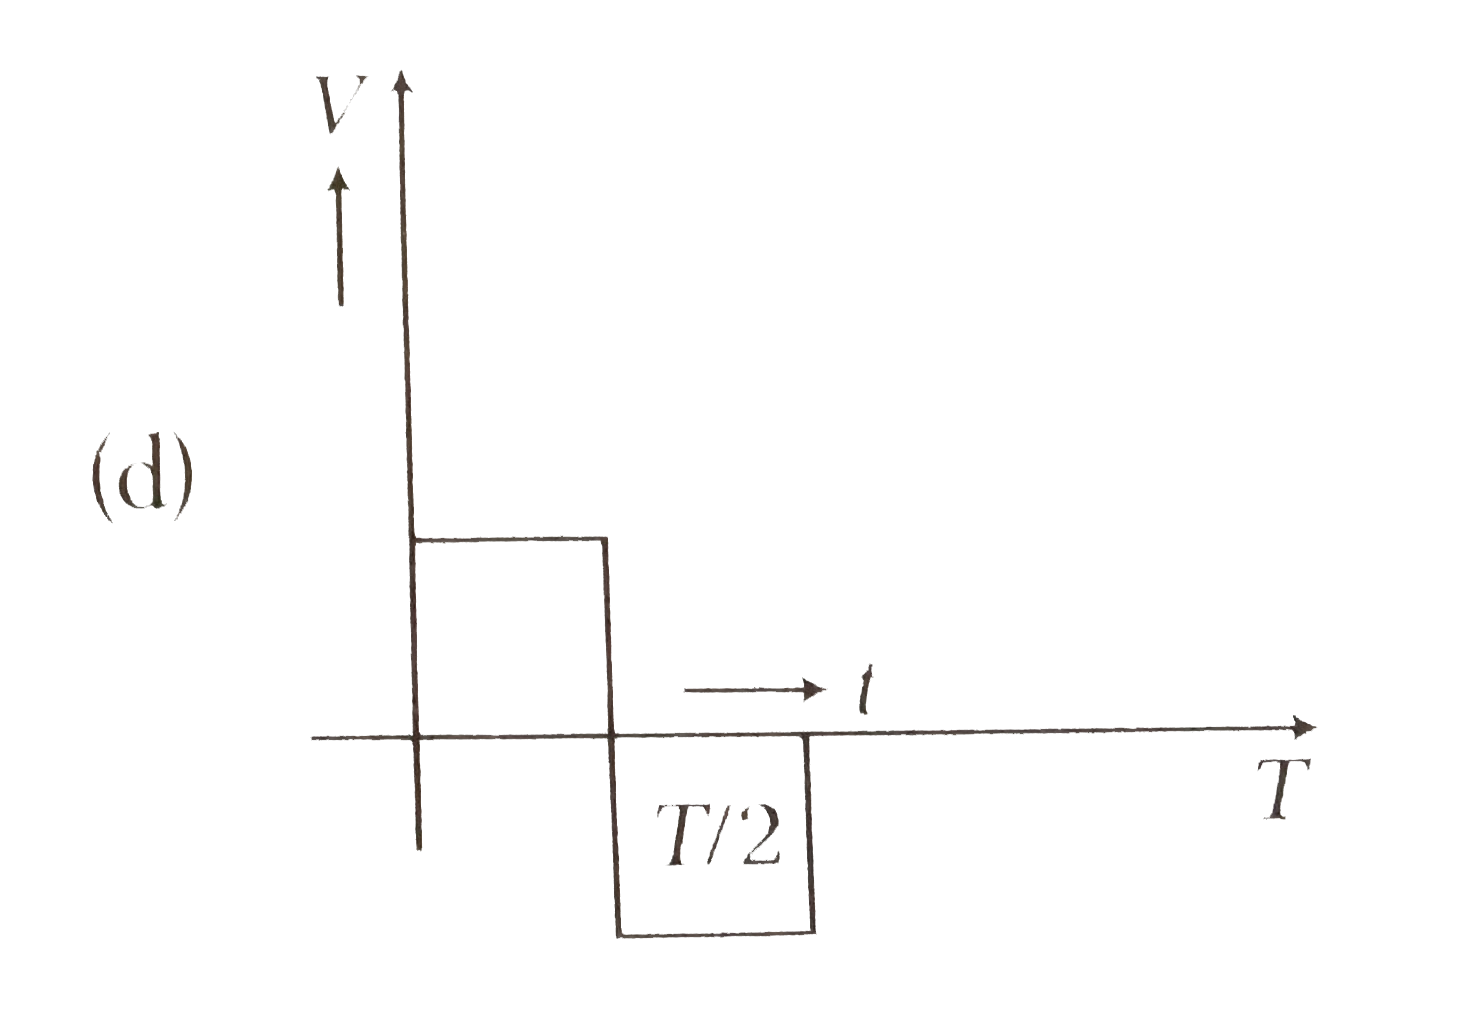
The correct Answer is:D
For inductor as we know indiced voltage
For t = 0 to t = T/2
V=LdIdt=Lddt(2I0tT) = constant
For t = T/2 to t = T
V=LdIdt(−2I0tT)= constant
Therefore, anwer will represent by graph (d).
Topper's Solved these Questions
- ELECTROMAGNETIC INDUCTIONBOOK - DC PANDEY ENGLISHCHAPTER - ELECTROMAGNETIC INDUCTIONEXERCISE - Match the columns
5 Videos
- CURRENT ELECTRICITYBOOK - DC PANDEY ENGLISHCHAPTER - CURRENT ELECTRICITYEXERCISE - Medical entrances gallery
97 Videos
- ELECTROMAGNETIC WAVESBOOK - DC PANDEY ENGLISHCHAPTER - ELECTROMAGNETIC WAVESEXERCISE - Sec C
22 Videos
Similar Questions
The current I in an inductance coil varies with time according to the graph given in the figure.
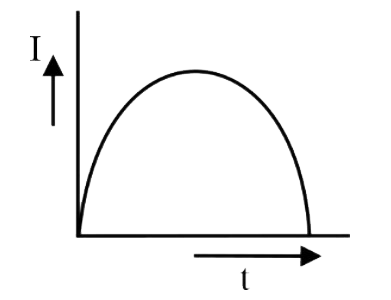
Which one of the following graphs gives the variation of voltage with time across the inductor?
View SolutionAn alternating current I in an inductance coil varies with time t according to the graph as shown: Which one of the following graph gives the variation of voltage with time?
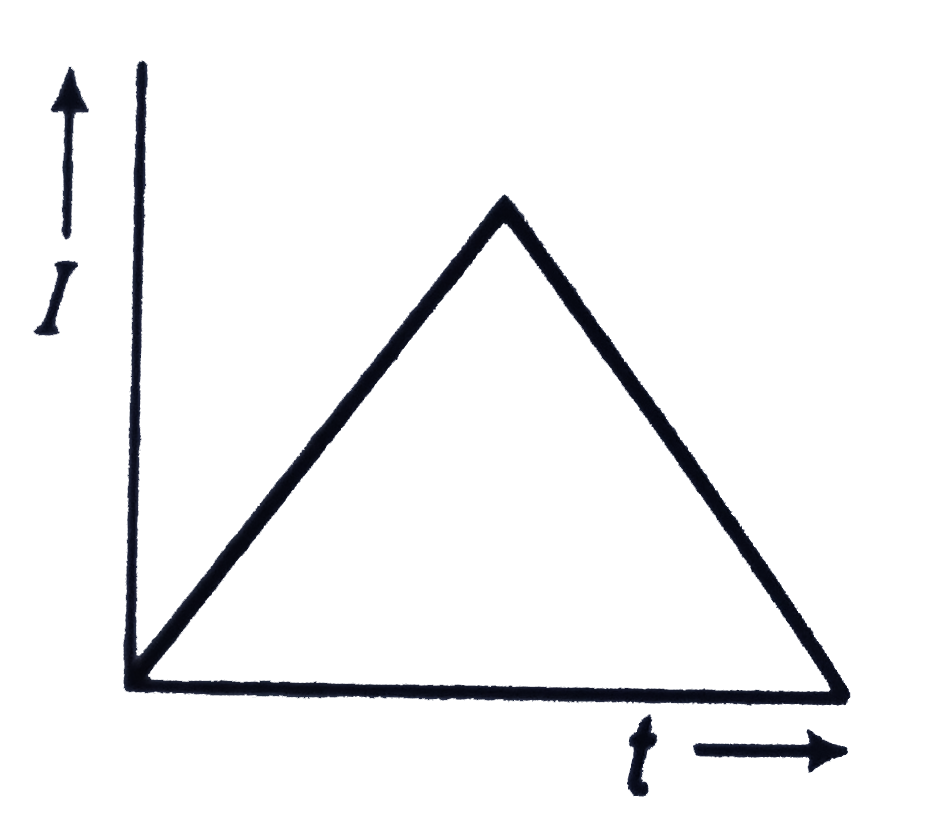
View SolutionAn alternating current I in an inductance coil varies with time t according to the graph as shown: Which one of the following graph gives the variation of voltage with time?

View SolutionThe current i in an induction coil varies with time according to the graph shown in figure. Which of the following graph shows induced emf in the coil with time:
View SolutionThe current i in an induction coil varies with time t according to the graph shown in the figure-5.250. Which of the following graphs shows the induced EMF in the coil with time ?
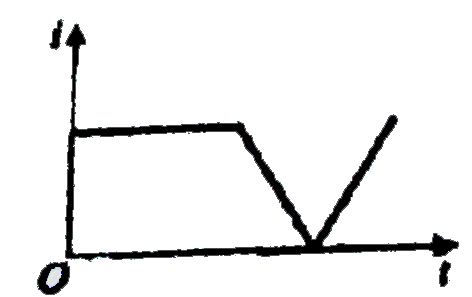
View SolutionThe current i in an inductionn coil varies with time t according to the graph shown in the figure. Which of the following grahs shows athe induced emf (ε) in the coil with time?
View SolutionThe current i in an inductionn coil varies with time t according to the graph shown in the figure. Which of the following grahs shows athe induced emf (ε) in the coil with time?

View SolutionA force F varies with time in accordance with the following figure. The mean force for one cycle:

View SolutionThe graph shown the variation with times t of the velocity v of an object . Which one of the following graphs best represents the variation of acceleration a of the object with time t?

View SolutionX, Y and Z react in the 1:1:1 stoichiometric ratio.
The concentration of X, Y and Z we are found to vary with time as shown in the figure below:

Which of the following equilibrium reaction represents the correct variation of concentration with time?
View Solution
