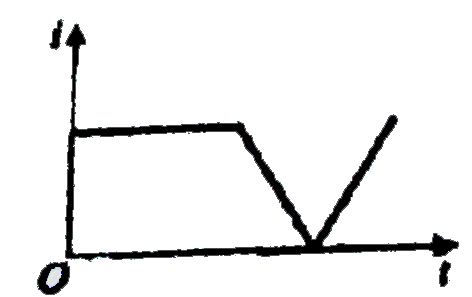
The current I in an inductance coil varies with time according to the graph given in the figure.
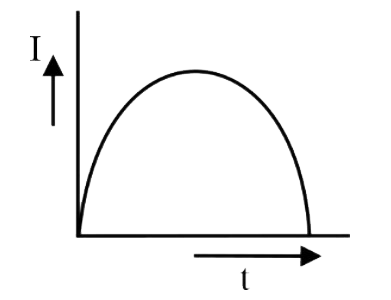
Which one of the following graphs gives the variation of voltage with time across the inductor?
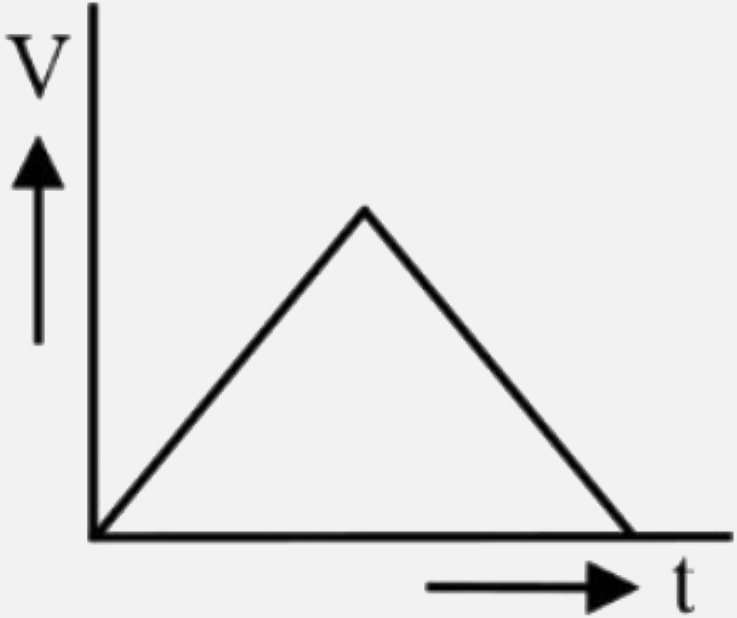
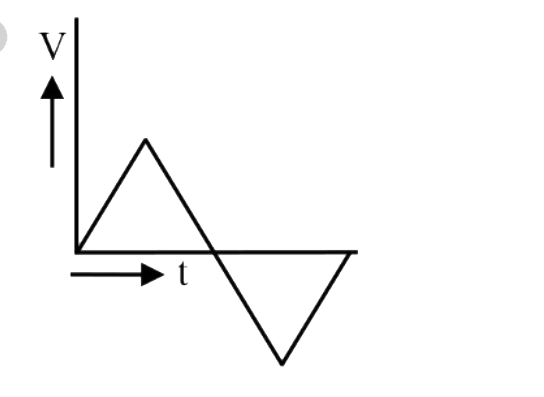
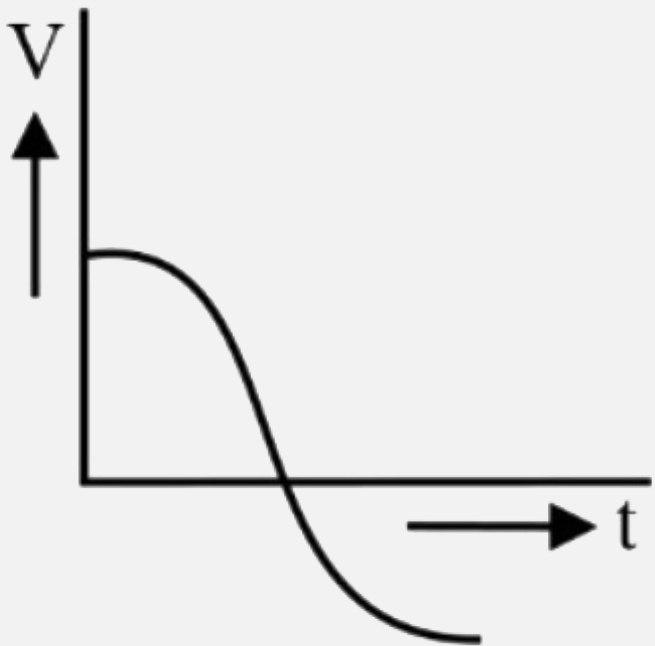
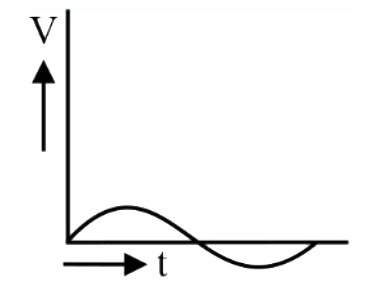
The correct Answer is:C
Step by step video & image solution for The current I in an inductance coil varies with time according to the graph given in the figure. Which one of the following graphs gives the variation of voltage with time across the inductor? by Physics experts to help you in doubts & scoring excellent marks in Class 12 exams.
Updated on:21/07/2023Similar Questions
An alternating current I in an inductance coil varies with time t according to the graph as shown: Which one of the following graph gives the variation of voltage with time?
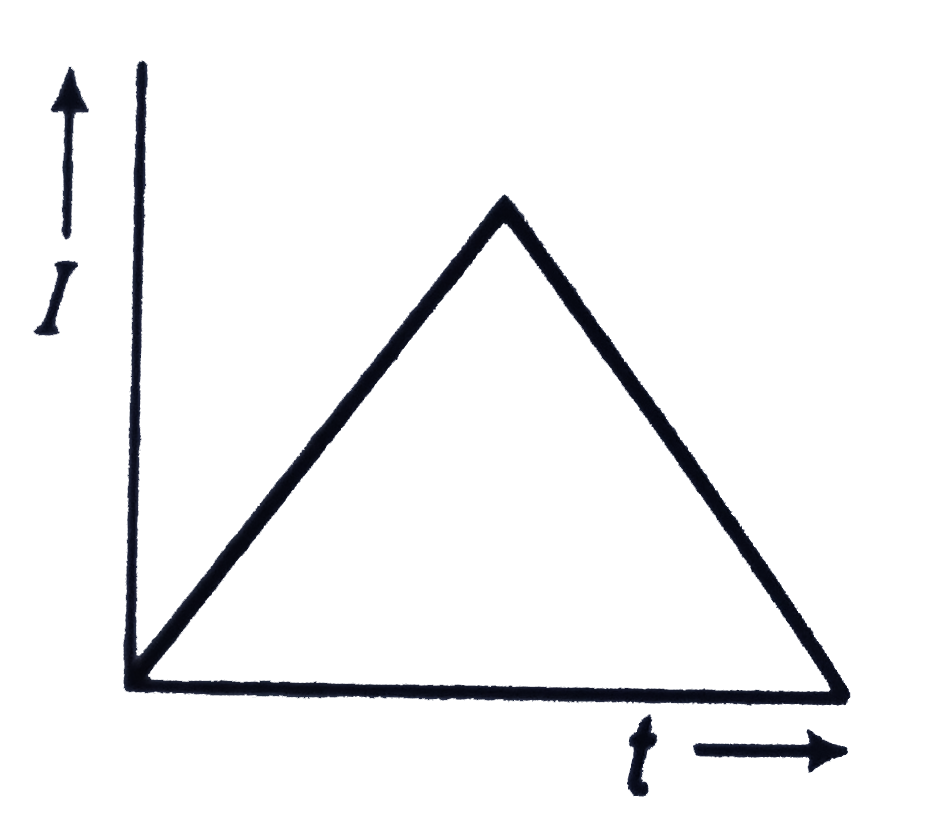
View SolutionAn alternating current I in an inductance coil varies with time t according to the graph as shown: Which one of the following graph gives the variation of voltage with time?

View SolutionThe current (I) in the inductance is varying with time according to the plot shown in figure.
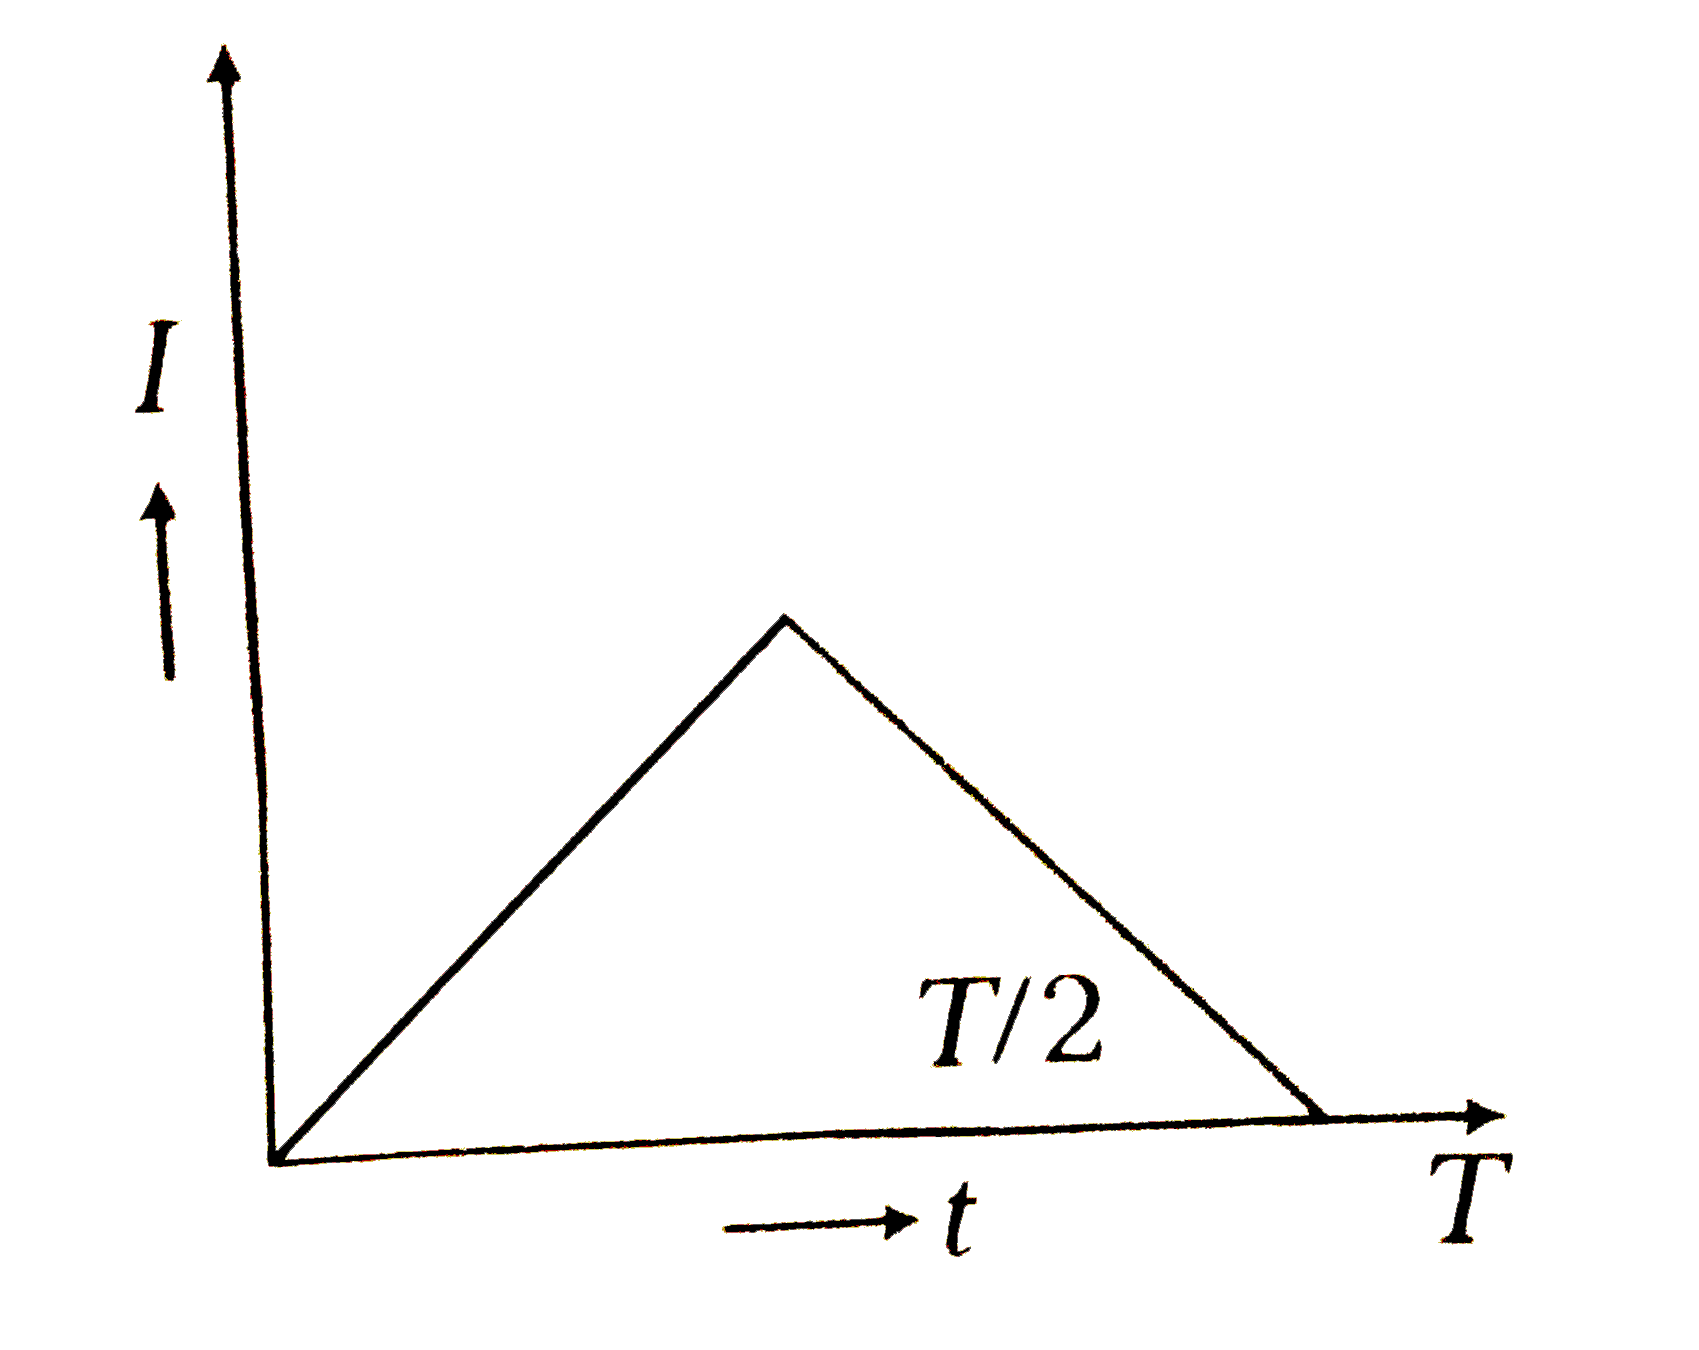
Which one of the following is the corrcet variation of voltage with time in the coil ?
View SolutionThe current (I) in the inductance is varying with time according to the plot shown in figure.
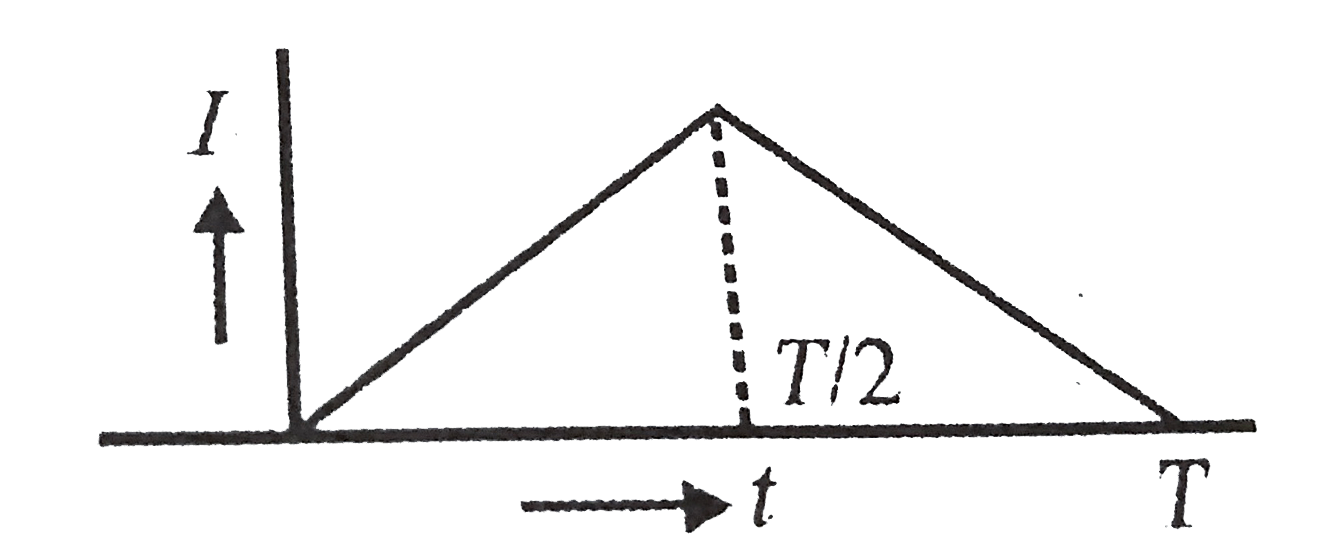
Which one of the following is the correct variation of voltage with time in the coil?
View SolutionThe current i in an induction coil varies with time t according to the graph shown in the figure-5.250. Which of the following graphs shows the induced EMF in the coil with time ?
View SolutionThe current i in an induction coil varies with time according to the graph shown in figure. Which of the following graph shows induced emf in the coil with time:
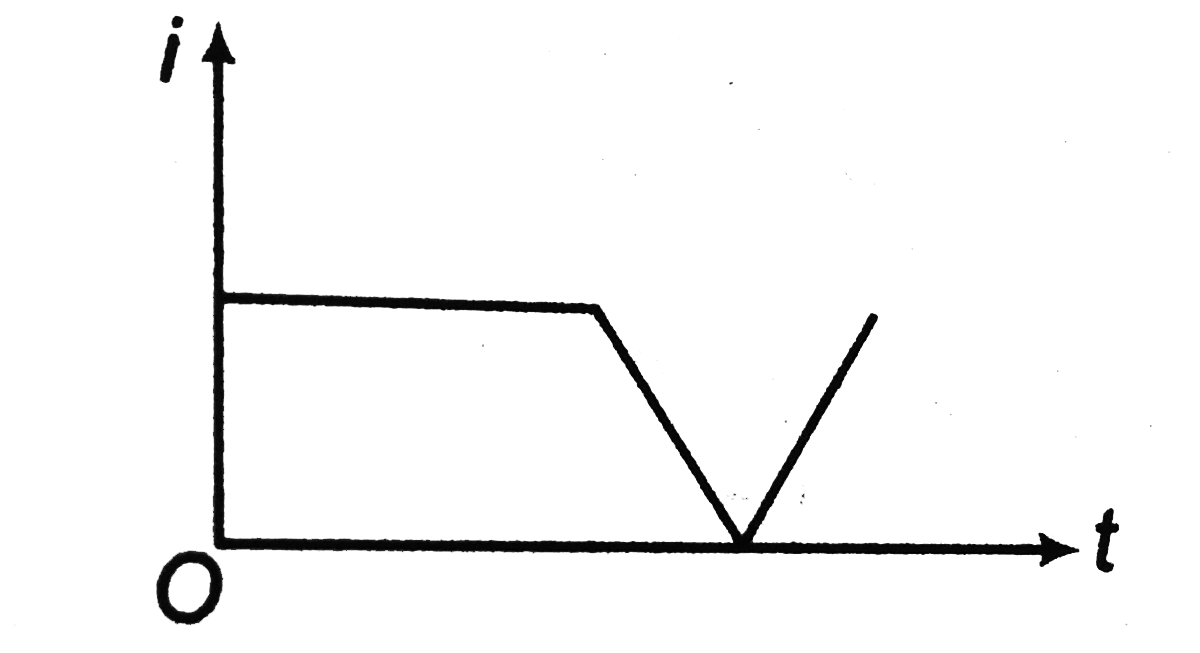
View SolutionThe current i in an inductionn coil varies with time t according to the graph shown in the figure. Which of the following grahs shows athe induced emf (ε) in the coil with time?
View SolutionThe current i in an inductionn coil varies with time t according to the graph shown in the figure. Which of the following grahs shows athe induced emf (ε) in the coil with time?

View SolutionThe graph shown the variation with times t of the velocity v of an object . Which one of the following graphs best represents the variation of acceleration a of the object with time t?

View SolutionThe current in a coil varies with time as shown in the figuro. The variation of induced emf with time would be
View Solution

