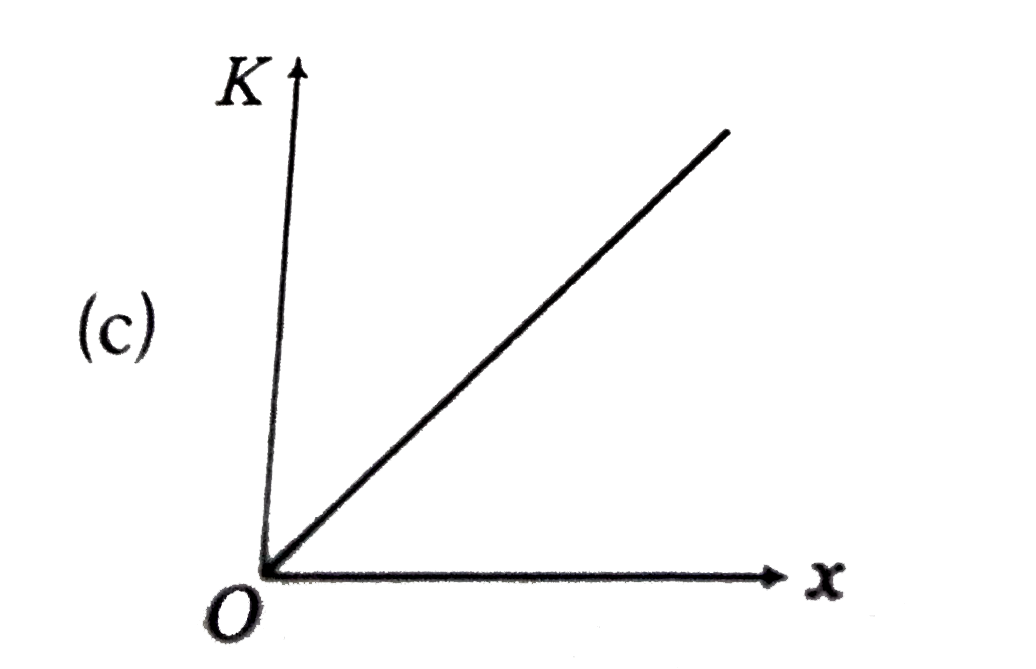
A body moves from rest with a constant acceleration. Which one of the following graphs represents the variation of its kinetic energy K with the distance travelled x?
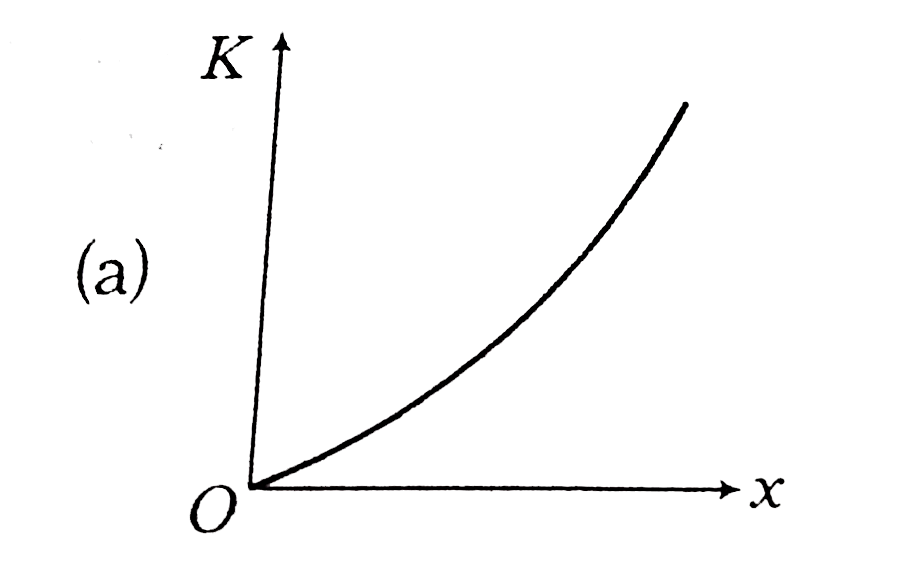
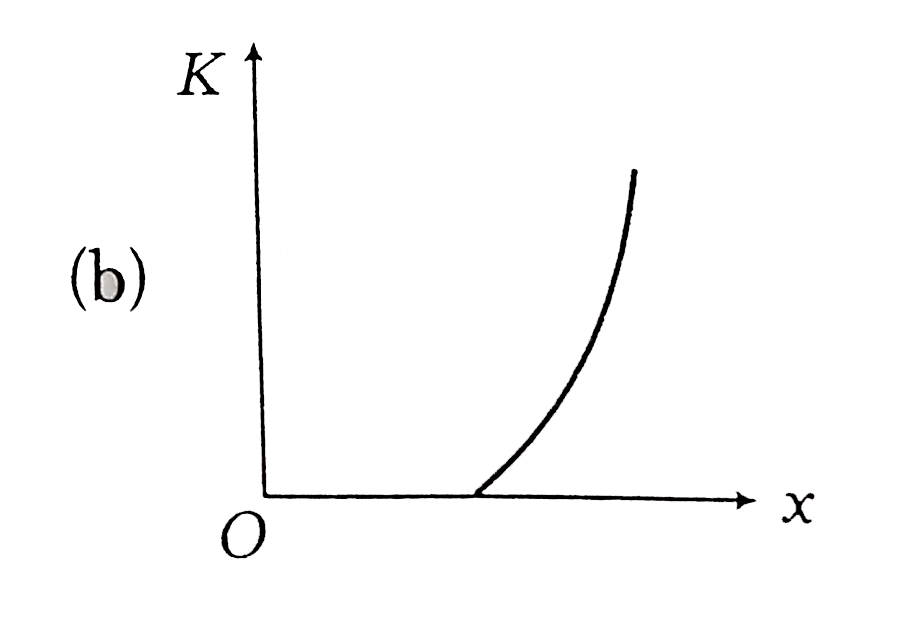
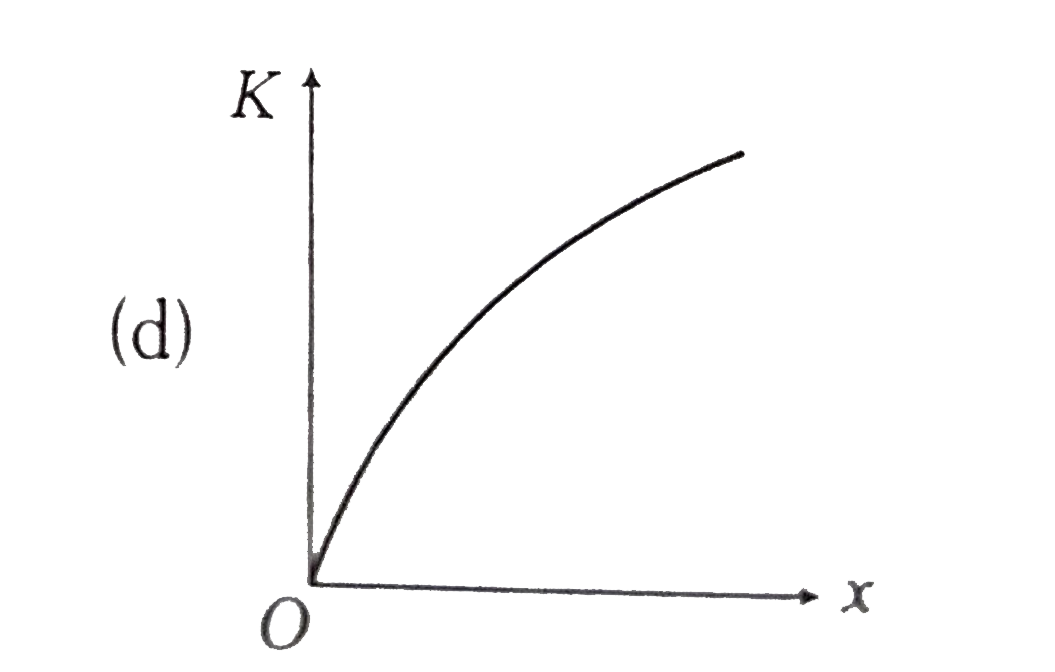
The correct Answer is:C
To solve the problem of determining which graph represents the variation of kinetic energy (K) with the distance traveled (x) for a body moving from rest with constant acceleration, we can follow these steps:
1. Understand the relationship between Kinetic Energy and Distance:
- The kinetic energy (K) of an object is given by the formula:
K=12mv2
- Where m is the mass of the body and v is its velocity.
2. Relate Velocity to Distance:
- For an object moving with constant acceleration a from rest, the velocity v at any distance x can be expressed using the kinematic equation:
v2=u2+2ax
- Since the object starts from rest, u=0, so the equation simplifies to:
v2=2ax
3. Substitute Velocity into the Kinetic Energy Formula:
- Now, substituting v2 into the kinetic energy formula:
K=12m(2ax)=max
- This shows that the kinetic energy K is directly proportional to the distance x traveled.
4. Graphical Representation:
- Since K is directly proportional to x, the graph of K versus x will be a straight line that passes through the origin (0,0).
- This means that as the distance x increases, the kinetic energy K increases linearly.
5. Identify the Correct Graph:
- Among the given options, we need to identify the graph that represents a straight line starting from the origin.
- Based on the analysis, the correct graph is the one that shows a linear relationship between kinetic energy and distance, which is represented by option C.
Conclusion:
The graph that represents the variation of kinetic energy K with the distance traveled x is a straight line starting from the origin, corresponding to option C.
---
- The kinetic energy (K) of an object is given by the formula:
K=12mv2
- Where m is the mass of the body and v is its velocity.
- For an object moving with constant acceleration a from rest, the velocity v at any distance x can be expressed using the kinematic equation:
v2=u2+2ax
- Since the object starts from rest, u=0, so the equation simplifies to:
v2=2ax
- Now, substituting v2 into the kinetic energy formula:
K=12m(2ax)=max
- This shows that the kinetic energy K is directly proportional to the distance x traveled.
- Since K is directly proportional to x, the graph of K versus x will be a straight line that passes through the origin (0,0).
- This means that as the distance x increases, the kinetic energy K increases linearly.
- Among the given options, we need to identify the graph that represents a straight line starting from the origin.
- Based on the analysis, the correct graph is the one that shows a linear relationship between kinetic energy and distance, which is represented by option C.
The graph that represents the variation of kinetic energy K with the distance traveled x is a straight line starting from the origin, corresponding to option C.
Topper's Solved these Questions
- WORK, ENERGY AND POWERBOOK - DC PANDEY ENGLISHCHAPTER - WORK, ENERGY AND POWEREXERCISE - MEDICAL ENTRANCE SPECIAL QUESTIONS
16 Videos
- WORK, ENERGY AND POWERBOOK - DC PANDEY ENGLISHCHAPTER - WORK, ENERGY AND POWEREXERCISE - MATCH THE COLUMNS
7 Videos
- WORK, ENERGY AND POWERBOOK - DC PANDEY ENGLISHCHAPTER - WORK, ENERGY AND POWEREXERCISE - CHECK POINT 6.3
10 Videos
- WORK, ENERGY & POWERBOOK - DC PANDEY ENGLISHCHAPTER - WORK, ENERGY & POWEREXERCISE - Level 2 Comprehension Based
2 Videos
- WORK, POWER AND ENERGYBOOK - DC PANDEY ENGLISHCHAPTER - WORK, POWER AND ENERGYEXERCISE - E Integer Type Questions
11 Videos
Similar Questions
Which of the following graphs best represents the variation of acceleration 'a' with displacement x?
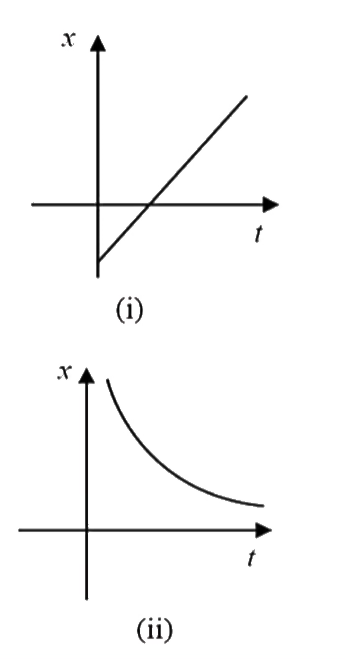
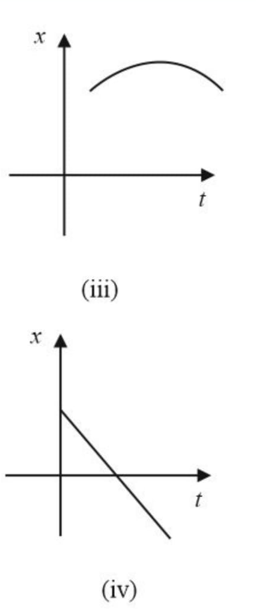
View SolutionWhich of the following graphs represents the motion of a particle moving with constant velocity?
View SolutionWhich one of the following graphs represents the variation of electric field with distance r from the centre of a charged spherical conductor of radius R?
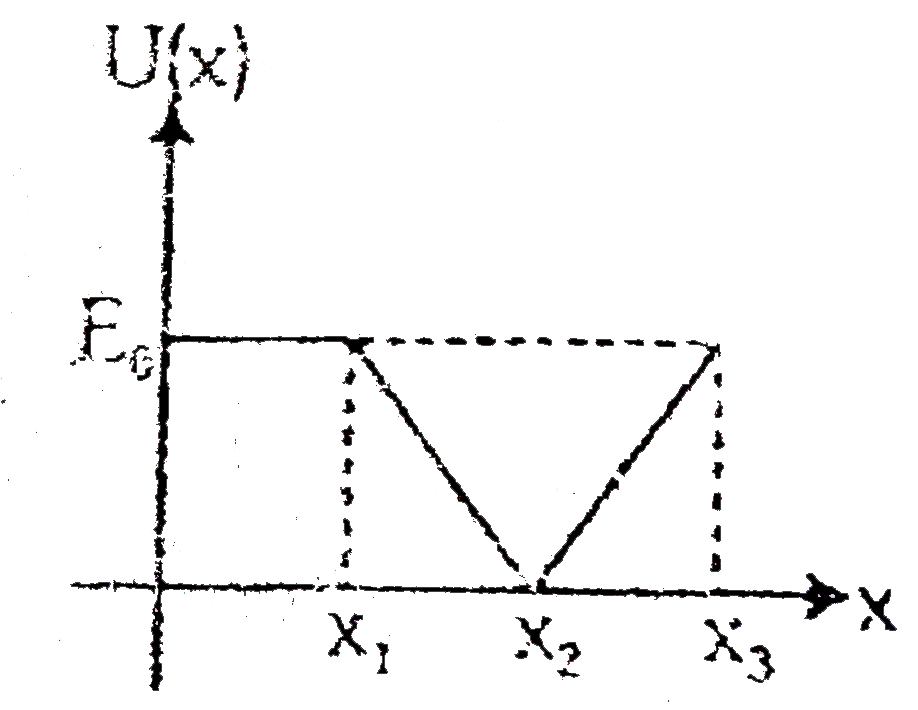
View SolutionThe potential energy U(x) of a particle moving along x−axis is shown in figure. Which one of the following graphs represents the variation of kinetic energy of this particel if its total mechanical enery is E0
View SolutionWhich of the following graph represents the variation of amount of chemisorption of a gas by a solid with temperature under constant pressure?
View SolutionThe graph which represents the variation of mean kinetic energy of moleules with temperature ∘C is ?
View SolutionThe velocity v of a particle moving along x - axis varies with ist position (x) as v=α√x, where α is a constant. Which of the following graph represents the variation of its acceleration (a) with time (t)?
View SolutionWhich of the following graphs correctly represents the variation of β=−dV/dPV
with P for an ideal gas at constant temperature?
View SolutionWhich of the following graphs correctly represents the variation of β=−dV/dPV
with P for an ideal gas at constant temperature?
View SolutionThe graph shown the variation with times t of the velocity v of an object . Which one of the following graphs best represents the variation of acceleration a of the object with time t?

View Solution
