The graph which represents the variation of mean kinetic energy of moleules with temperature is ?
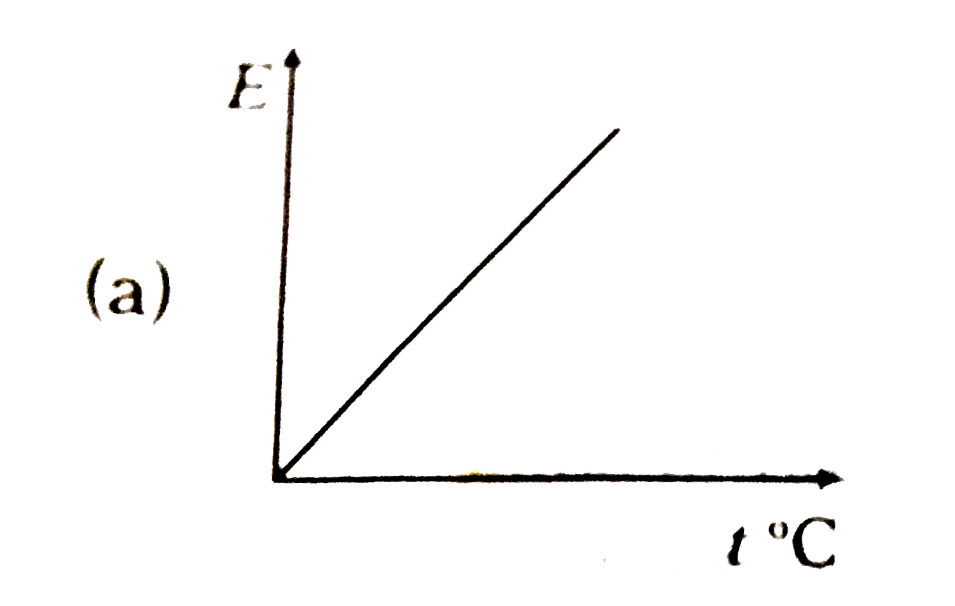
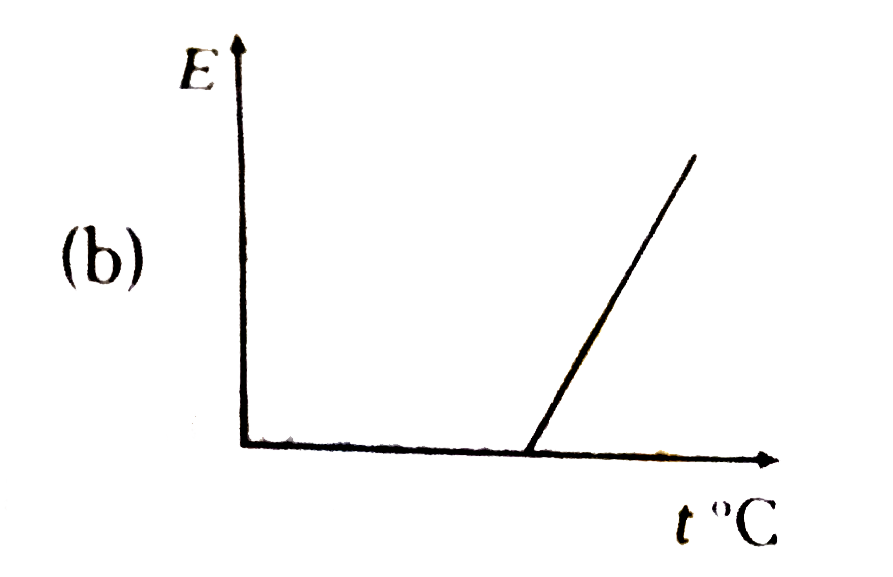
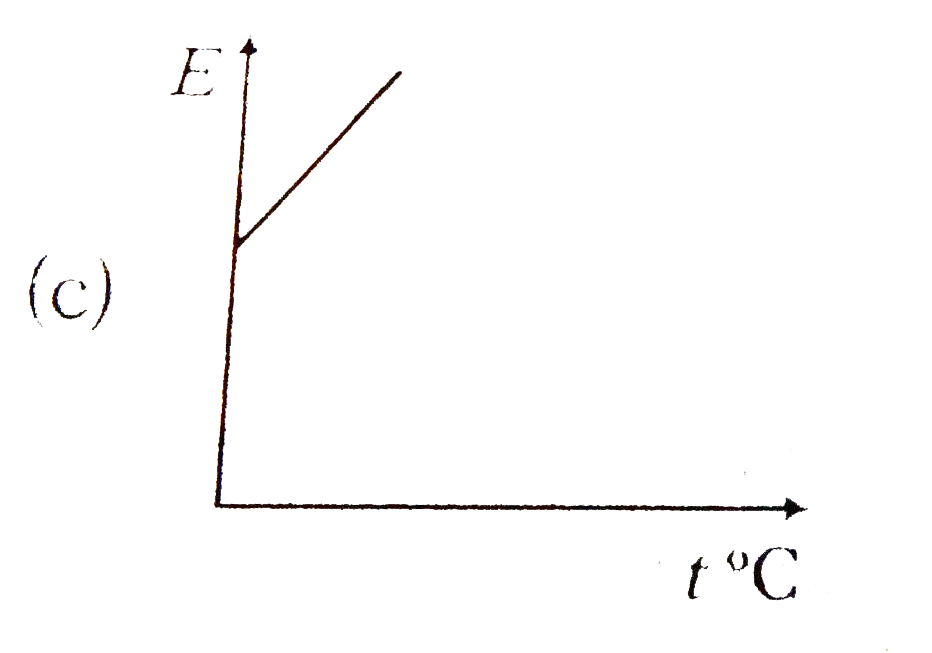
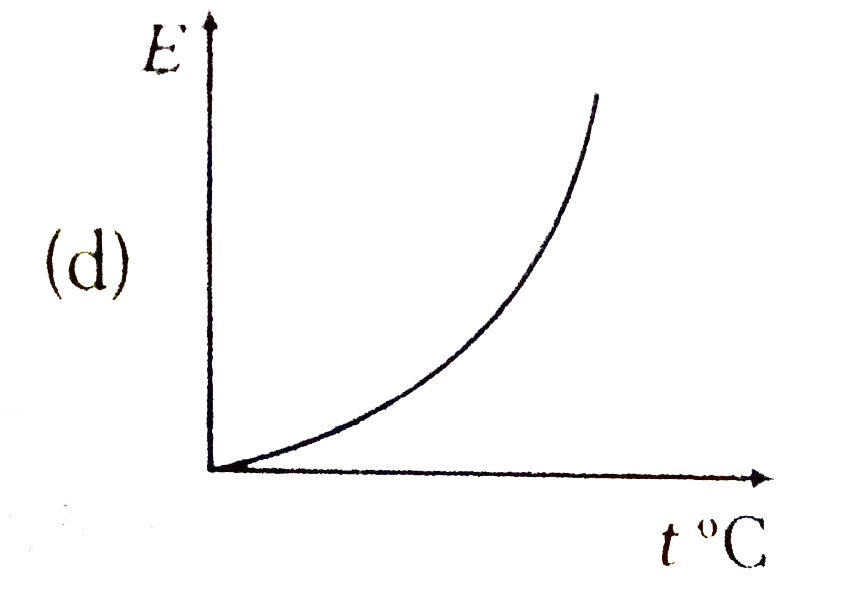
The correct Answer is:C
To solve the problem of finding the graph that represents the variation of mean kinetic energy of molecules with temperature in degrees Celsius, we can follow these steps:
1. Understand the Relationship: The mean kinetic energy (E) of molecules is related to the temperature (T) of the gas. The formula for mean kinetic energy is given by:
E=F2kT
where F is the degrees of freedom, k is the Boltzmann constant, and T is the temperature in Kelvin.
2. Convert Celsius to Kelvin: Since the temperature is given in degrees Celsius, we need to convert it to Kelvin. The conversion is done using the formula:
T(K)=T(°C)+273
3. Substitute the Temperature: Substitute the expression for T into the kinetic energy equation:
E=F2k(T(°C)+273)
This can be expanded to:
E=F2kT(°C)+F2k⋅273
4. Identify the Linear Form: The equation can be rearranged into the form of a linear equation Y=MX+C:
- Here, Y represents the mean kinetic energy E,
- X represents the temperature in degrees Celsius T(°C),
- M (the slope) is F2k,
- C (the y-intercept) is F2k⋅273.
5. Graph Characteristics: Since the slope M is positive, the graph will be a straight line that rises as the temperature increases. The y-intercept C indicates that even at 0°C, there is a positive value for mean kinetic energy.
6. Conclusion: The graph representing the variation of mean kinetic energy of molecules with temperature in degrees Celsius will be a straight line with a positive slope, starting from a positive y-intercept.
Final Answer:
The correct graph is a straight line with a positive slope, indicating that as the temperature increases, the mean kinetic energy of the molecules also increases.
E=F2kT
where F is the degrees of freedom, k is the Boltzmann constant, and T is the temperature in Kelvin.
T(K)=T(°C)+273
E=F2k(T(°C)+273)
This can be expanded to:
E=F2kT(°C)+F2k⋅273
- Here, Y represents the mean kinetic energy E,
- X represents the temperature in degrees Celsius T(°C),
- M (the slope) is F2k,
- C (the y-intercept) is F2k⋅273.
The correct graph is a straight line with a positive slope, indicating that as the temperature increases, the mean kinetic energy of the molecules also increases.
Topper's Solved these Questions
- BOOK - DC PANDEY ENGLISHCHAPTER - THERMOMETRY THERMAL EXPANSION AND KINETIC THEORY OF GASESEXERCISE - A Tacking it together55videos
THERMOMETRY THERMAL EXPANSION AND KINETIC THEORY OF GASES
- BOOK - DC PANDEY ENGLISHCHAPTER - THERMOMETRY THERMAL EXPANSION AND KINETIC THEORY OF GASESEXERCISE - B medical entrance special format questions14videos
THERMOMETRY THERMAL EXPANSION AND KINETIC THEORY OF GASES
- BOOK - DC PANDEY ENGLISHCHAPTER - THERMOMETRY THERMAL EXPANSION AND KINETIC THEORY OF GASESEXERCISE - Check point 14.320videos
THERMOMETRY THERMAL EXPANSION AND KINETIC THEORY OF GASES
- BOOK - DC PANDEY ENGLISHCHAPTER - SUPERPOSITION OF WAVESEXERCISE - Level 2 Subjective8videos
SUPERPOSITION OF WAVES
- BOOK - DC PANDEY ENGLISHCHAPTER - THERMOMETRY,THERMAL EXPANSION & KINETIC THEORY OF GASESEXERCISE - Level 2 Subjective9videos
THERMOMETRY,THERMAL EXPANSION & KINETIC THEORY OF GASES
Similar Questions
Knowledge Check
- Question 1 - Select One
Which one of the following graphs represents variation of specific heat capacity of water with temperature?
A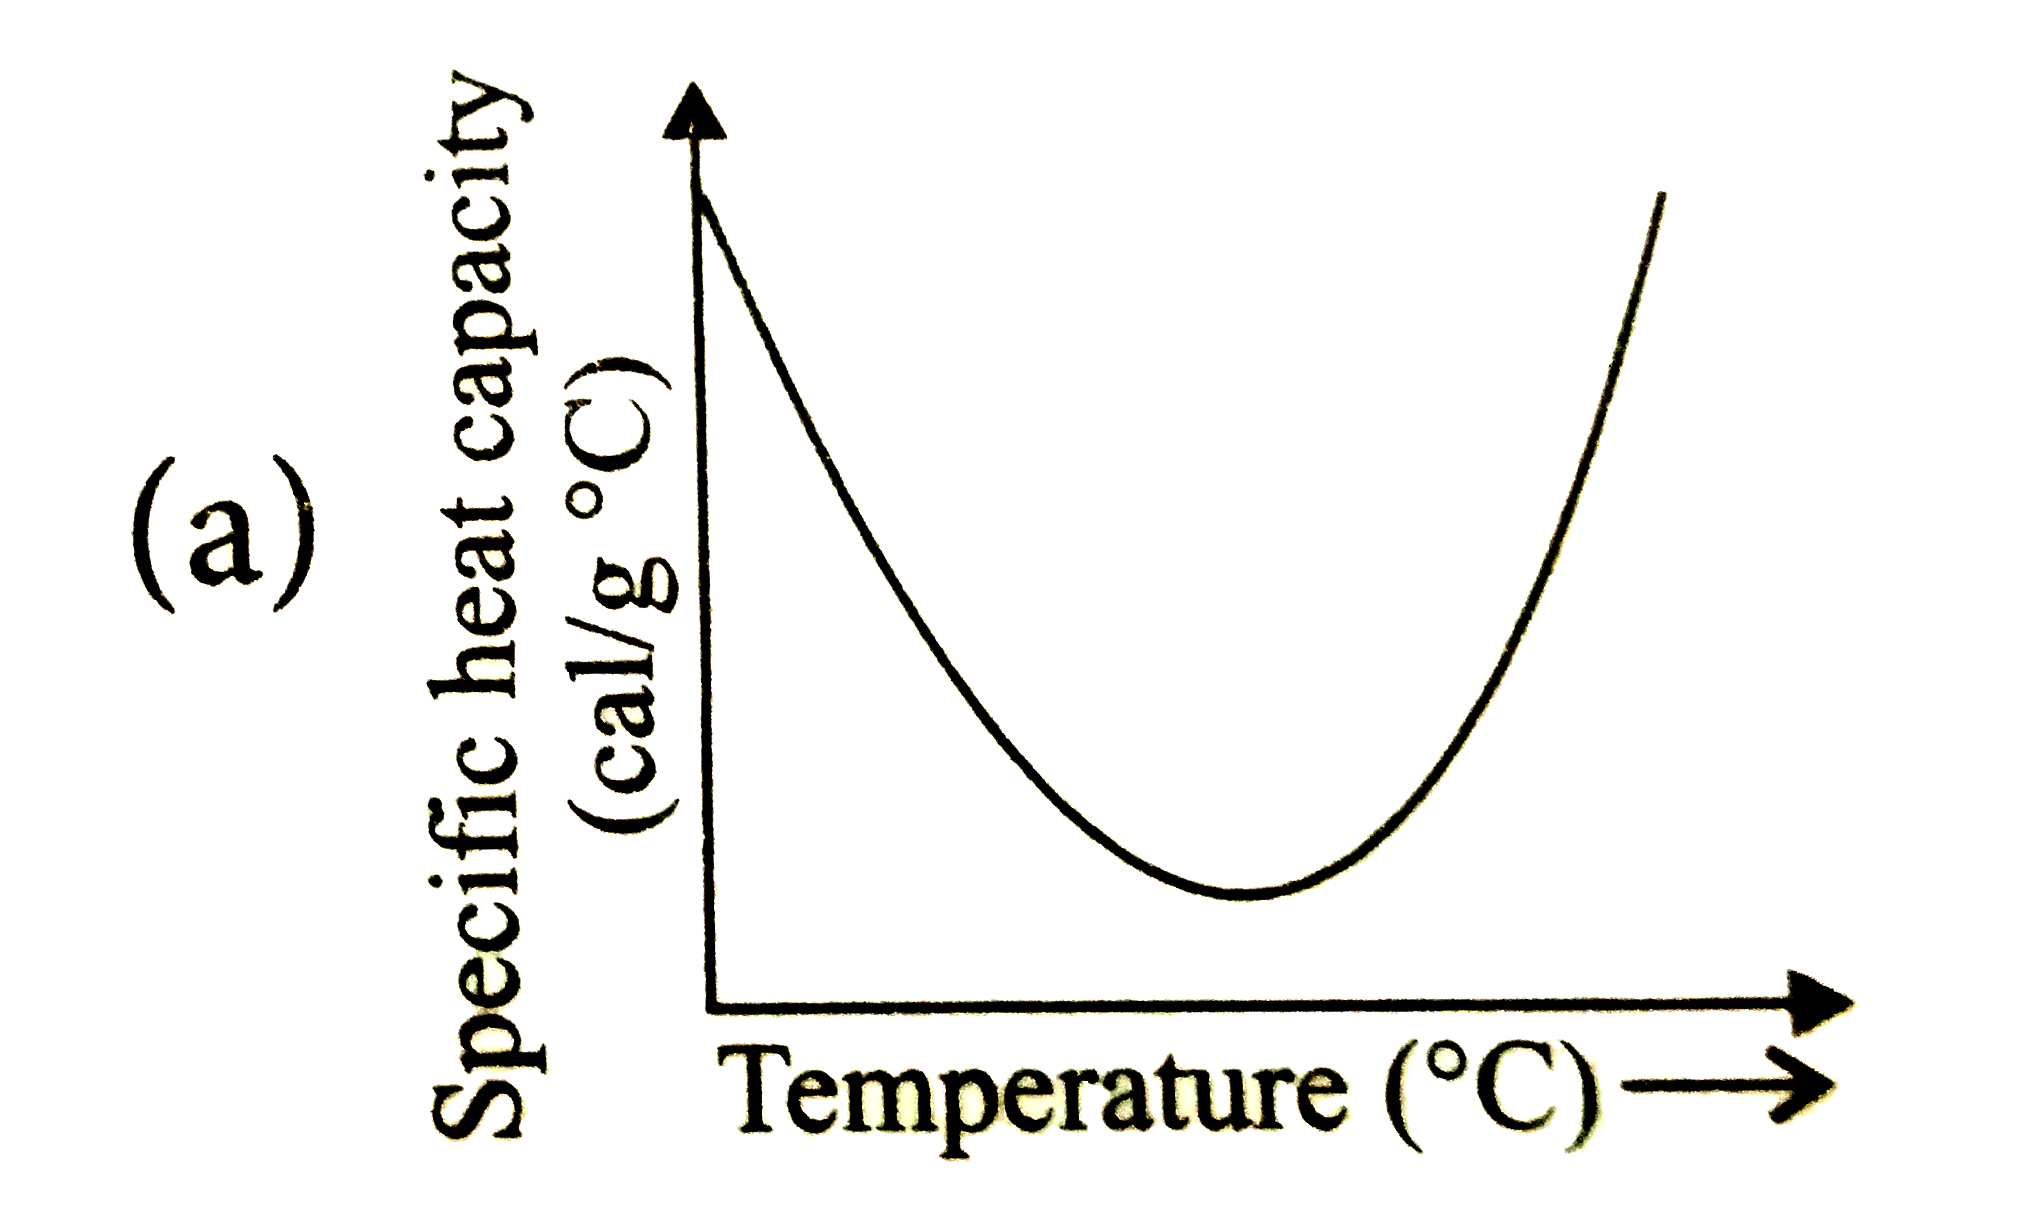 B
B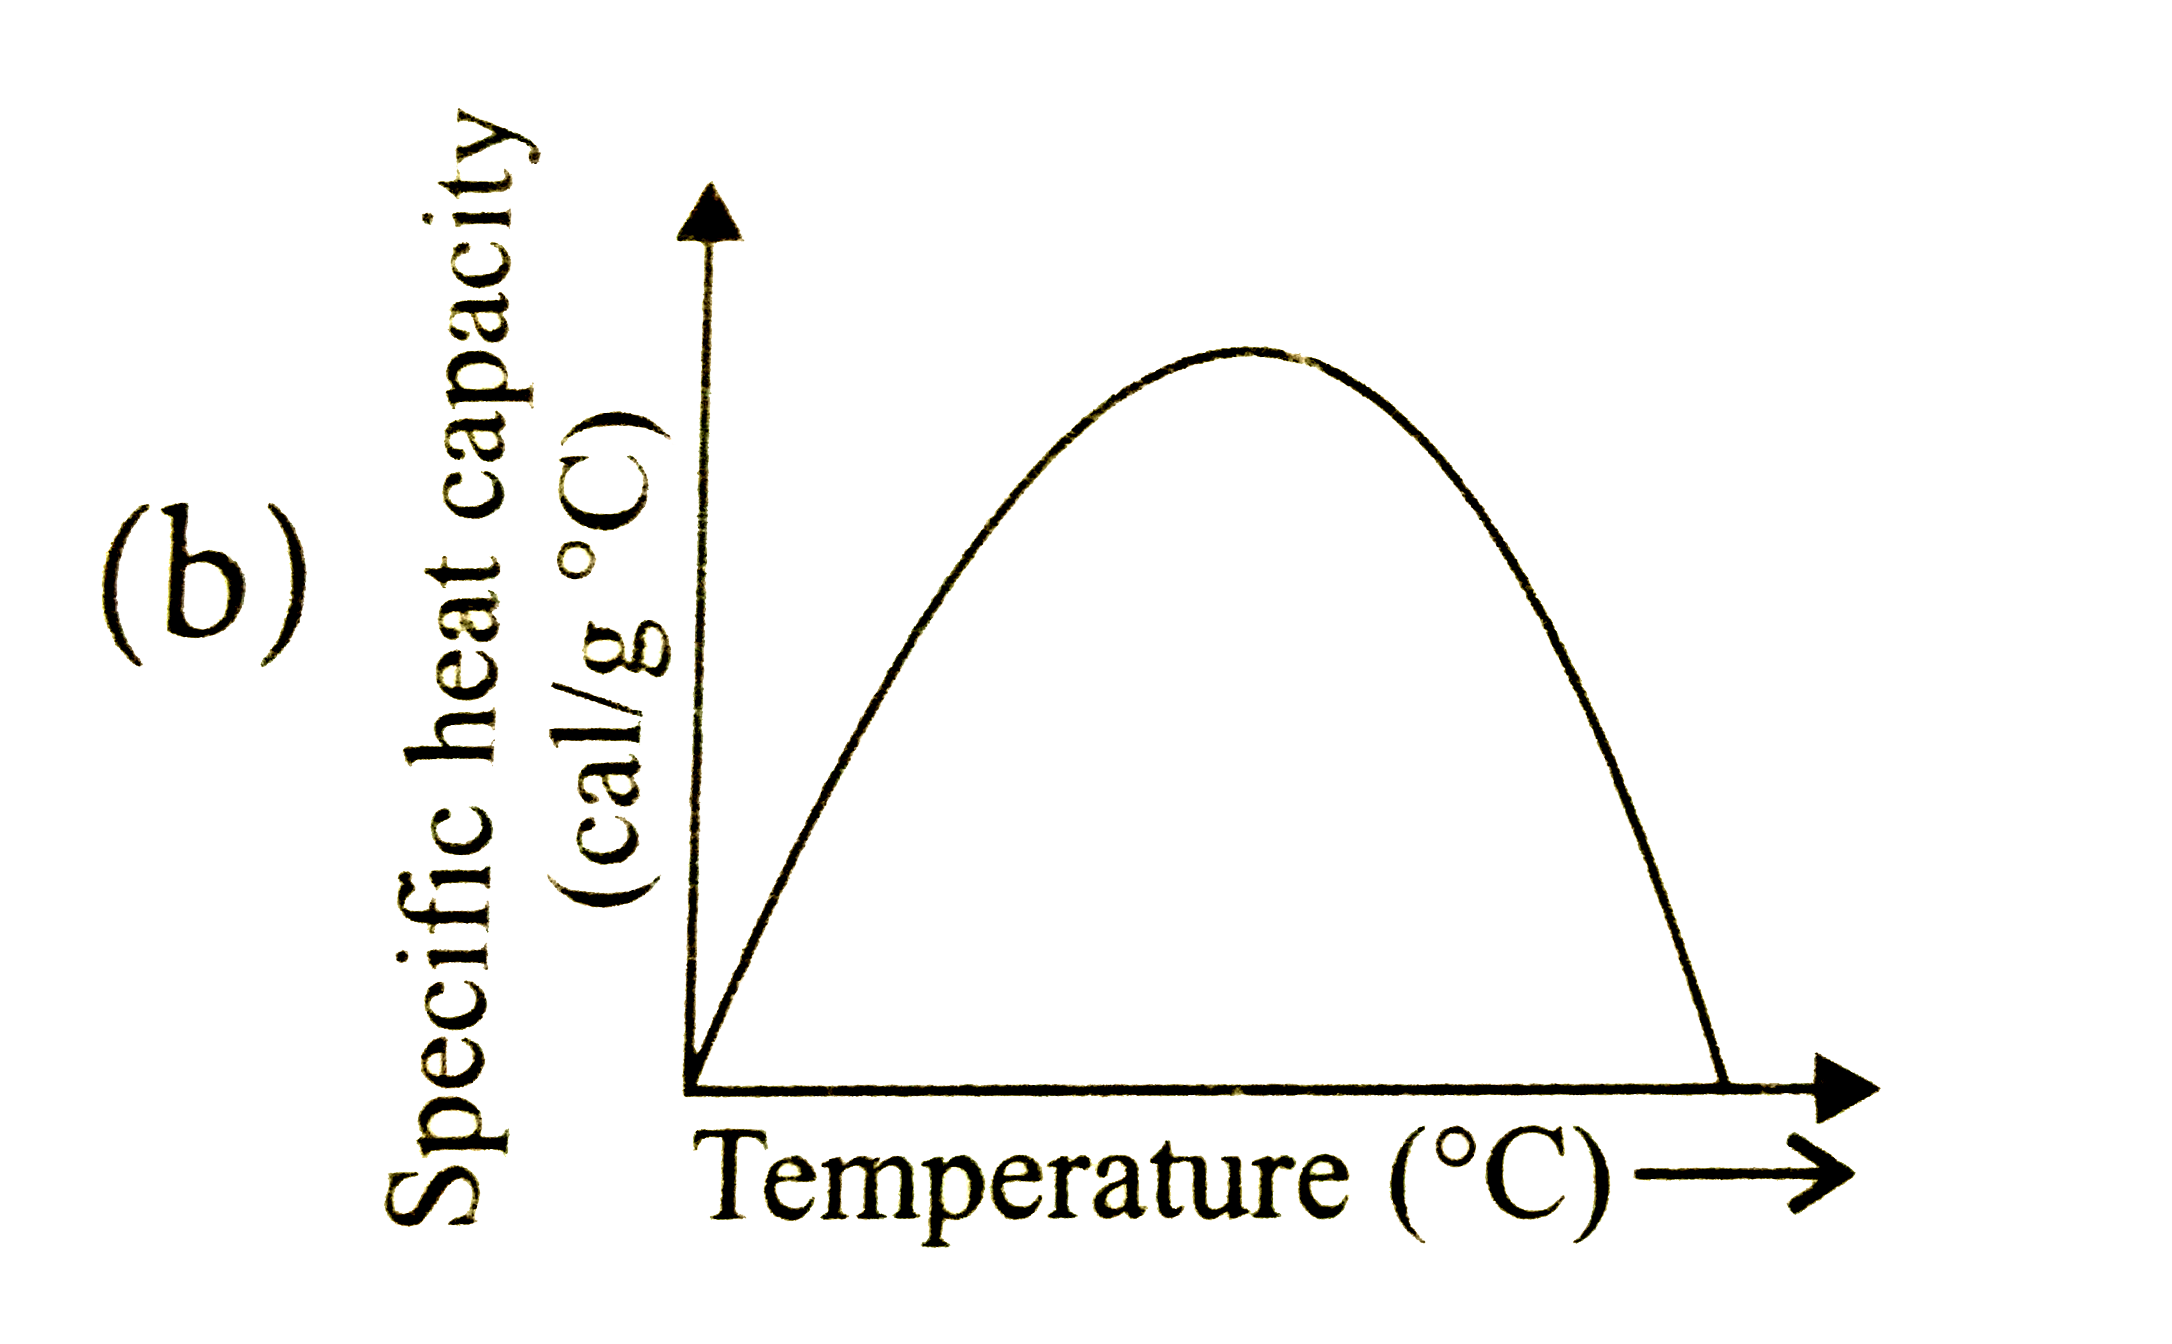 C
C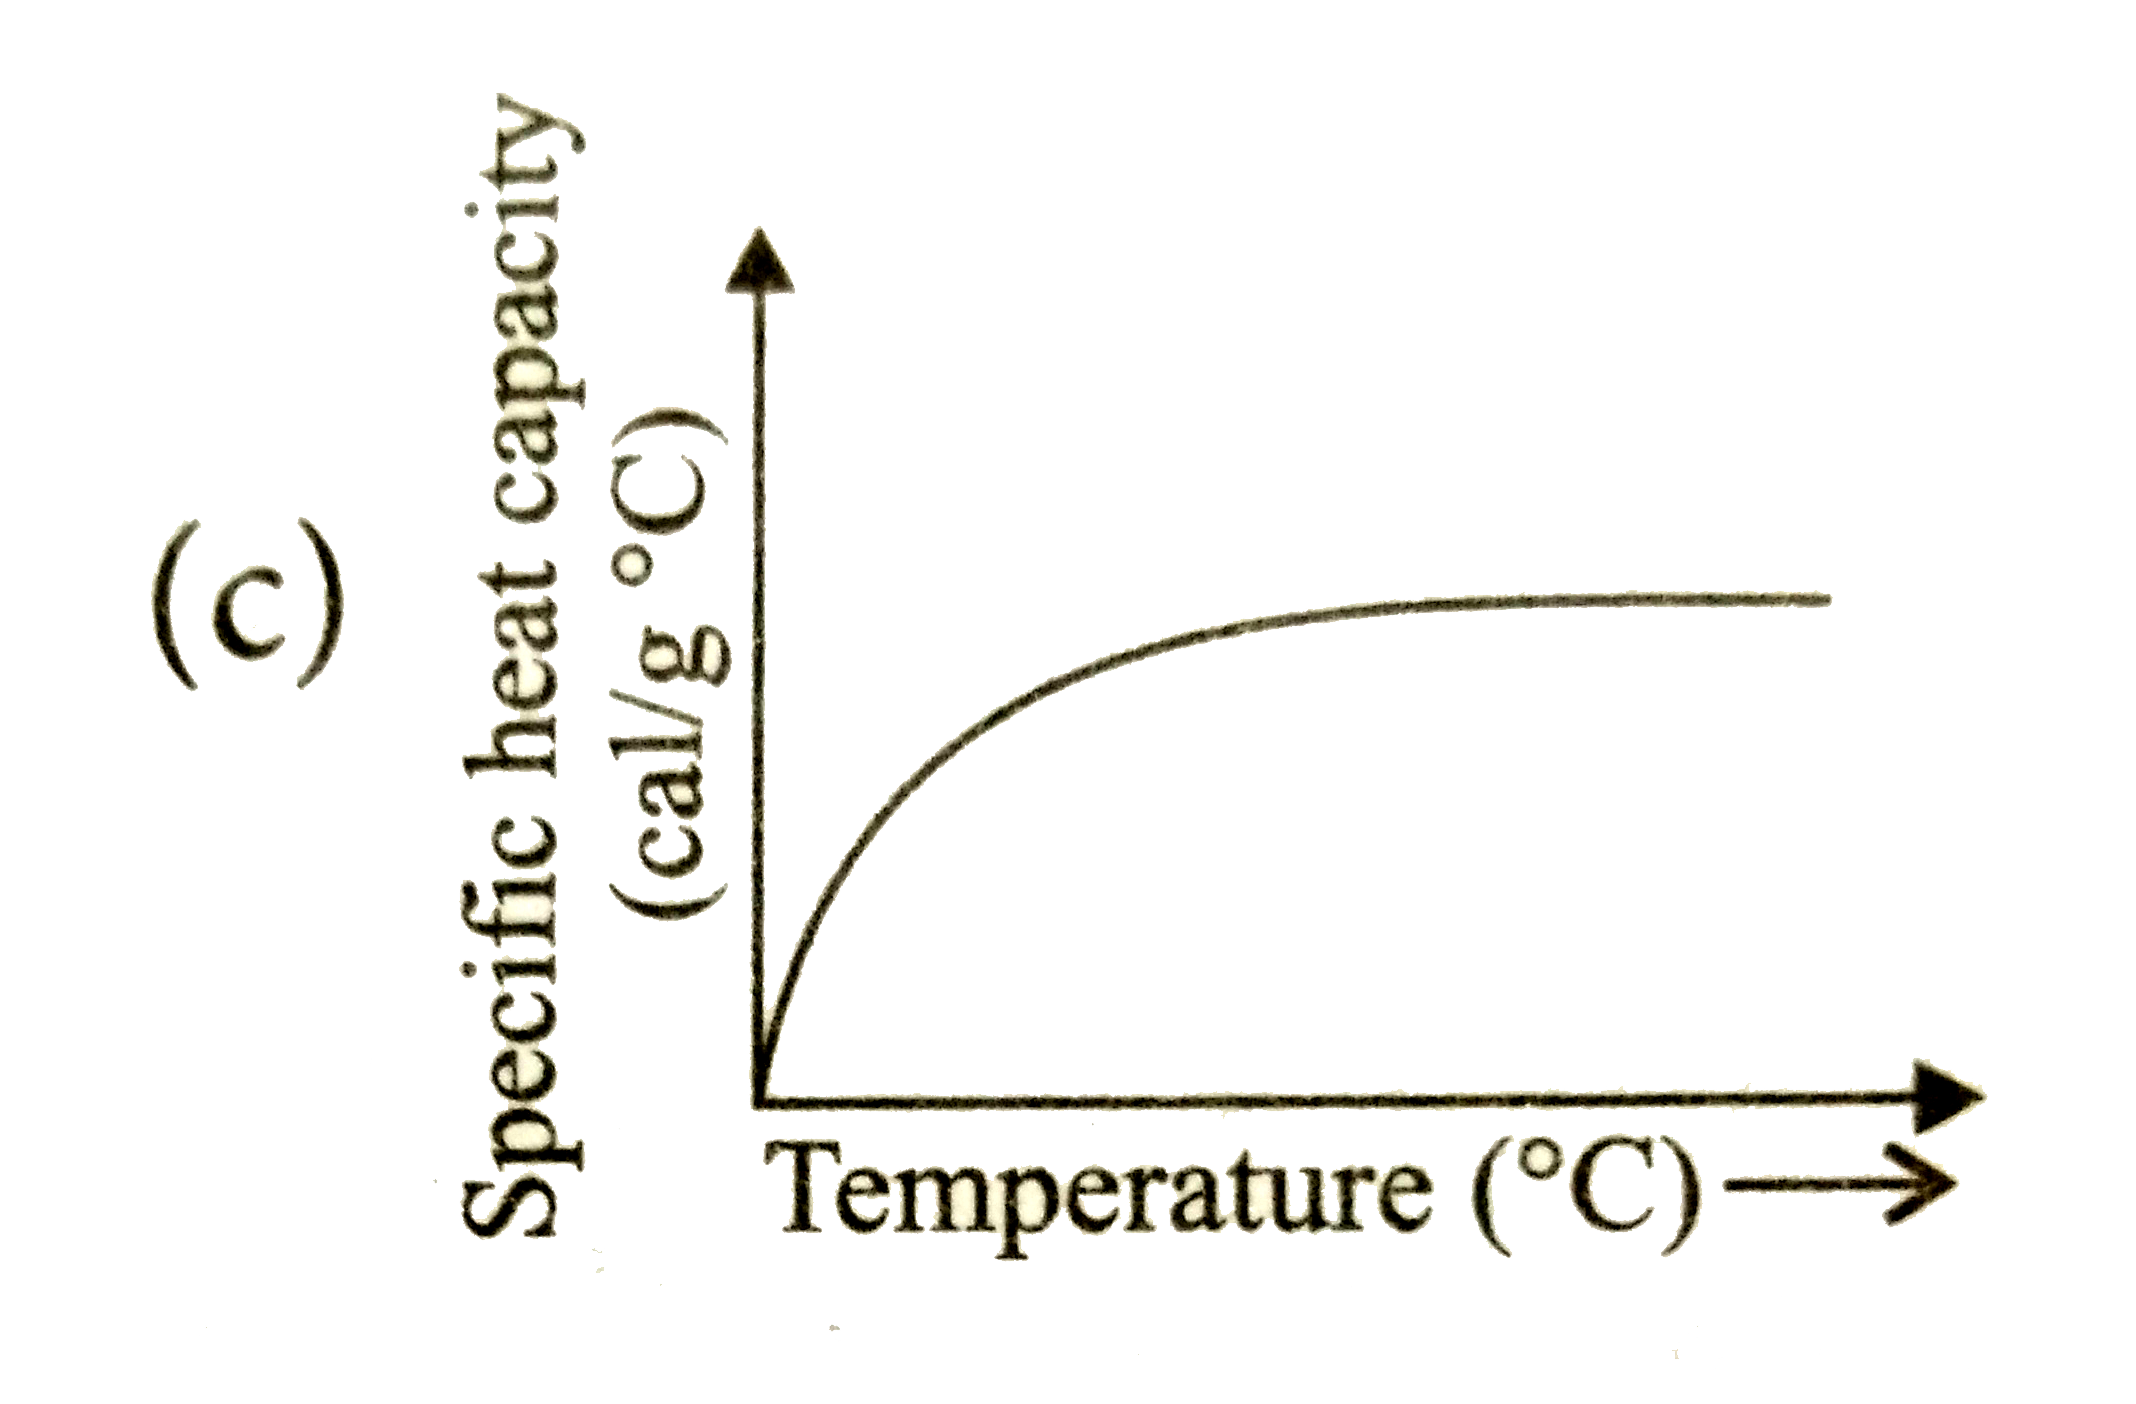 D
D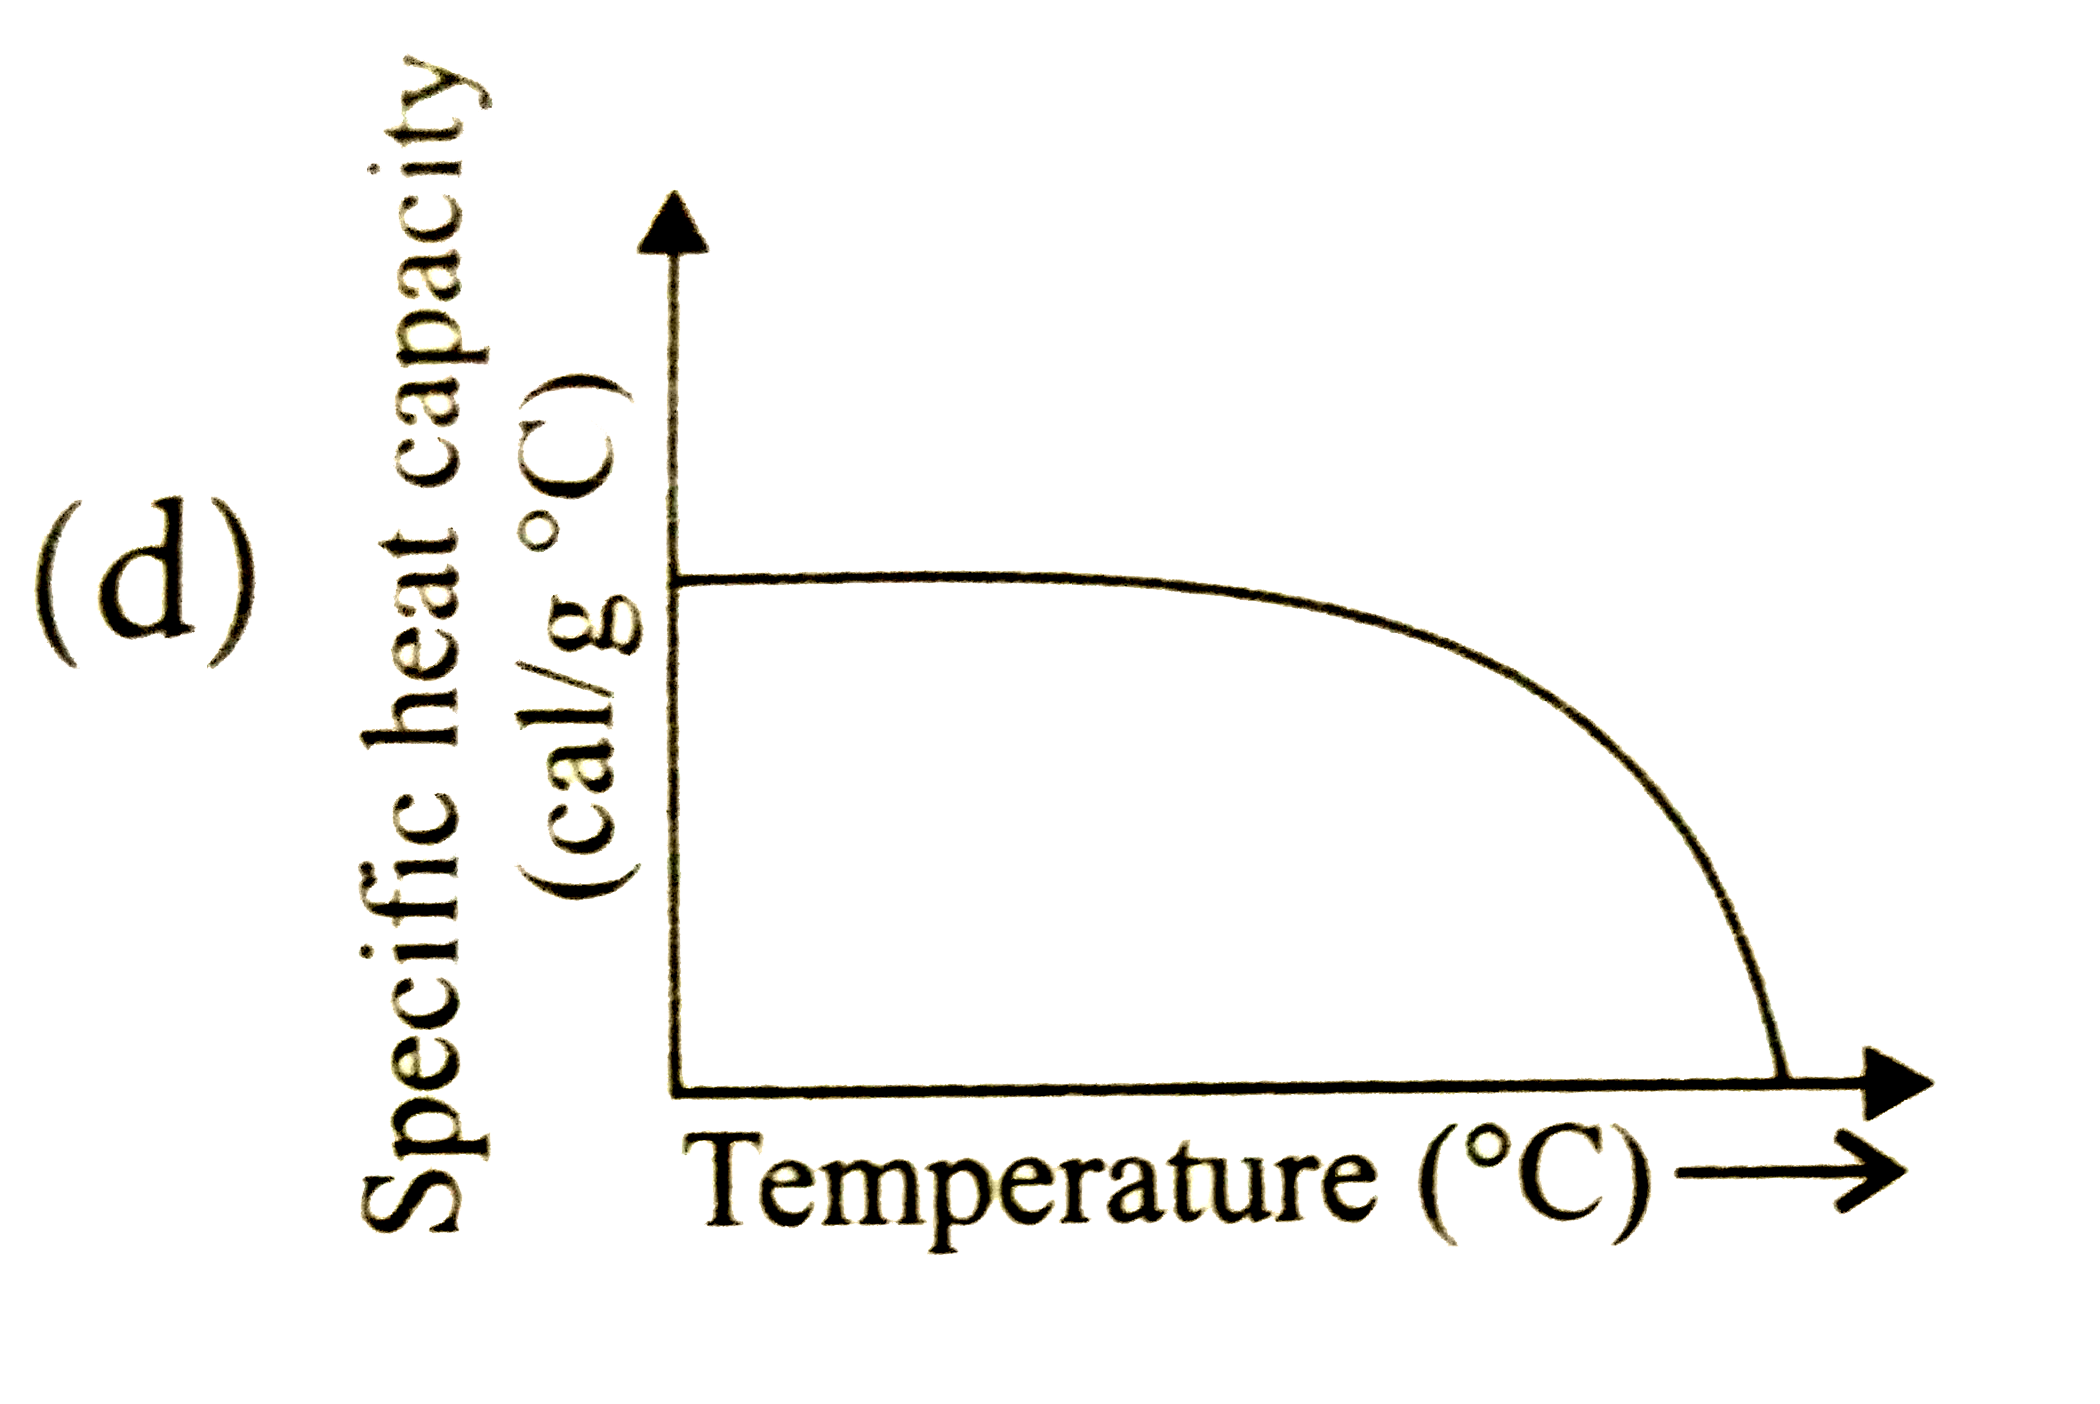
What is the mean translation kinetic energy of a perfect gas molecule at temperature T?
View SolutionThe correct graph which shows the variation of paramagnetic susceptibility S with temperature T is
View SolutionA body moves from rest with a constant acceleration. Which one of the following graphs represents the variation of its kinetic energy K with the distance travelled x?
View SolutionA body moves from rest with a constant acceleration. Which one of the following graphs represents the variation of its kinetic energy K with the distance travelled x?
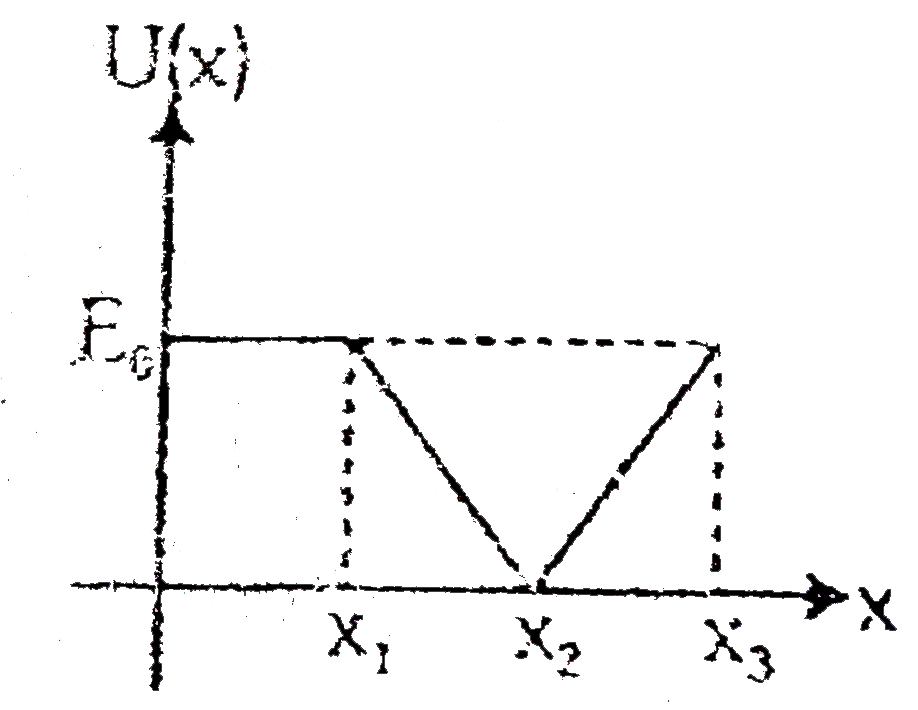
View SolutionThe potential energy U(x) of a particle moving along x−axis is shown in figure. Which one of the following graphs represents the variation of kinetic energy of this particel if its total mechanical enery is E0
 View Solution
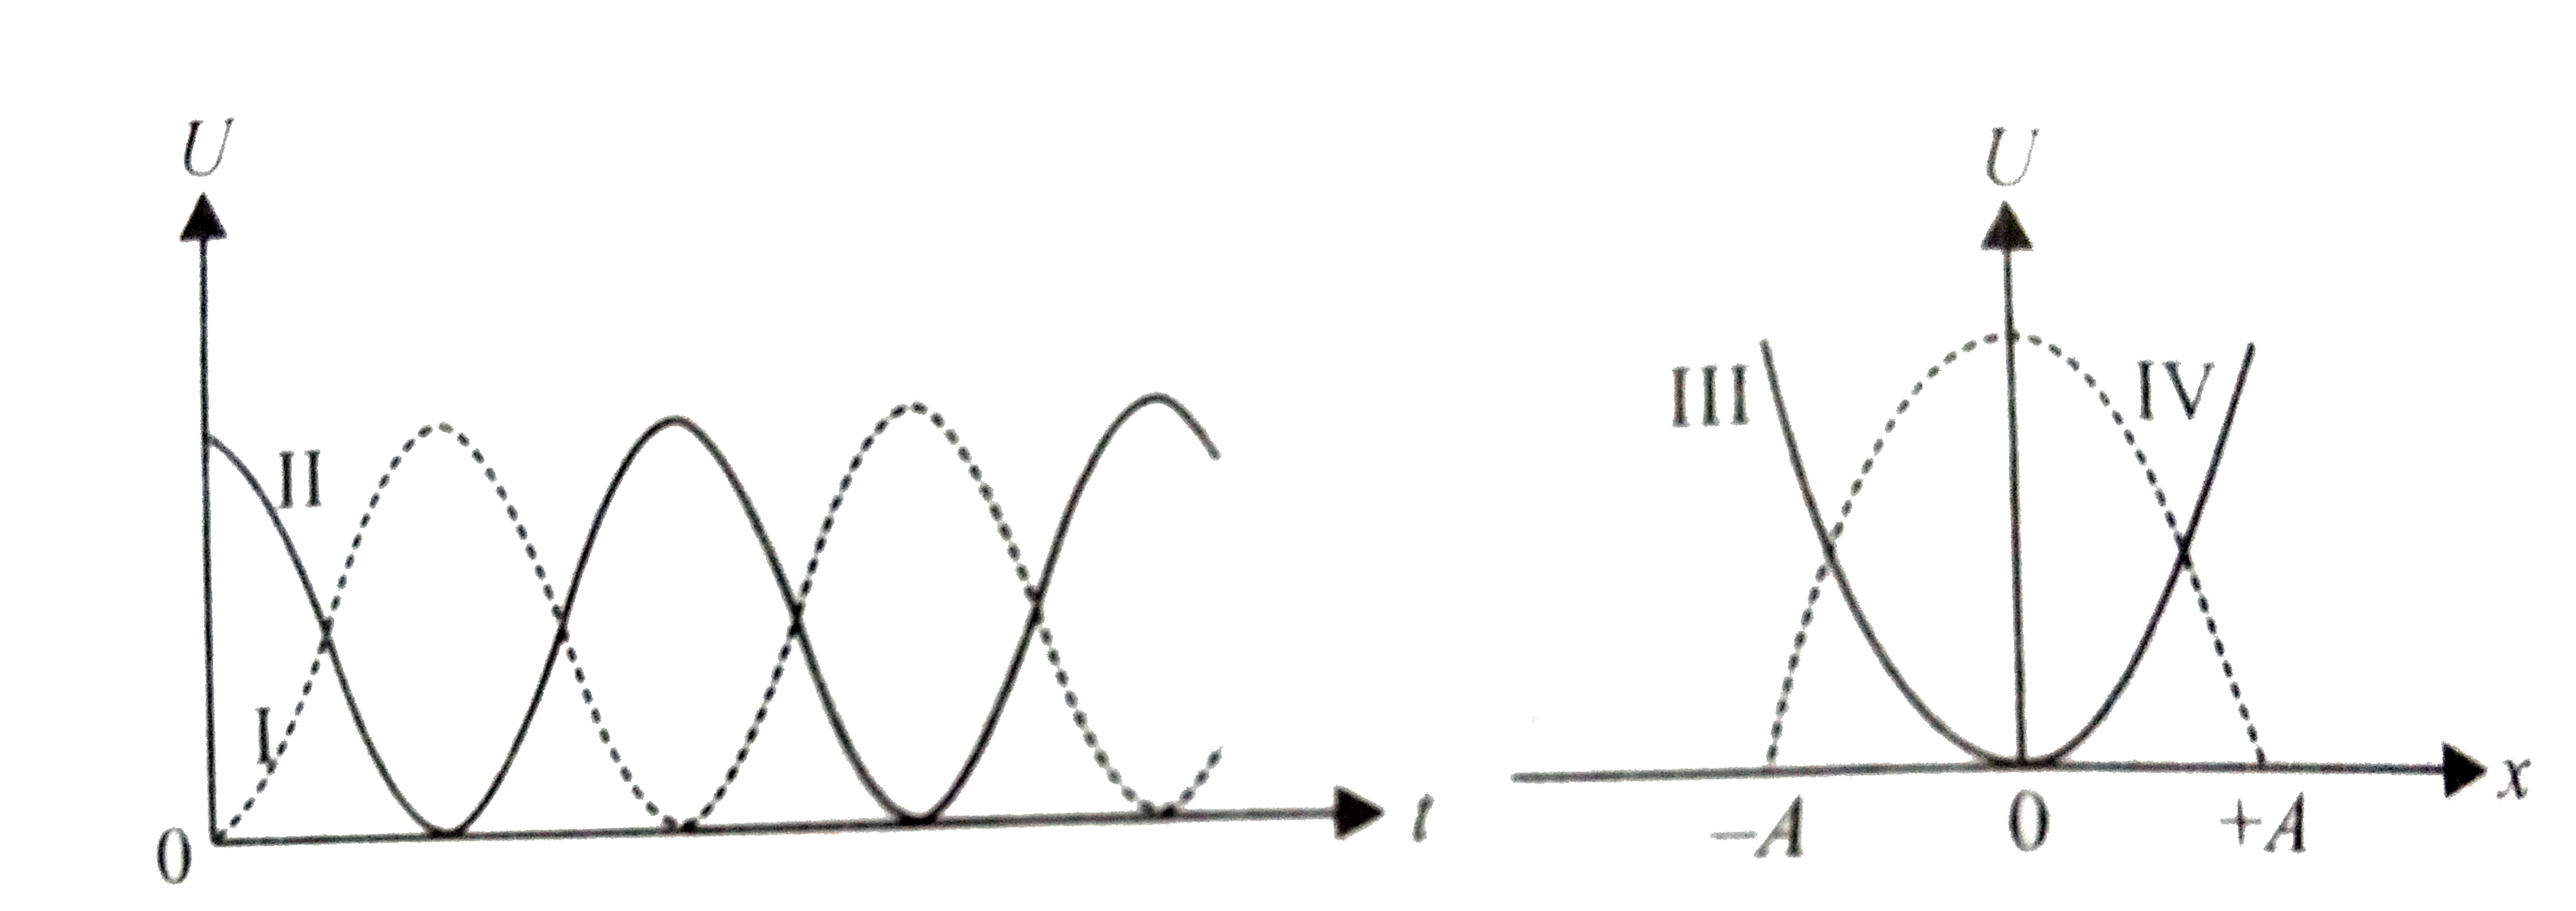
For a particle executing simple harmonic motion, the displacement x is given by x=Acosωt. Identify the graph, which represents the variation of potential energy (U) as a function of time t and displacement x.
 View Solution
Which of the following graph represents the variation of amount of chemisorption of a gas by a solid with temperature under constant pressure?
View Solution
