From the p-T graph what conclusion can be drawn? 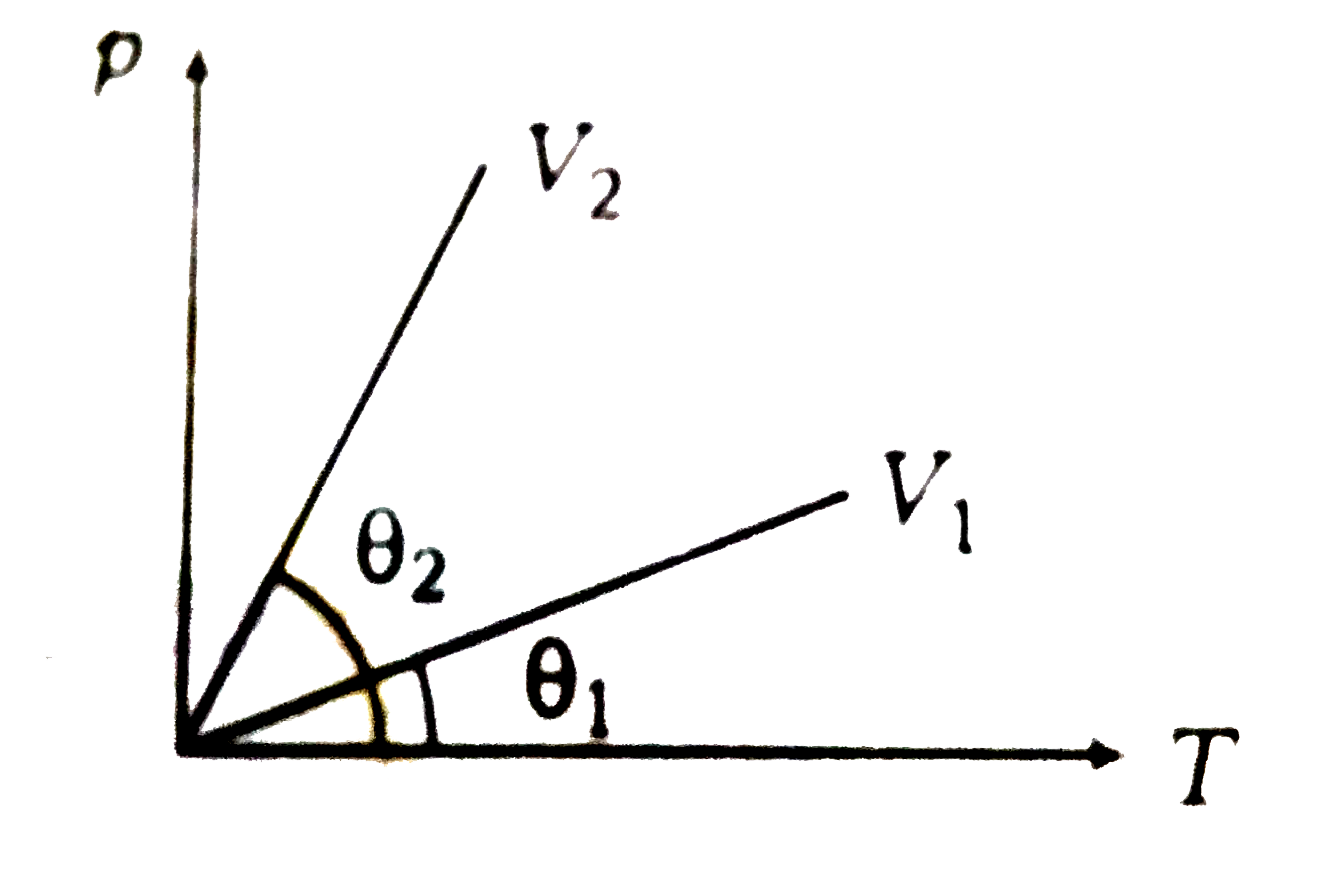
V2=V1
V2<V1
V2>V1
None of these
The correct Answer is:C
As θ2>θ1⇒tanθ2>tanθ1
⇒ (Tp)2>(Tp)1⇒Tp∝V⇒v2>v1
Topper's Solved these Questions
- BOOK - DC PANDEY ENGLISHCHAPTER - THERMOMETRY THERMAL EXPANSION AND KINETIC THEORY OF GASESEXERCISE - A Tacking it together55videos
THERMOMETRY THERMAL EXPANSION AND KINETIC THEORY OF GASES
- BOOK - DC PANDEY ENGLISHCHAPTER - THERMOMETRY THERMAL EXPANSION AND KINETIC THEORY OF GASESEXERCISE - B medical entrance special format questions14videos
THERMOMETRY THERMAL EXPANSION AND KINETIC THEORY OF GASES
- BOOK - DC PANDEY ENGLISHCHAPTER - THERMOMETRY THERMAL EXPANSION AND KINETIC THEORY OF GASESEXERCISE - Check point 14.320videos
THERMOMETRY THERMAL EXPANSION AND KINETIC THEORY OF GASES
- BOOK - DC PANDEY ENGLISHCHAPTER - SUPERPOSITION OF WAVESEXERCISE - Level 2 Subjective8videos
SUPERPOSITION OF WAVES
- BOOK - DC PANDEY ENGLISHCHAPTER - THERMOMETRY,THERMAL EXPANSION & KINETIC THEORY OF GASESEXERCISE - Level 2 Subjective9videos
THERMOMETRY,THERMAL EXPANSION & KINETIC THEORY OF GASES
Similar Questions
Knowledge Check
- Question 1 - Select One
In laboratory experiments, two species of the protist Paramecium (species 1 and 2) were grown alond and in the presence of the other species. The following graphs show growth of species 1 and species 2, both alone and when in mixed culture with the other species.
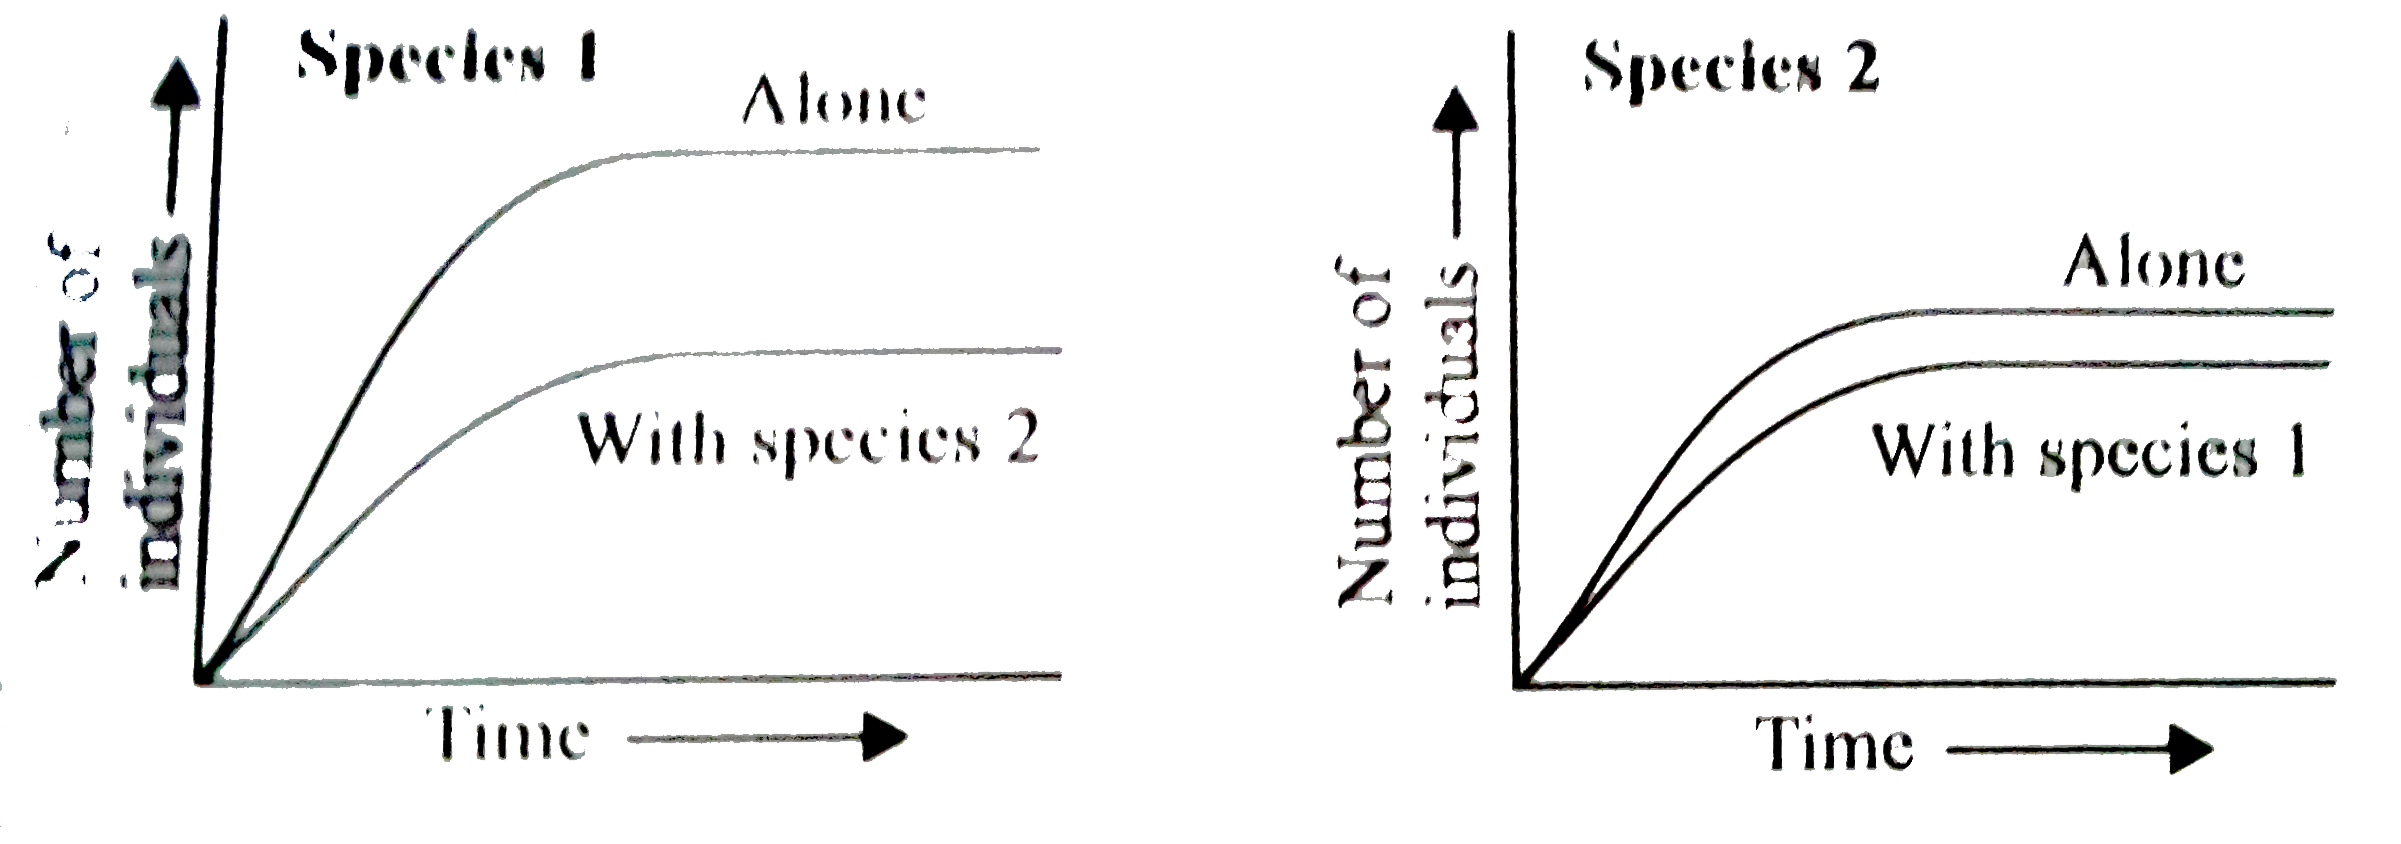 Which of the following conclusions can be drawn from the graphs ? ACompetitive exclusion occurred in these experiments.BBoth species are affected by interspecific competition but species 1 is affected less.CBoth species are affected by interspecific competition but species 2 is affected less.DBoth species are affected equally by interspecific competition.
Fluorine is more electronegative than either boron or phosphorous. What conclusion can be drawn from the fact that BF3 has no dipole moment but PF3 does
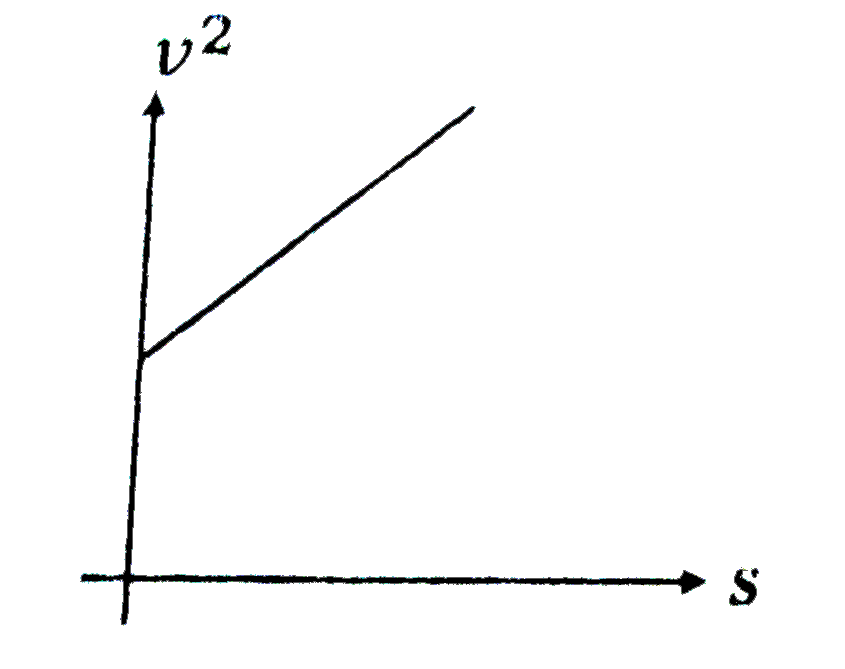
View Solutionv2 versus s-graph of a particle moving in a straight line is shown in the figure. From the graph some conculsions are drawn. State which statement is wrong ?
 View Solution
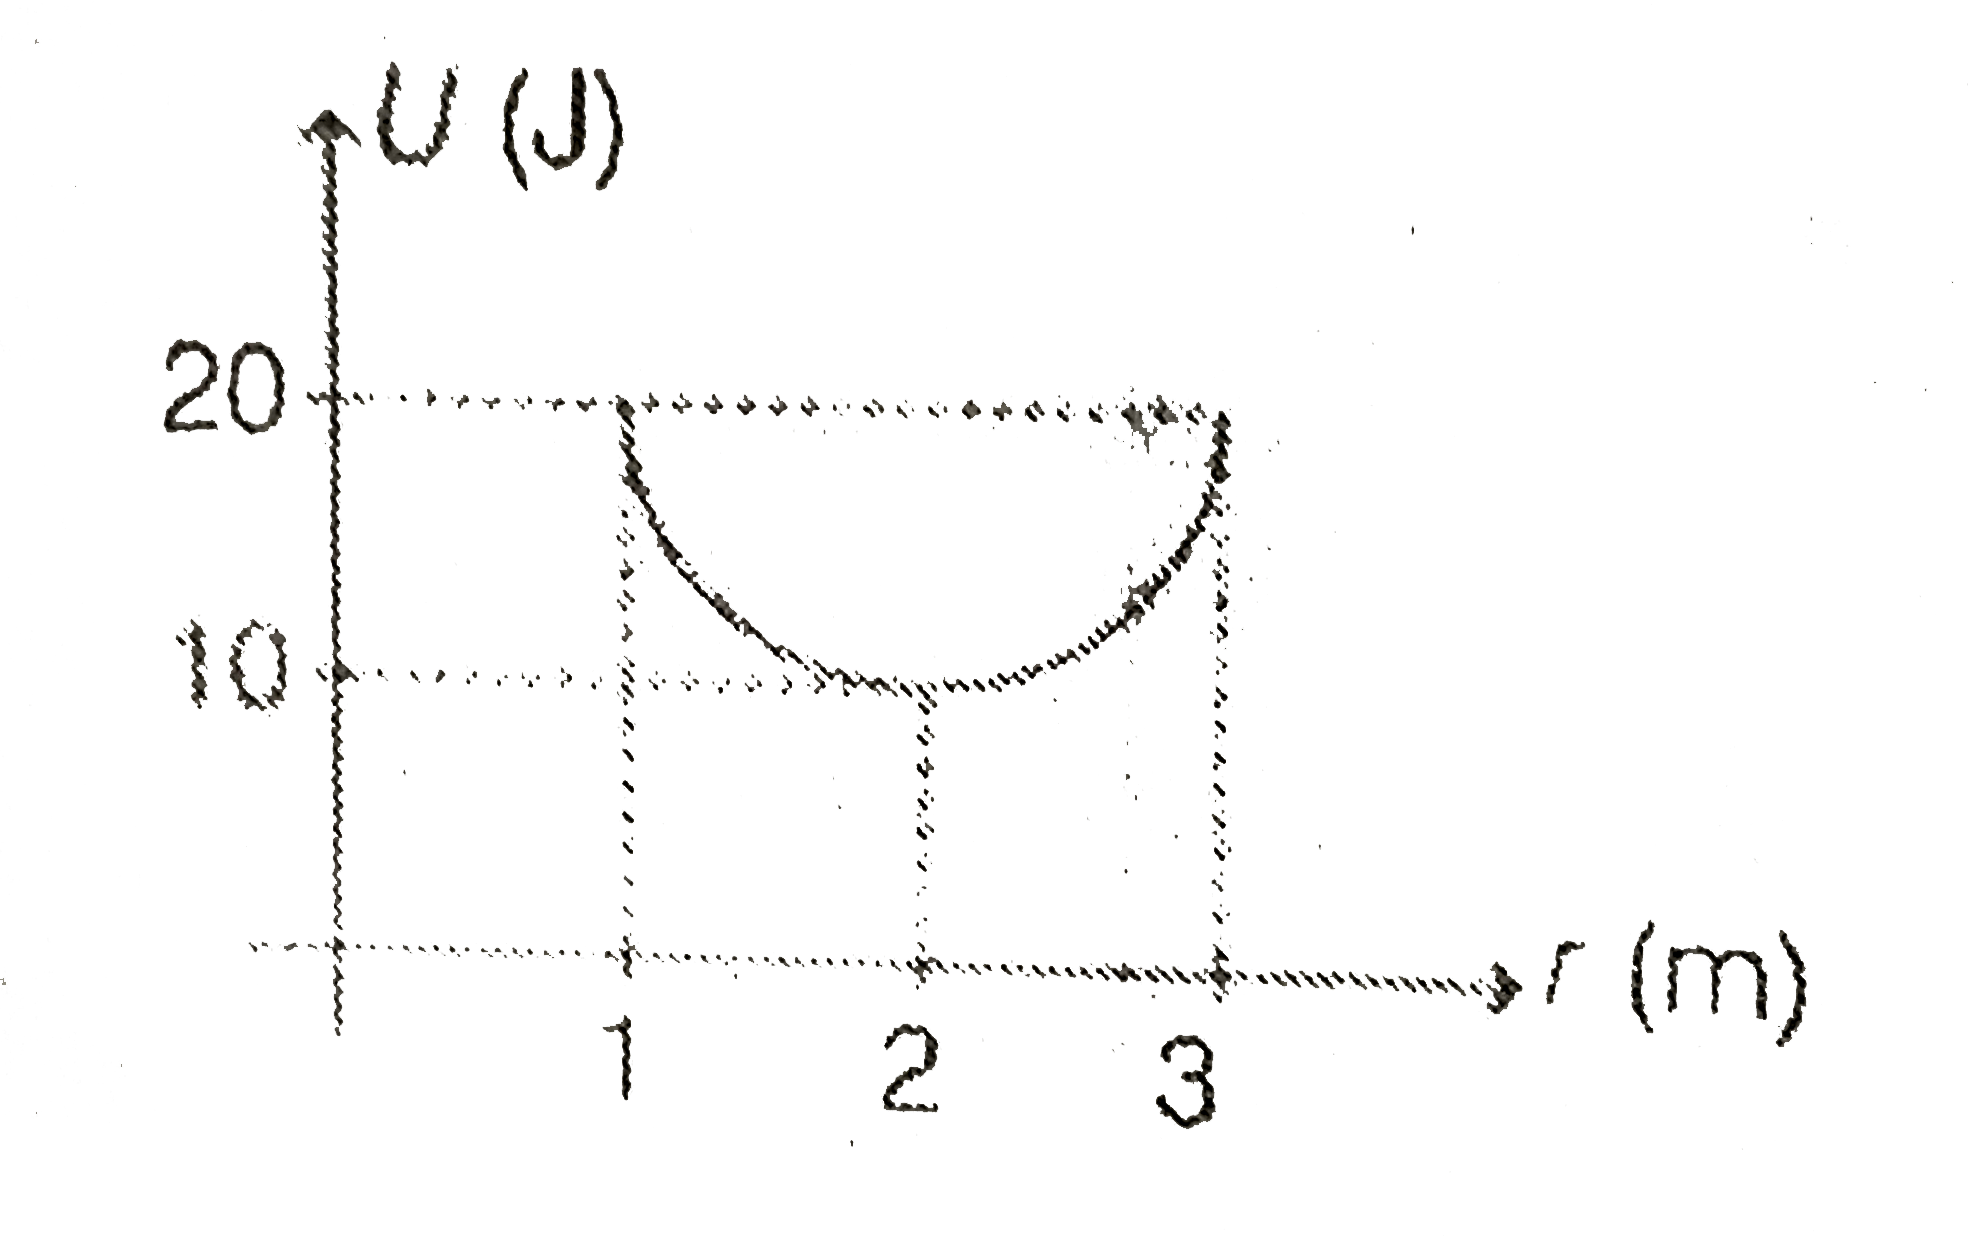
U.r graph of a particle performing SHM is as shown in figure. What conclusion cannot be drawn from the graph?
 View Solution
Which of the following conclusions can be drawn from the girdling experiment?
View SolutionState two important conclusions that can be drawn from Millikan.s oil drop experiment to determine the charge of an electron.
View SolutionThe age pyramid for human population is shown below
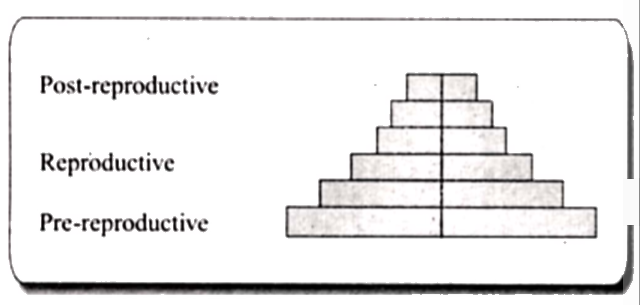
Which of the following conclusion can be drawn from the given age pyramid?View SolutionStudy the pedigree chart of a certain family given below and select the correct conclusion which can be drawn for the character
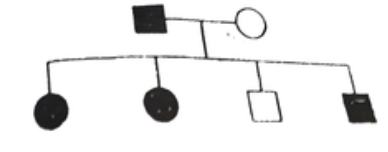 View Solution
