Which of the following graphs correctly represents the variation of β=−dV/dPV
with P for an ideal gas at constant temperature?
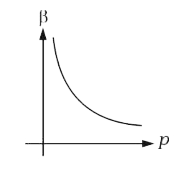
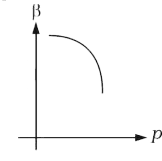
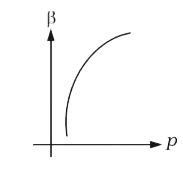
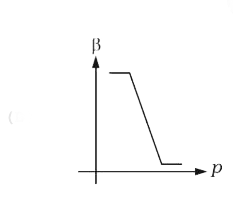
The correct Answer is:A
To solve the problem of determining how the parameter β=−dVdP⋅1V varies with pressure P for an ideal gas at constant temperature, we can follow these steps:
Step 1: Understand the Ideal Gas Law
The ideal gas law is given by the equation:
PV=nRT
where P is the pressure, V is the volume, n is the number of moles, R is the universal gas constant, and T is the temperature.
Step 2: Differentiate the Ideal Gas Law
At constant temperature, we can differentiate the ideal gas law with respect to pressure P. The differentiation gives us:
PdVdP+V=0
This is because nRT is constant when temperature T is constant.
Step 3: Solve for dVdP
Rearranging the equation from Step 2, we can isolate dVdP:
PdVdP=−V
dVdP=−VP
Step 4: Substitute into the Expression for β
Now, we substitute dVdP into the definition of β:
β=−dVdP⋅1V
Substituting dVdP=−VP:
β=−(−VP)⋅1V
This simplifies to:
β=1P
Step 5: Analyze the Relationship
The relationship β=1P indicates that β is inversely proportional to P. This means as pressure P increases, β decreases.
Step 6: Graphical Representation
The graph of β versus P will be a hyperbola, showing that β decreases as P increases. Specifically, it will approach zero as P increases indefinitely.
Conclusion
Thus, the correct graph representing the variation of β with P for an ideal gas at constant temperature is a hyperbolic graph, indicating that β is inversely proportional to P.
---
The ideal gas law is given by the equation:
PV=nRT
where P is the pressure, V is the volume, n is the number of moles, R is the universal gas constant, and T is the temperature.
At constant temperature, we can differentiate the ideal gas law with respect to pressure P. The differentiation gives us:
PdVdP+V=0
This is because nRT is constant when temperature T is constant.
Rearranging the equation from Step 2, we can isolate dVdP:
PdVdP=−V
dVdP=−VP
Now, we substitute dVdP into the definition of β:
β=−dVdP⋅1V
Substituting dVdP=−VP:
β=−(−VP)⋅1V
This simplifies to:
β=1P
The relationship β=1P indicates that β is inversely proportional to P. This means as pressure P increases, β decreases.
The graph of β versus P will be a hyperbola, showing that β decreases as P increases. Specifically, it will approach zero as P increases indefinitely.
Thus, the correct graph representing the variation of β with P for an ideal gas at constant temperature is a hyperbolic graph, indicating that β is inversely proportional to P.
Topper's Solved these Questions
- GASEOUS STATE & THERMODYNAMICSBOOK - VMC MODULES ENGLISHCHAPTER - GASEOUS STATE & THERMODYNAMICSEXERCISE - JEE MAIN (ARCHIVE )
81 Videos
- ENERGY & MOMENTUMBOOK - VMC MODULES ENGLISHCHAPTER - ENERGY & MOMENTUMEXERCISE - JEE ADVANCE (ARCHIVE) - TRUE/FALSE TYPE
1 Video
- GRAVITATIONBOOK - VMC MODULES ENGLISHCHAPTER - GRAVITATIONEXERCISE - JEE Advance (Archive) TRUE/FALSE
1 Video
Similar Questions
Knowledge Check
Which of the following graphs represent the behaviour of an ideal gas ?
A1.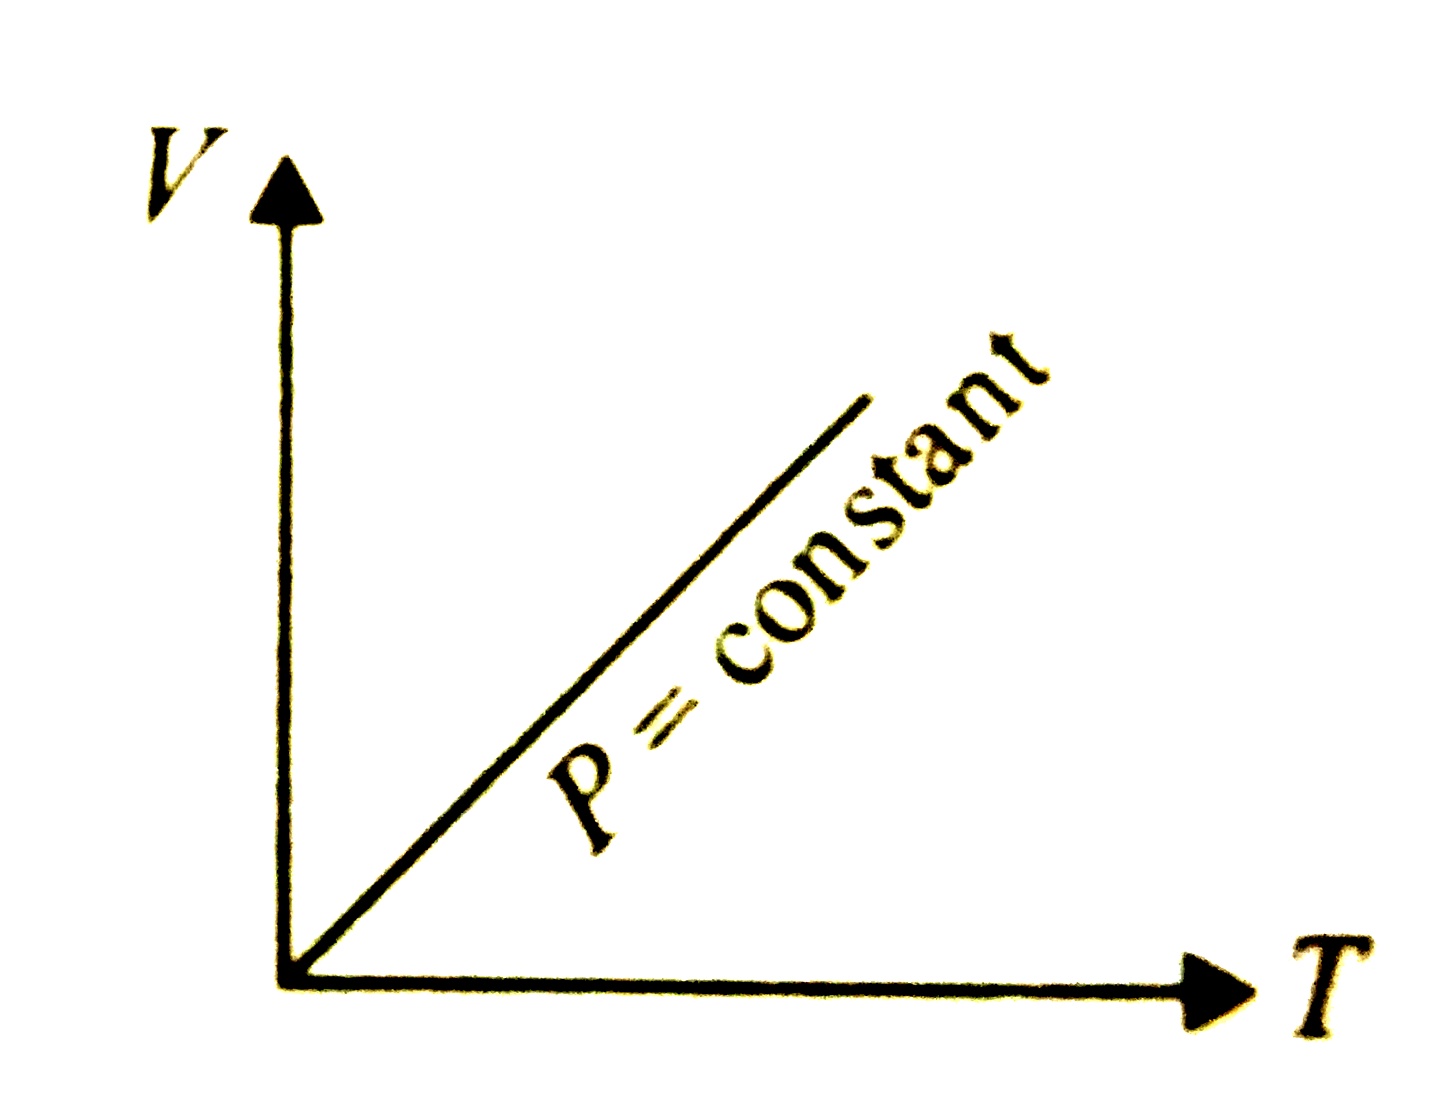 B2.
B2.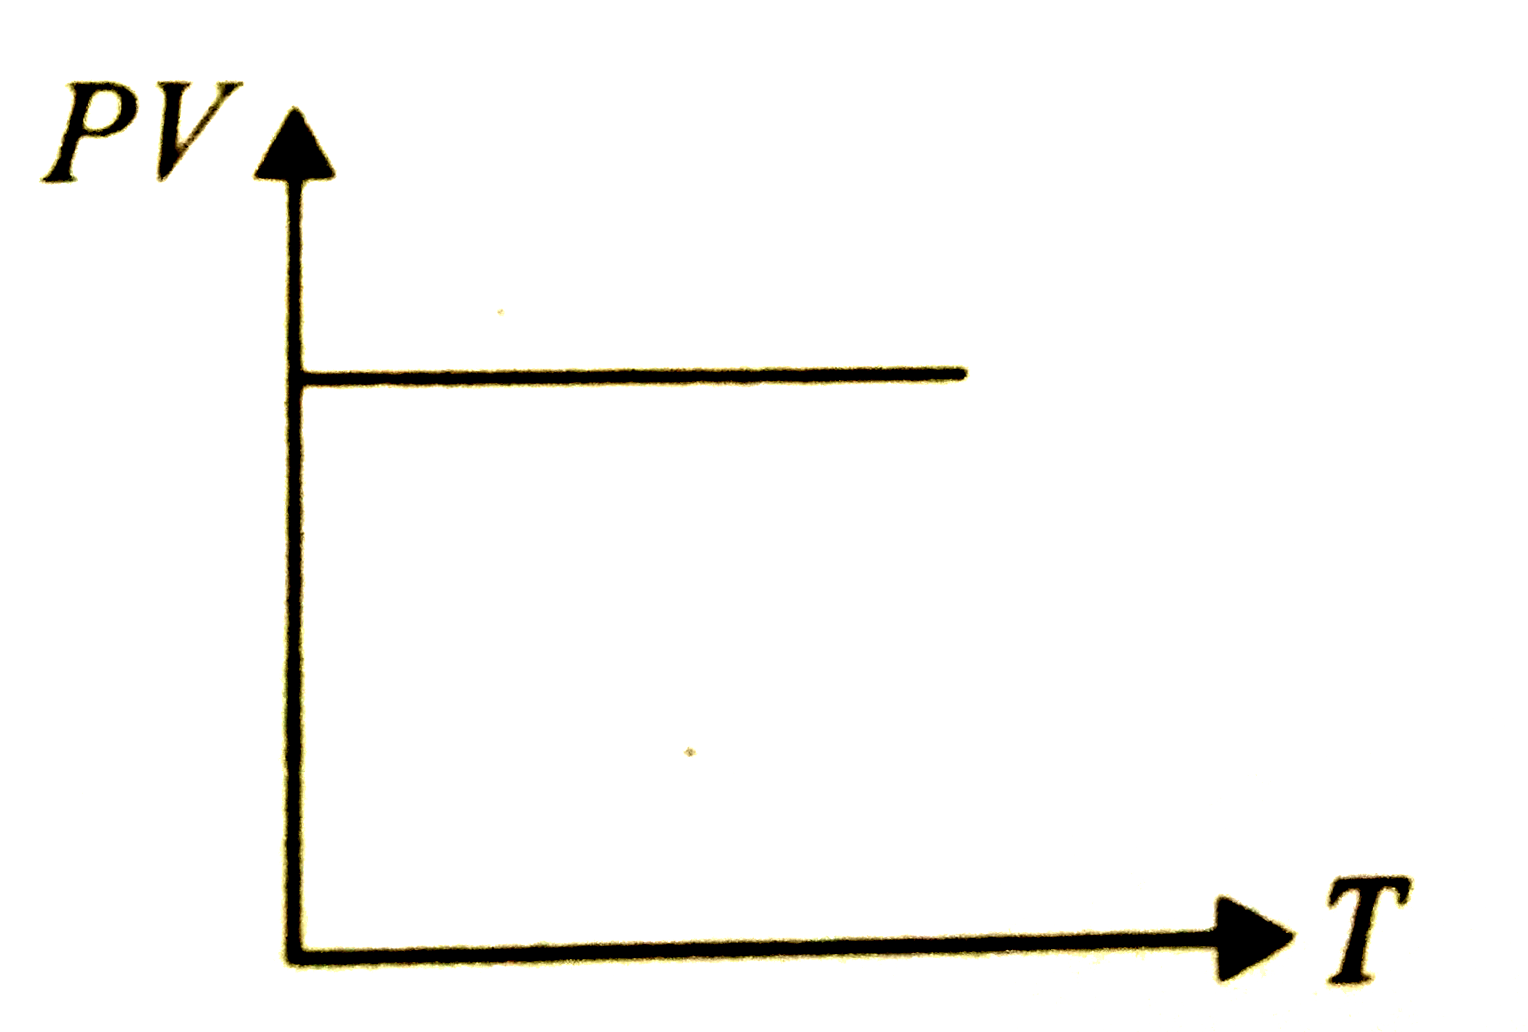 C3.
C3.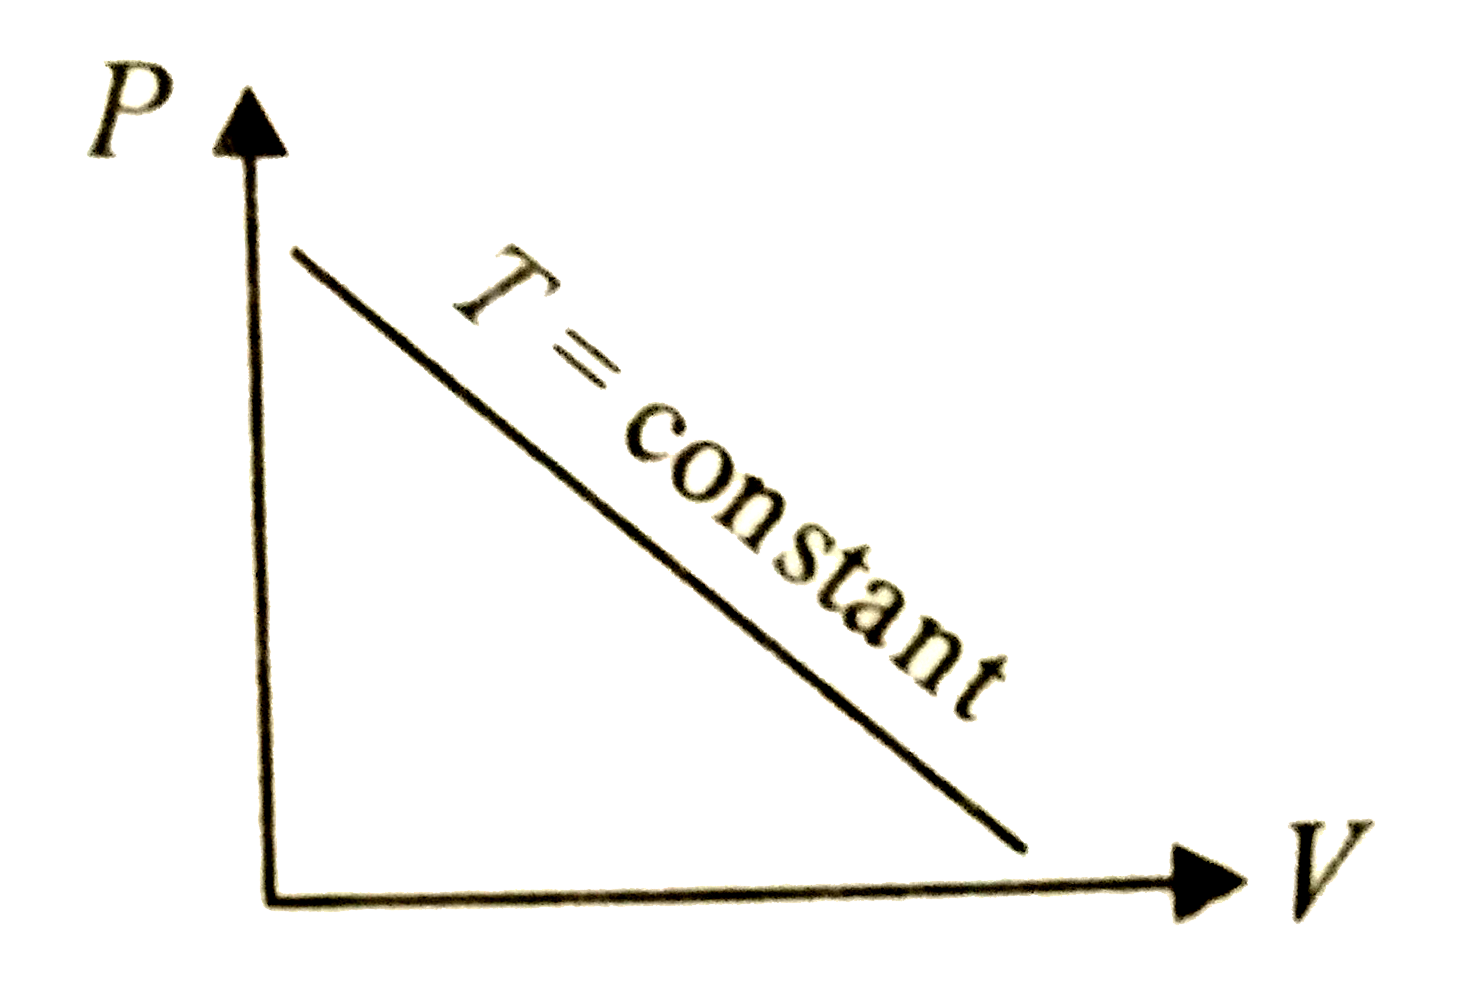 D4.
D4.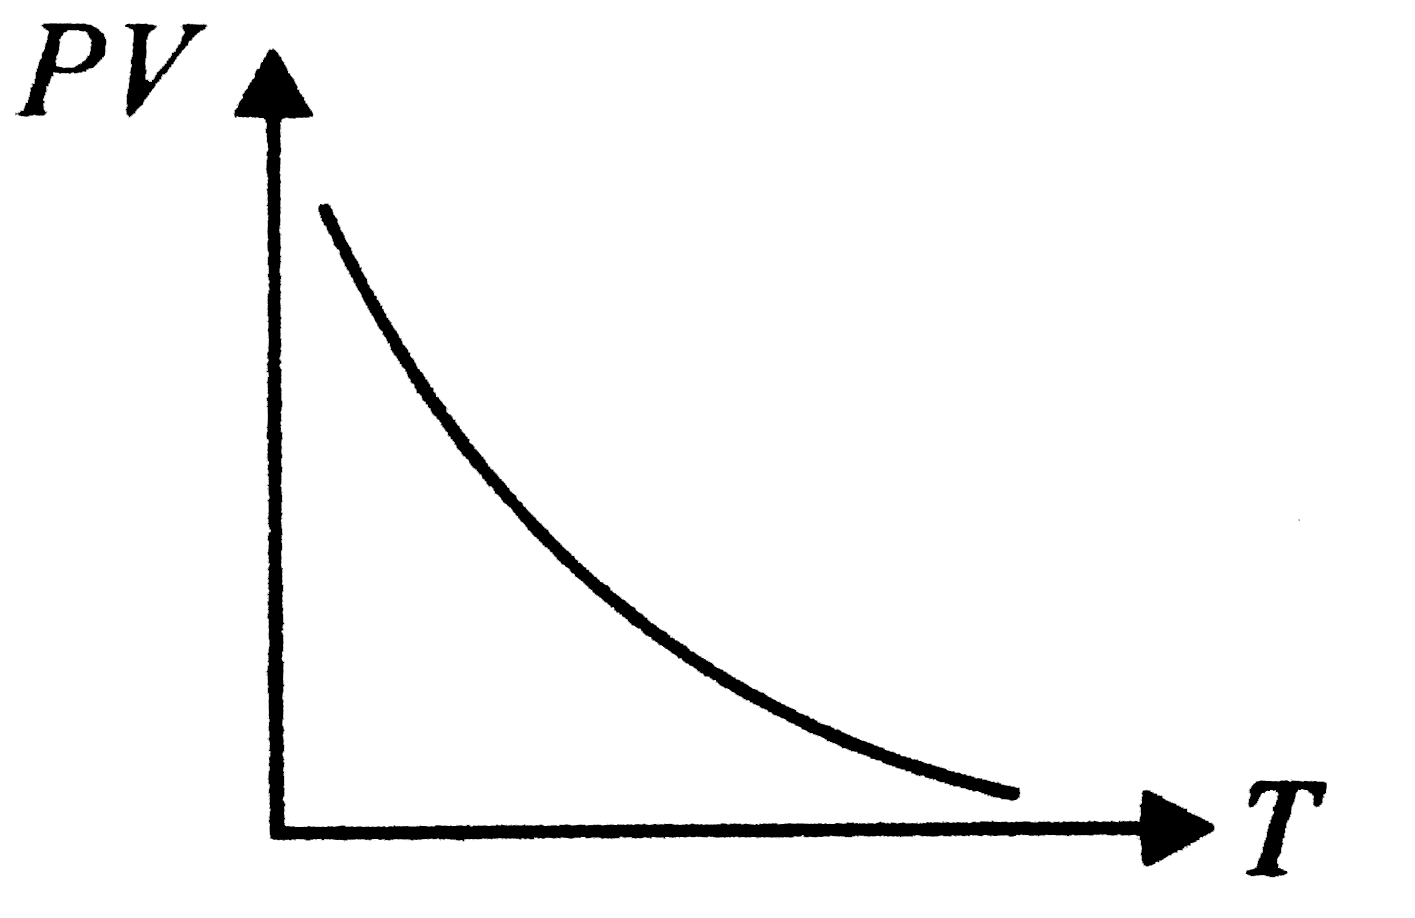
The velocity -displacement graph of a particle is as shown in the figure. Which of the following graphs correctly represents the variation of acceleration with displacement?
 A
A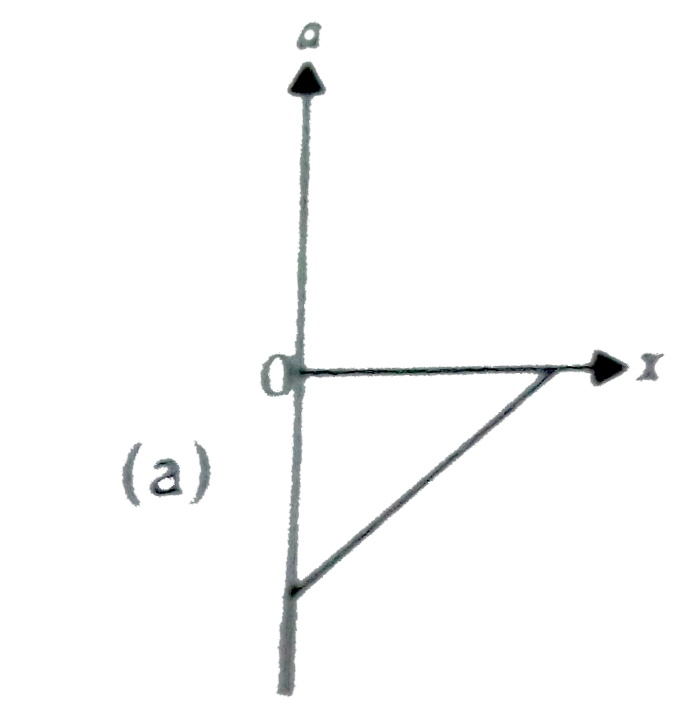 B
B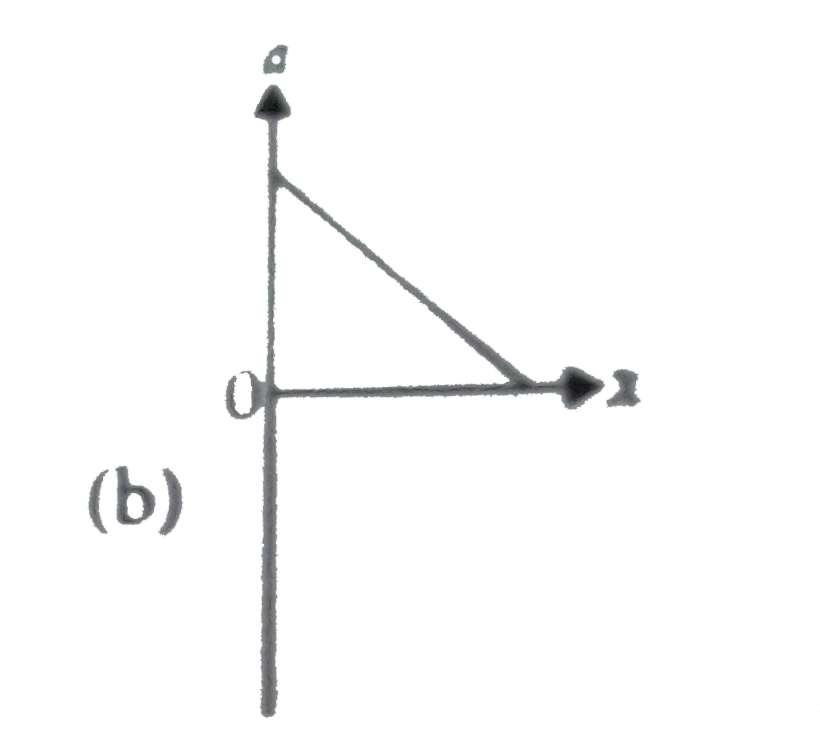 C
C D
D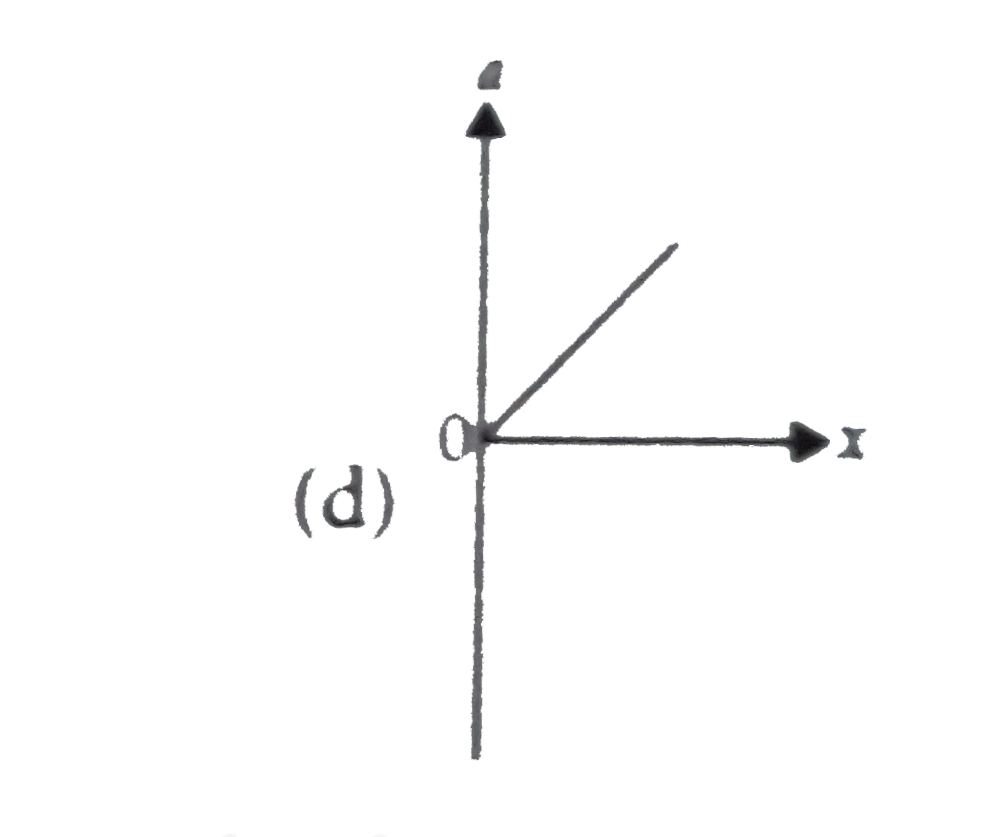
Within elastic limit, which of the following graphs correctly represents the variation of extension in the length of wire with the external load?
A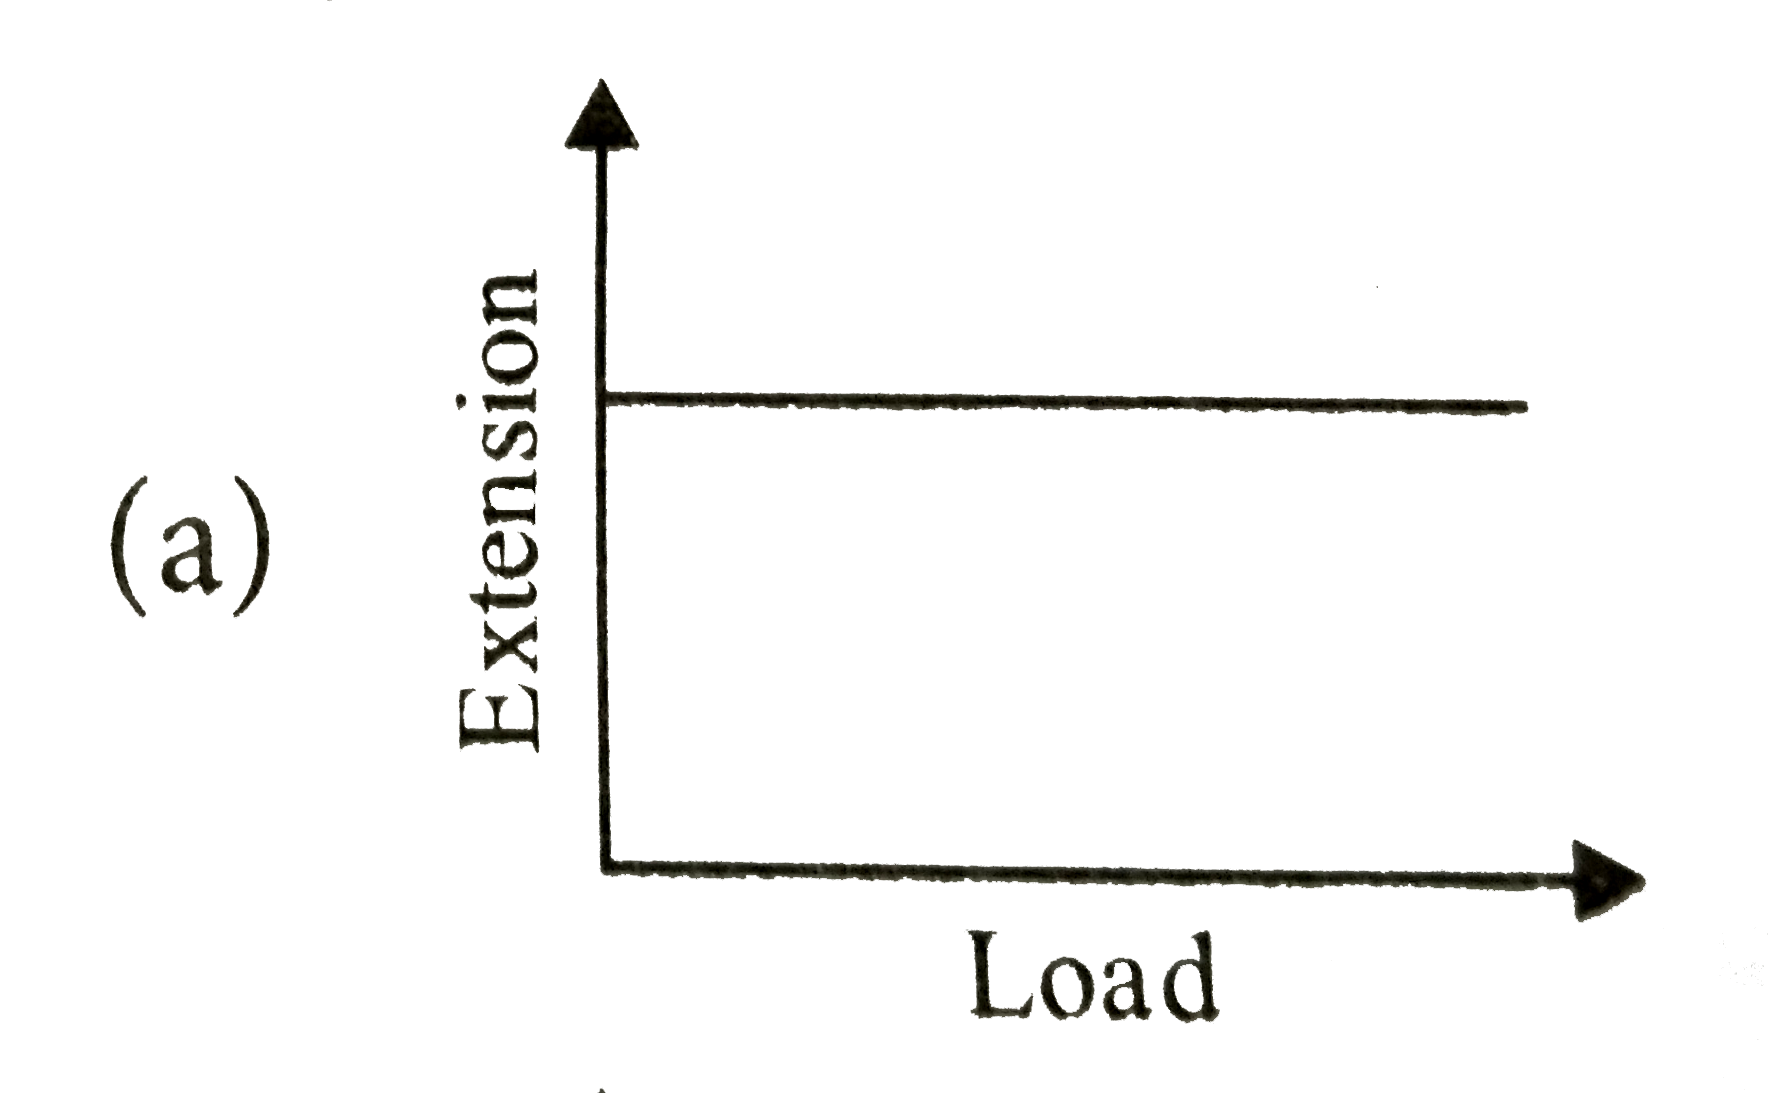 B
B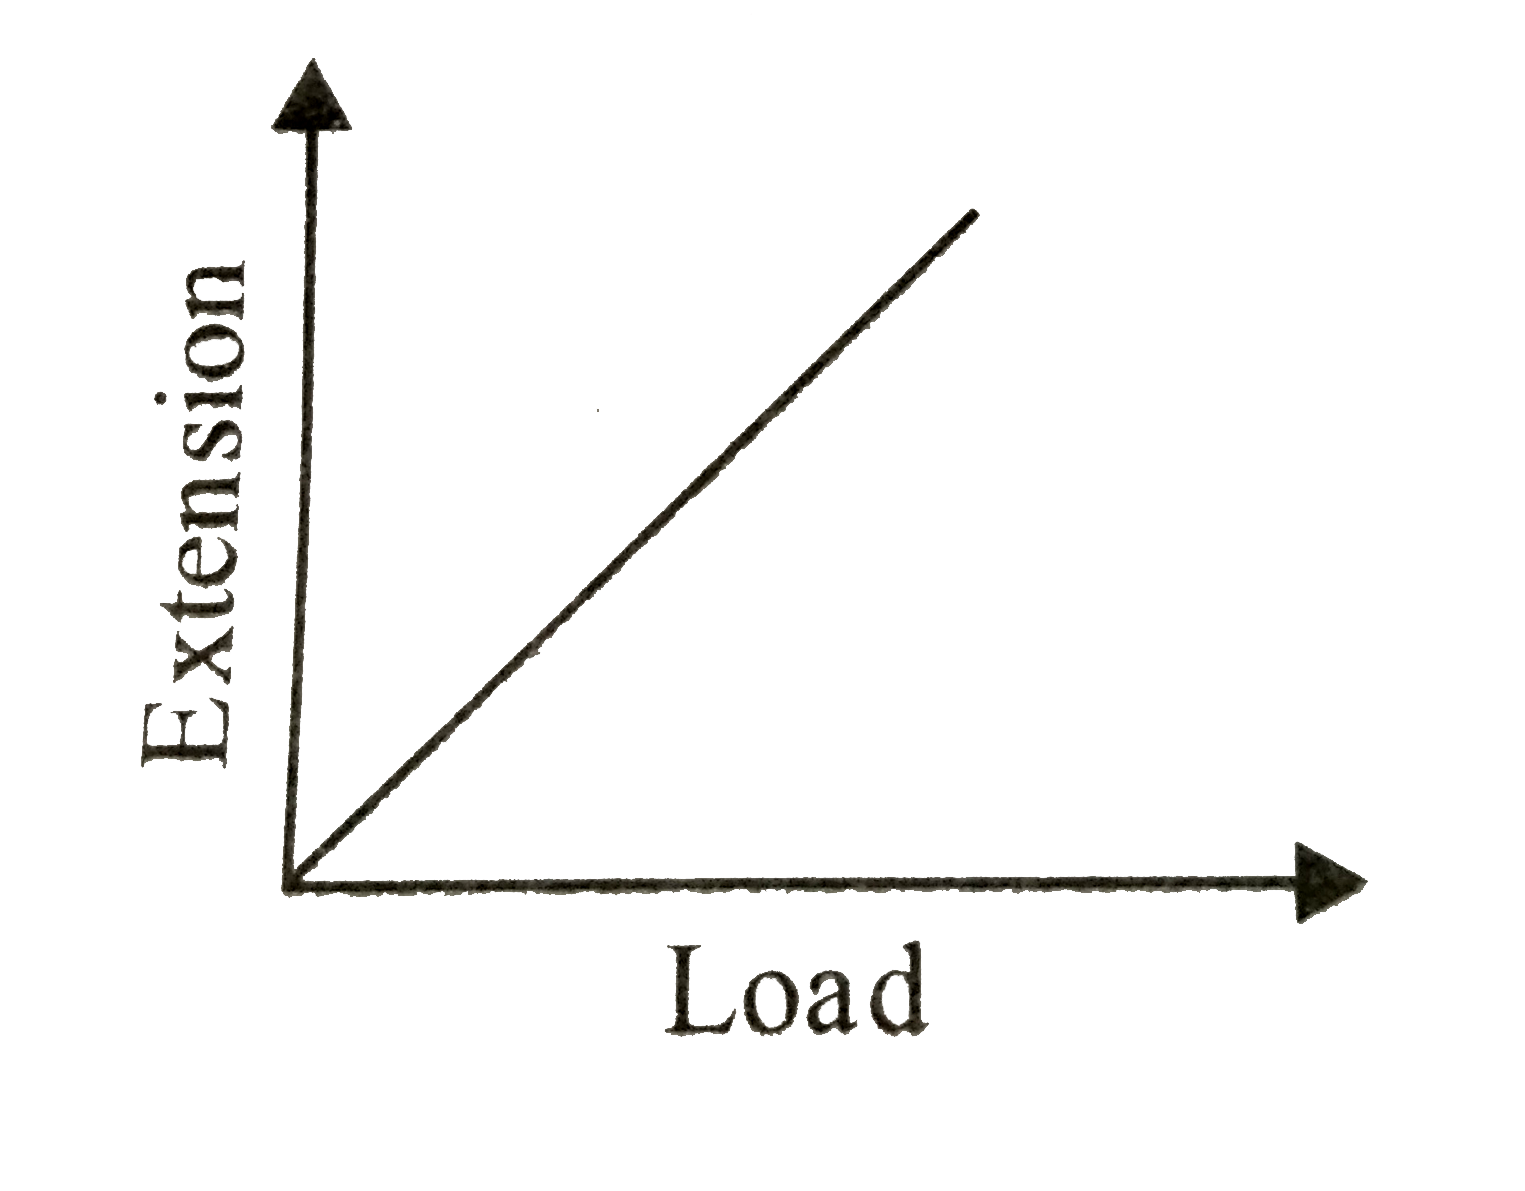 C
C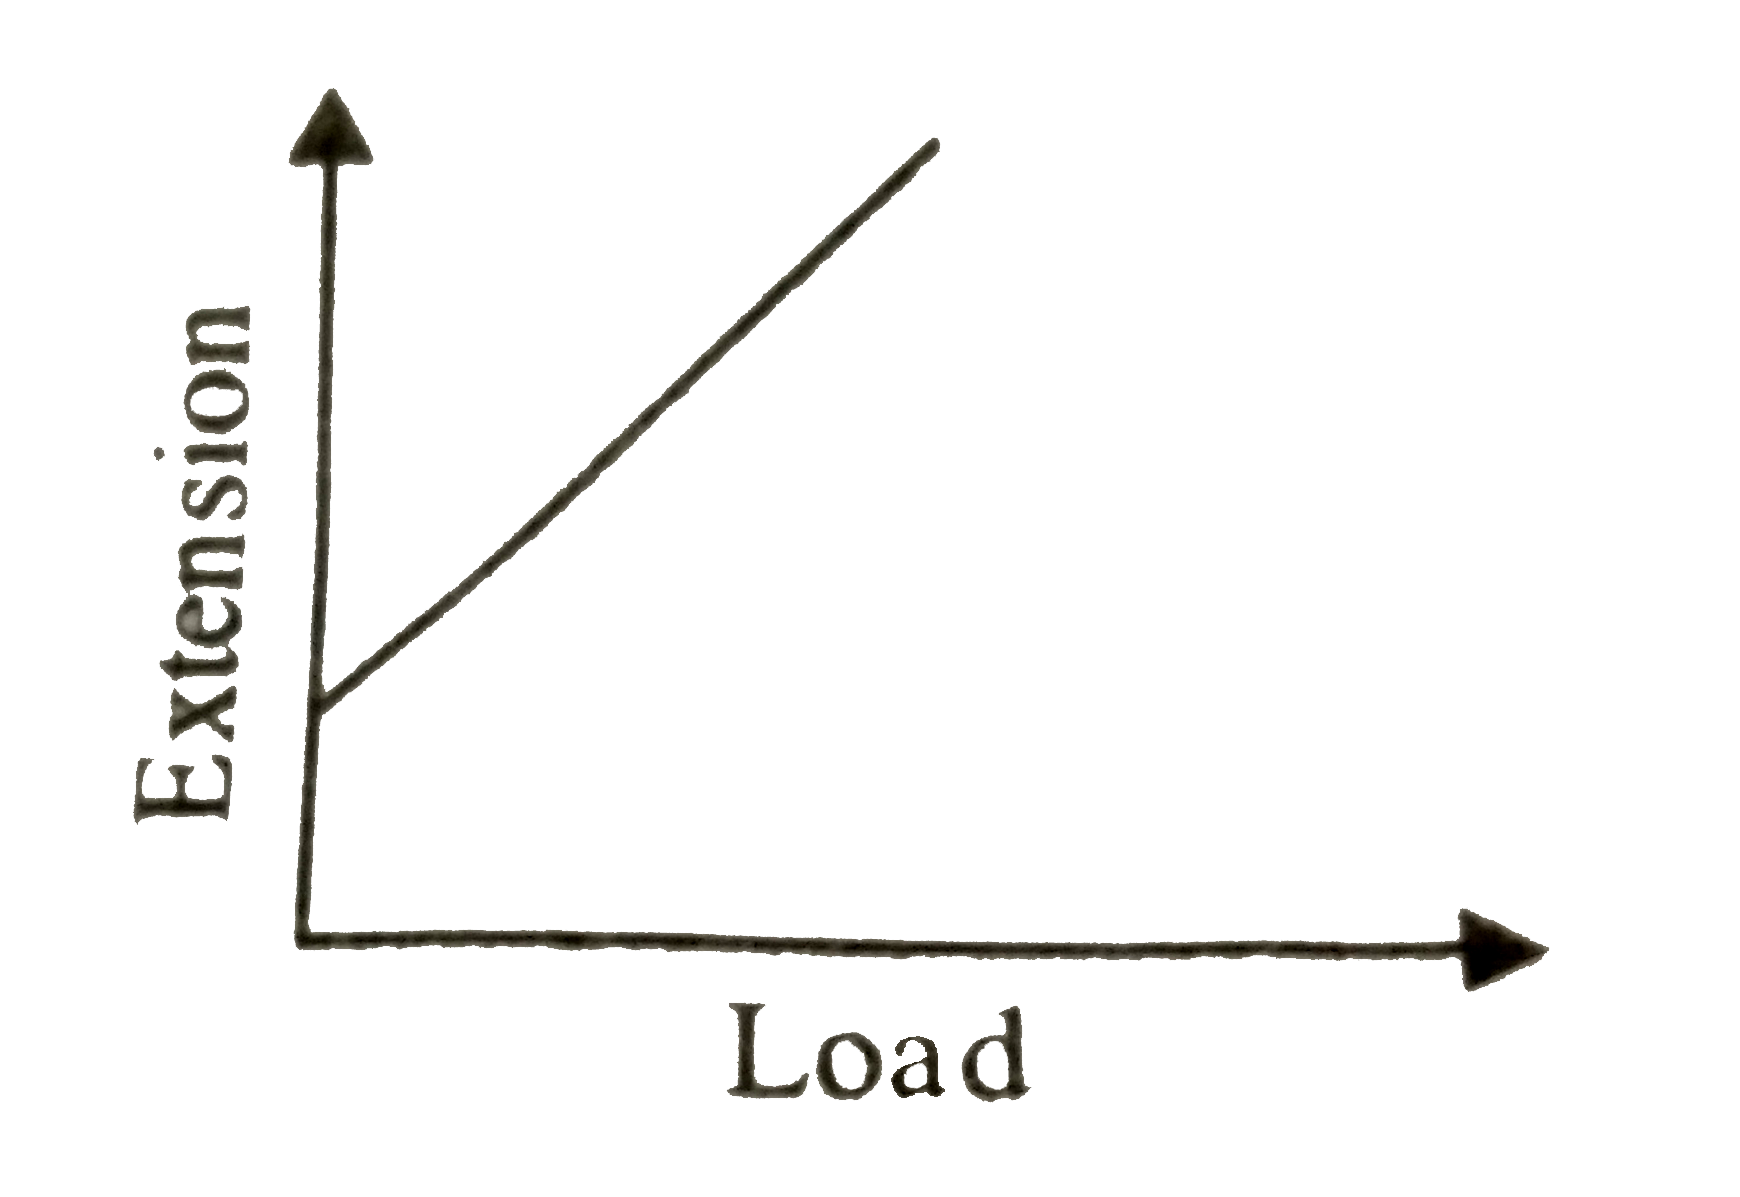 D
D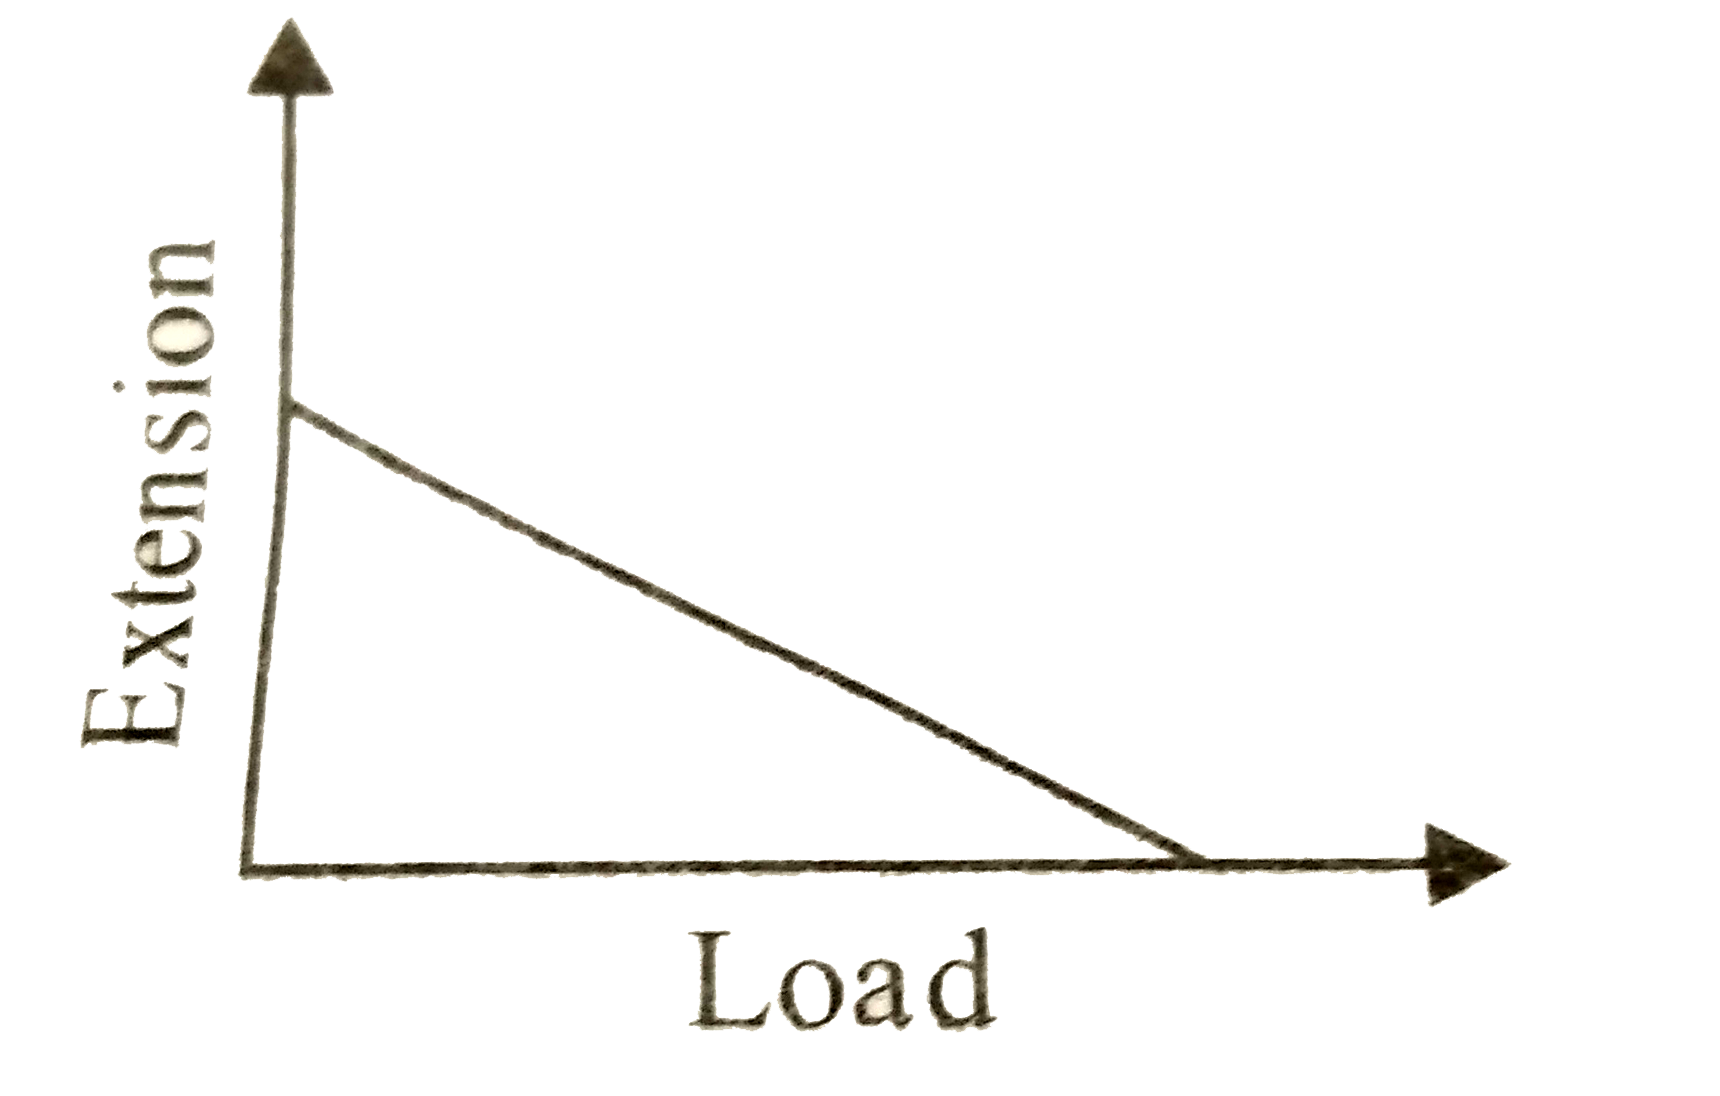
Which of the following graph is incorrect for an ideal gas?

View SolutionWhich of following graphs correctly represents the variation of particle momentum with de-Broglie wavelength?
View SolutionWhich of the following graph correctly represents the variation of molar conductance (Δm) with dilution for a strong electrolyte ?
View SolutionWhich of the following shown the correct relationship between the pressure 'P' and density ρ of an ideal gas at constant temperature?
View SolutionWhich of the following graph represents the variation of resistivity (ρ) with temperature (T) for copper?
View Solution
