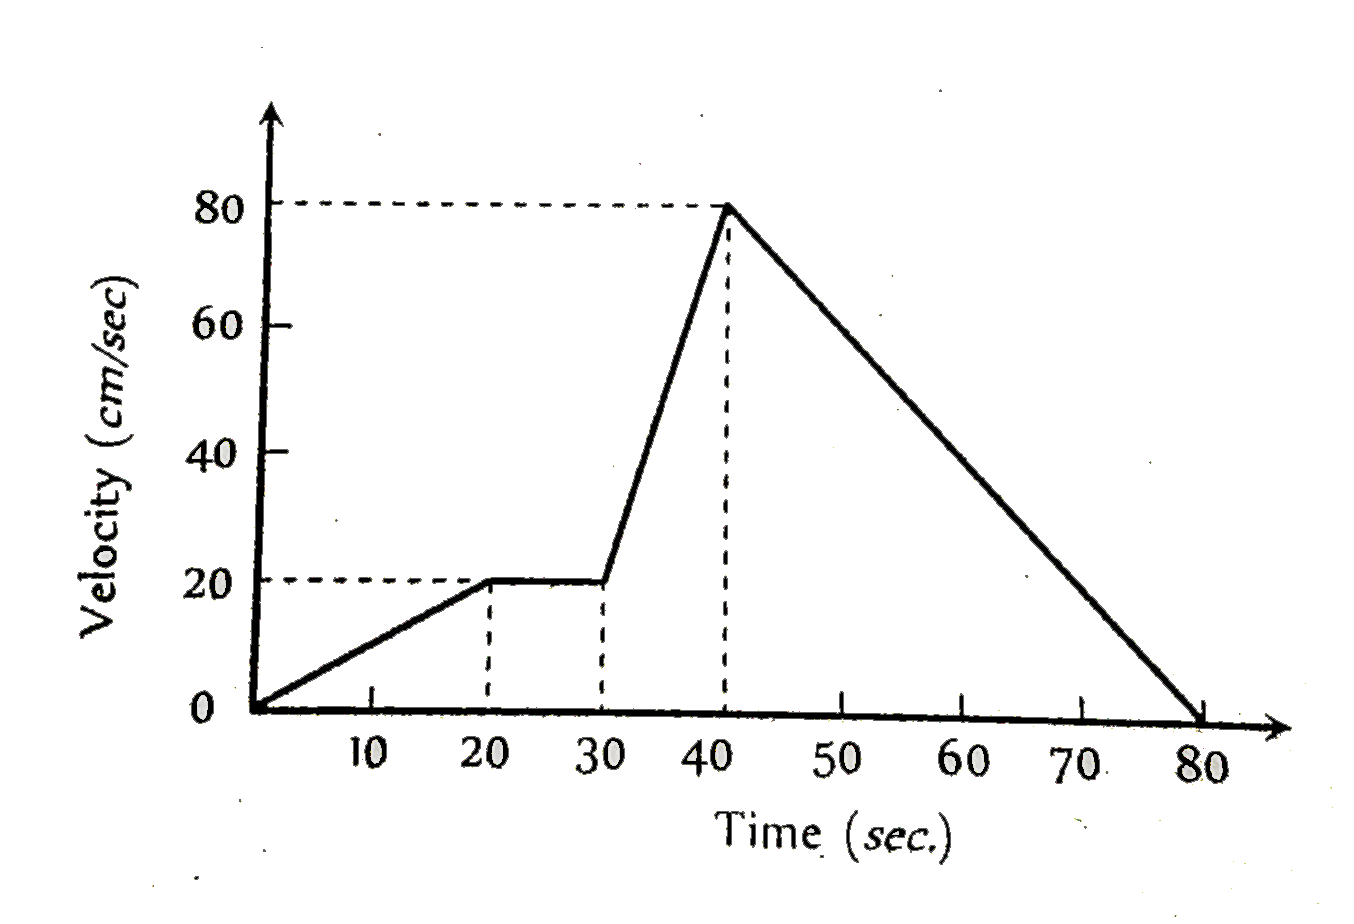
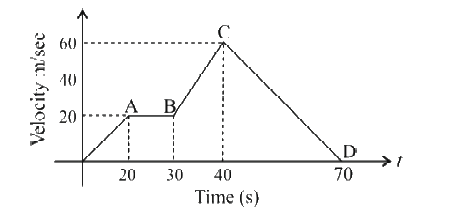
The v−t graph of a moving object is given in figure. The maximum acceleration is
1cms−2
2cms−2
3cms−2
6cms−2
The correct Answer is:D
Maximum acceleration means maximum change in velocity in minimum time interval.
In time interval t = 30 to t = 40 s
a=ΔυΔt=80−2040−30=6010=6cms−2
Topper's Solved these Questions
- MOTION IN A PLANEBOOK - DC PANDEY ENGLISHCHAPTER - MOTION IN A PLANEEXERCISE - Check point 3.7
15 Videos
- MOTION IN A PLANEBOOK - DC PANDEY ENGLISHCHAPTER - MOTION IN A PLANEEXERCISE - (A) Taking it together
75 Videos
- MOTION IN A PLANEBOOK - DC PANDEY ENGLISHCHAPTER - MOTION IN A PLANEEXERCISE - Check point 3.5
25 Videos
- MOTIONBOOK - DC PANDEY ENGLISHCHAPTER - MOTIONEXERCISE - Medical entrances gallery
19 Videos
- PROJECTILE MOTIONBOOK - DC PANDEY ENGLISHCHAPTER - PROJECTILE MOTIONEXERCISE - Level - 2 Subjective
10 Videos
Similar Questions
The velocity-time graph of a moving object is given in the figure. Draw the acceleration versus time and displacement versus time graph. Find the distance travelled during the time interval when the acceleration is maximum . Assume that the particle starts from origin.
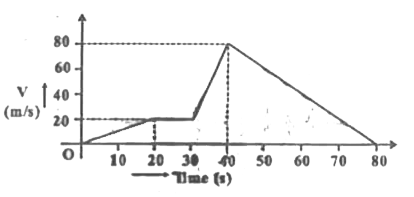
View SolutionThe velocity-time graph of a body is given in. The maximum acceleration in ms−1 is .
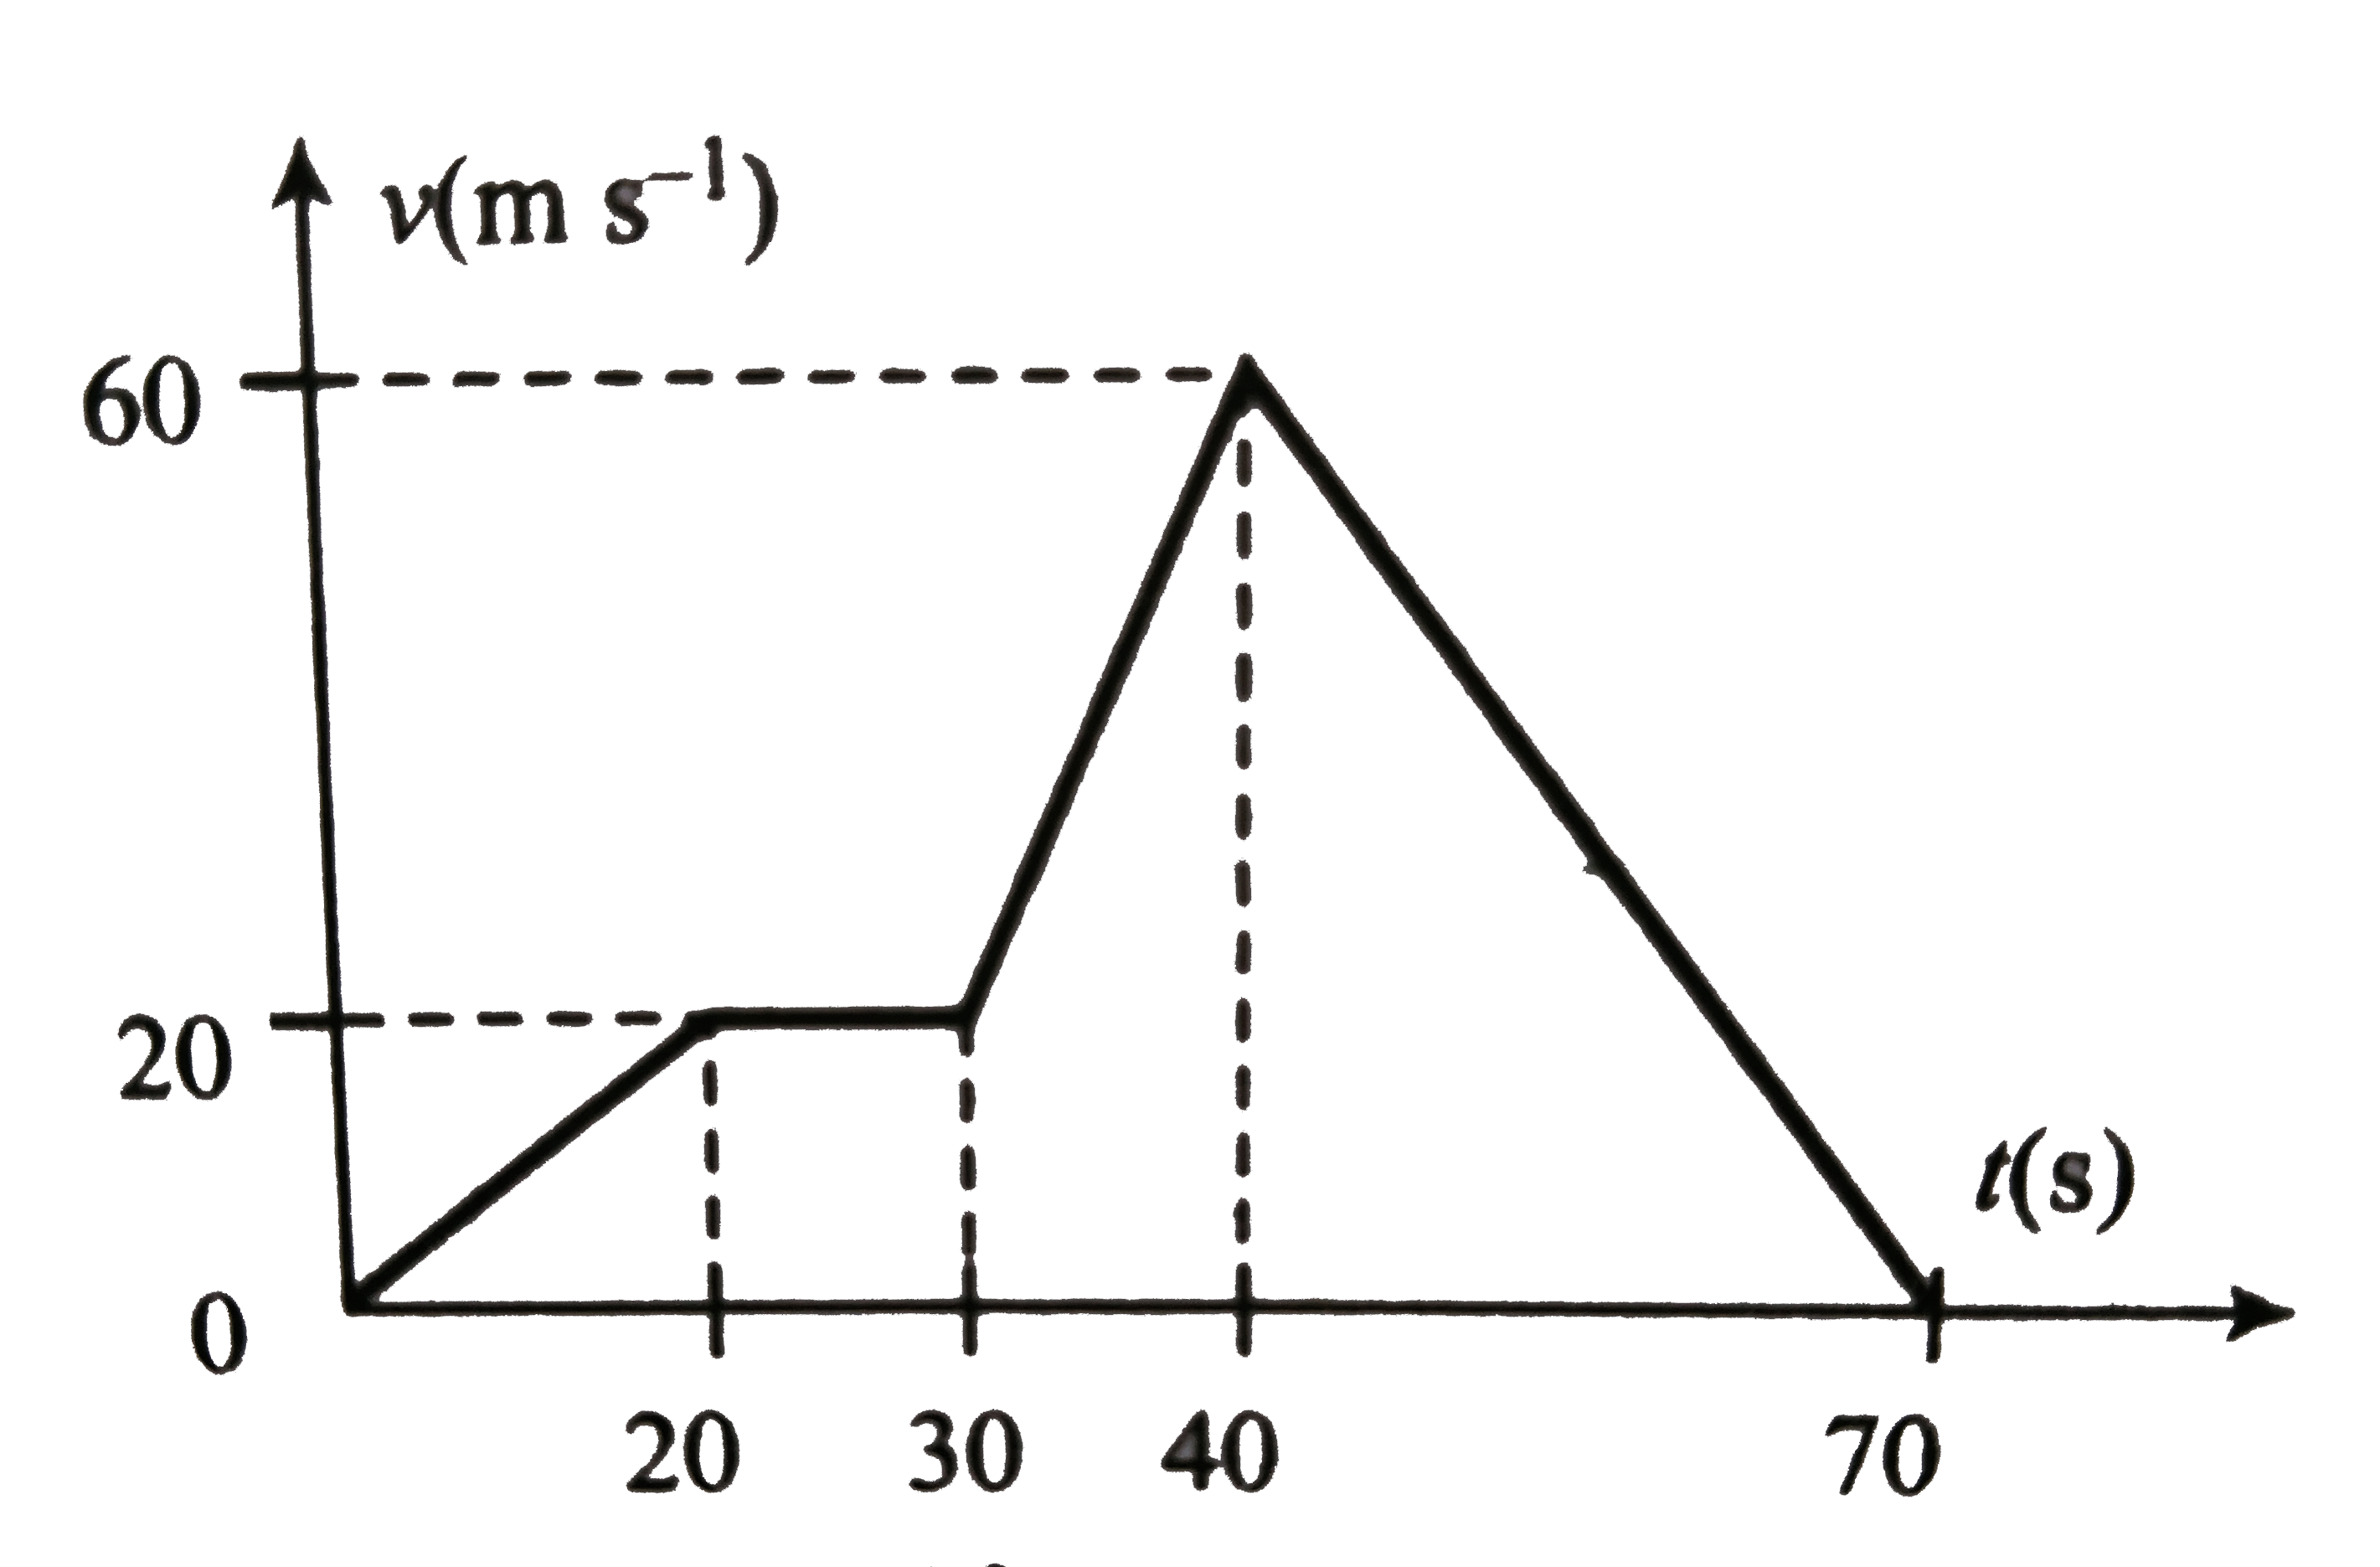 .
.
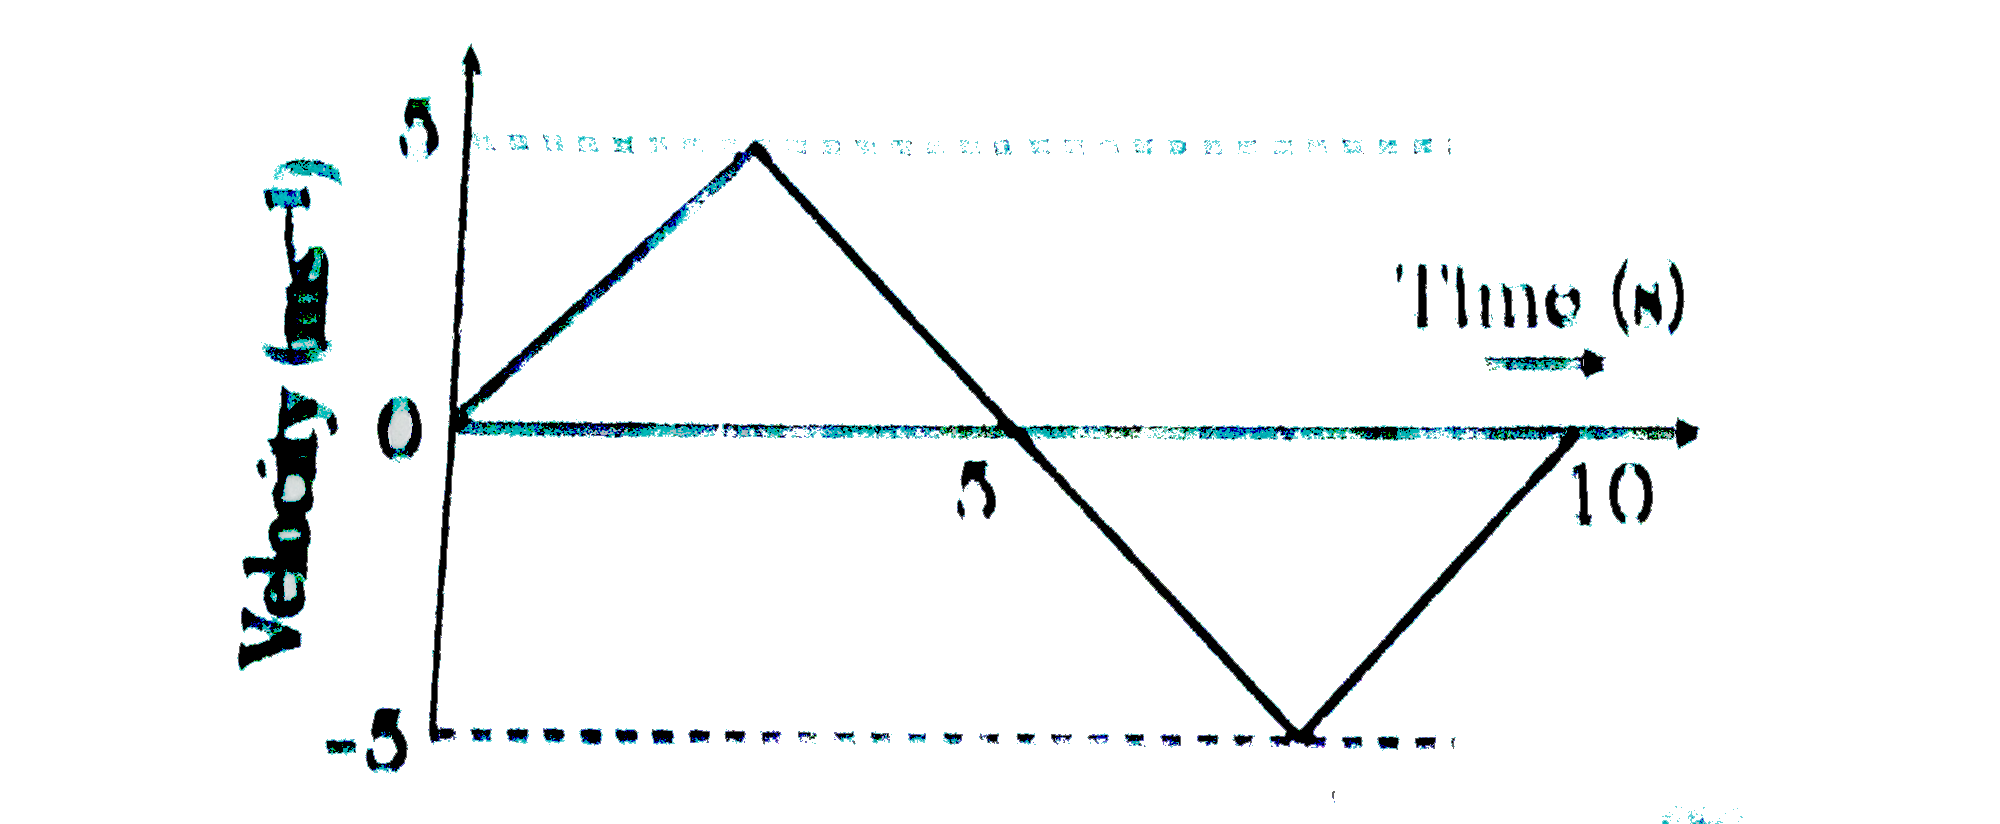
View SolutionThe v-t plot of a moving object ios shown in the figure. The average velocity of the object during the first 10 s is
View SolutionThe velocity-time graph of an object is given below. Calculate the average acceleration of the object in the time interval of 4 s to 6 s.
View SolutionVelocity-time (v-t) graph for a moving object is shown in the figure. Total displacement of the object during the time interval when there is non-zero acceleration and retardation is

View SolutionThe following shows the velocity-timegraphfor a moving object. The maximum acceleration will be
View SolutionVelocity -time (v-t) graph for a moving object is shown in the figure .Total displacement of the object during the time interval when there is non-zero acceleration and reatardation is
View SolutionThe velocity-time graph of an object is shown below. The acceleration of the object is
View SolutionDraw the position-time graph of a moving object, moving with zero acceleration.
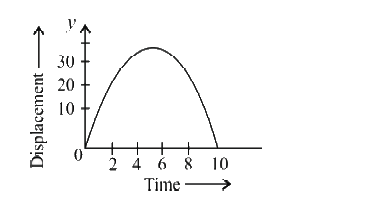
View SolutionThe displacement-time graph of a moving object is shown in figure. Which of the velocity-time graphs shown in figure could represent the motion of the same body ?
View Solution
