Draw the position-time graph of a moving object, moving with zero acceleration.
To draw the position-time graph of a moving object with zero acceleration, follow these steps:
Step 1: Understand the Concept of Zero Acceleration
- Explanation: Acceleration is defined as the rate of change of velocity. If an object has zero acceleration, it means that its velocity is constant.
Step 2: Establish the Relationship Between Displacement and Time
- Explanation: Since the velocity is constant, the displacement (x) changes at a constant rate with respect to time (t). This can be mathematically represented as:
dxdt=c
where c is a constant representing the constant velocity.
Step 3: Integrate the Relationship
- Explanation: Integrating the equation gives us the relationship between displacement and time:
x=ct
This indicates that displacement is directly proportional to time.
Step 4: Draw the Graph
- Explanation: On a graph where the x-axis represents time (t) and the y-axis represents displacement (x), the equation x=ct represents a straight line passing through the origin (0,0) with a slope equal to c. The slope indicates the constant velocity of the object.
Step 5: Label the Graph
- Explanation: Make sure to label the axes properly. The x-axis should be labeled as "Time (t)" and the y-axis as "Displacement (x)". The line should be drawn straight, indicating constant velocity.
Final Graph
- Explanation: The final graph will be a straight line starting from the origin, indicating that as time increases, displacement increases linearly at a constant rate.
---
- Explanation: Acceleration is defined as the rate of change of velocity. If an object has zero acceleration, it means that its velocity is constant.
- Explanation: Since the velocity is constant, the displacement (x) changes at a constant rate with respect to time (t). This can be mathematically represented as:
dxdt=c
where c is a constant representing the constant velocity.
- Explanation: Integrating the equation gives us the relationship between displacement and time:
x=ct
This indicates that displacement is directly proportional to time.
- Explanation: On a graph where the x-axis represents time (t) and the y-axis represents displacement (x), the equation x=ct represents a straight line passing through the origin (0,0) with a slope equal to c. The slope indicates the constant velocity of the object.
- Explanation: Make sure to label the axes properly. The x-axis should be labeled as "Time (t)" and the y-axis as "Displacement (x)". The line should be drawn straight, indicating constant velocity.
- Explanation: The final graph will be a straight line starting from the origin, indicating that as time increases, displacement increases linearly at a constant rate.
Topper's Solved these Questions
- MOTION IN A STRAIGHT LINEBook:AAKASH INSTITUTE ENGLISHChapter:MOTION IN A STRAIGHT LINEExercise:EXERCISE
Explore 29 Videos
- MOTION IN A STRAIGHT LINEBook:AAKASH INSTITUTE ENGLISHChapter:MOTION IN A STRAIGHT LINEExercise:ASSIGNMENT (SECTION - A)
Explore 58 Videos
- MOTION IN A STRAIGHT LINEBook:AAKASH INSTITUTE ENGLISHChapter:MOTION IN A STRAIGHT LINEExercise:ASSIGNMENT (SECTION - D)
Explore 15 Videos
- MOTION IN A PLANEBook:AAKASH INSTITUTE ENGLISHChapter:MOTION IN A PLANEExercise:Assignement section -J (Aakash Challengers Questions)
Explore 7 Videos
- MOTION IN STRAIGHT LINEBook:AAKASH INSTITUTE ENGLISHChapter:MOTION IN STRAIGHT LINEExercise:Assignment (SECTION - J)
Explore 2 Videos
Similar Questions
Knowledge Check
Position-time graph for motion with zero acceleration is
A B
B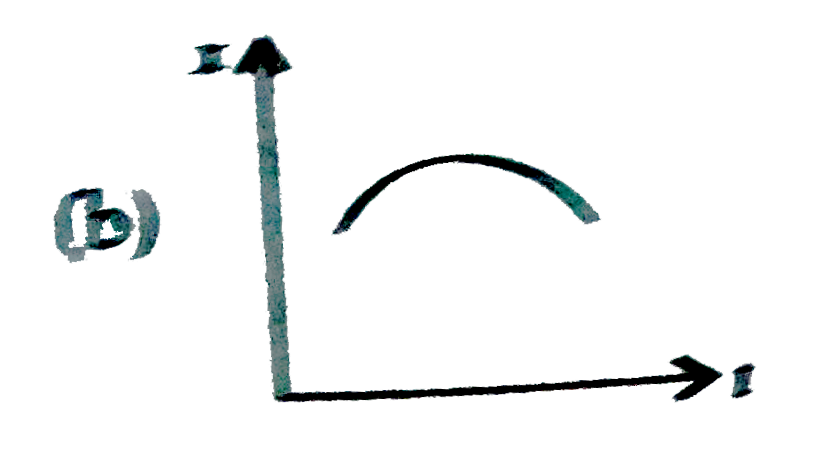 C
C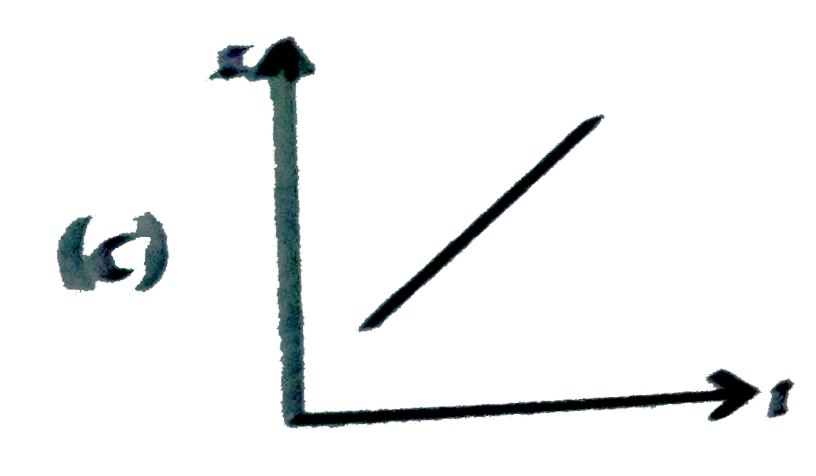 D
D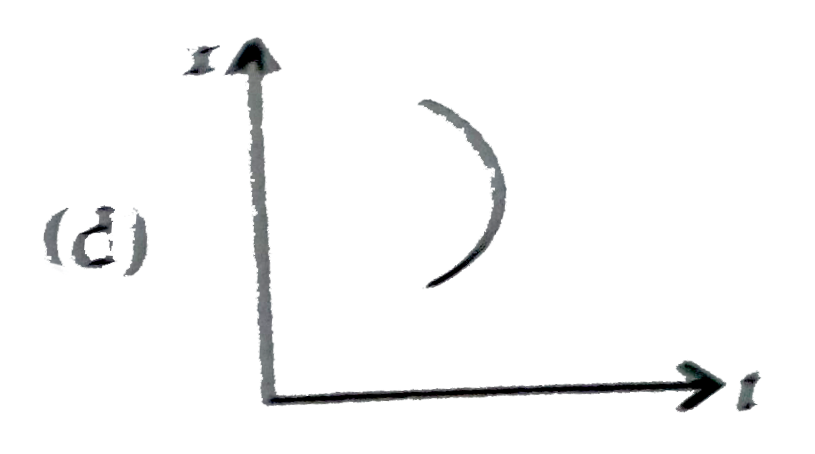
Which one of the following represents displacement-time graph of two objects A and B moving with zero relative velocity?
A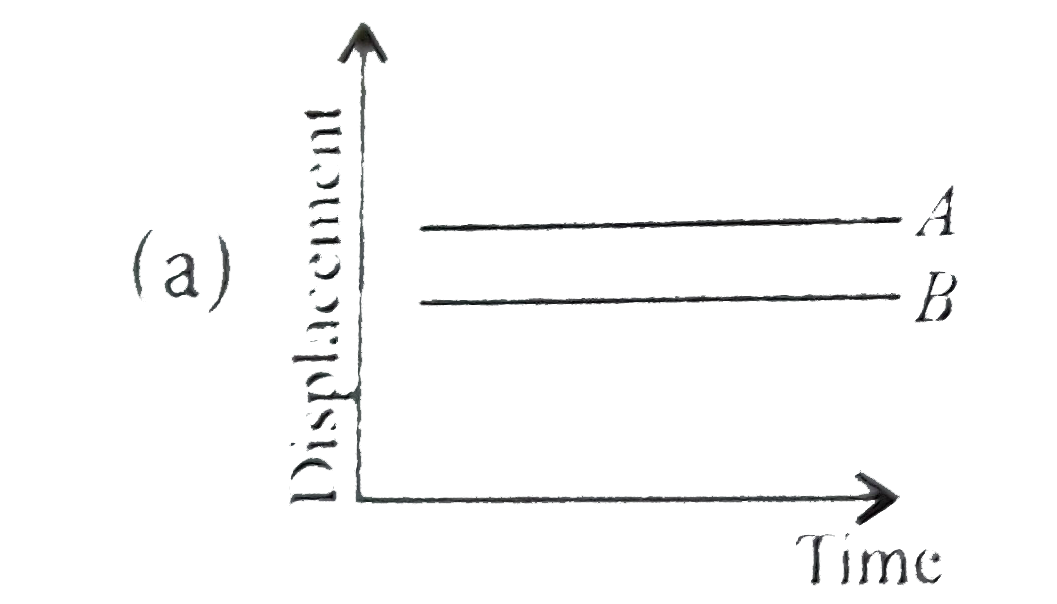 B
B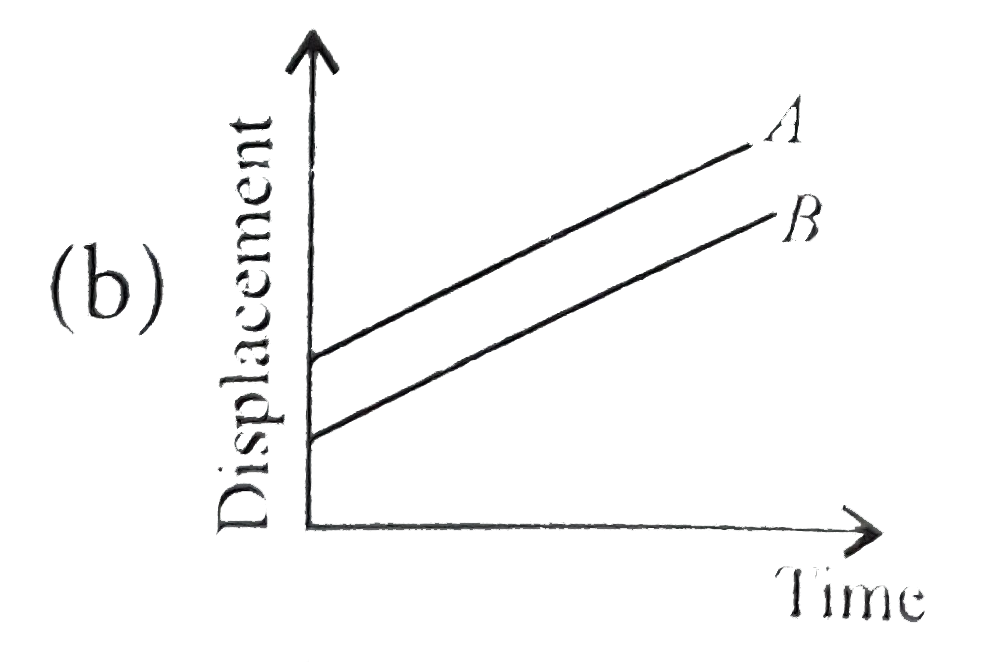 C
C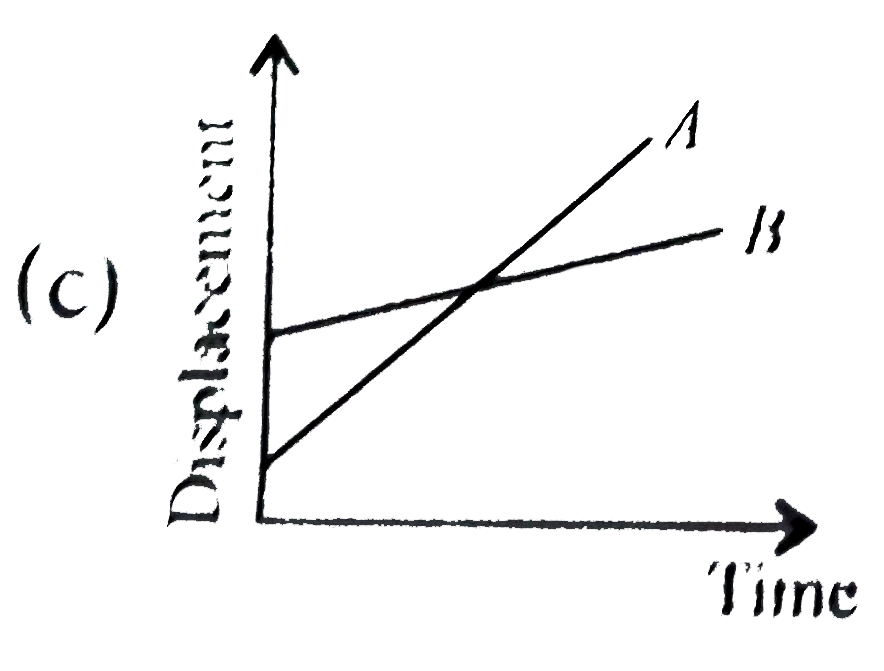 D
D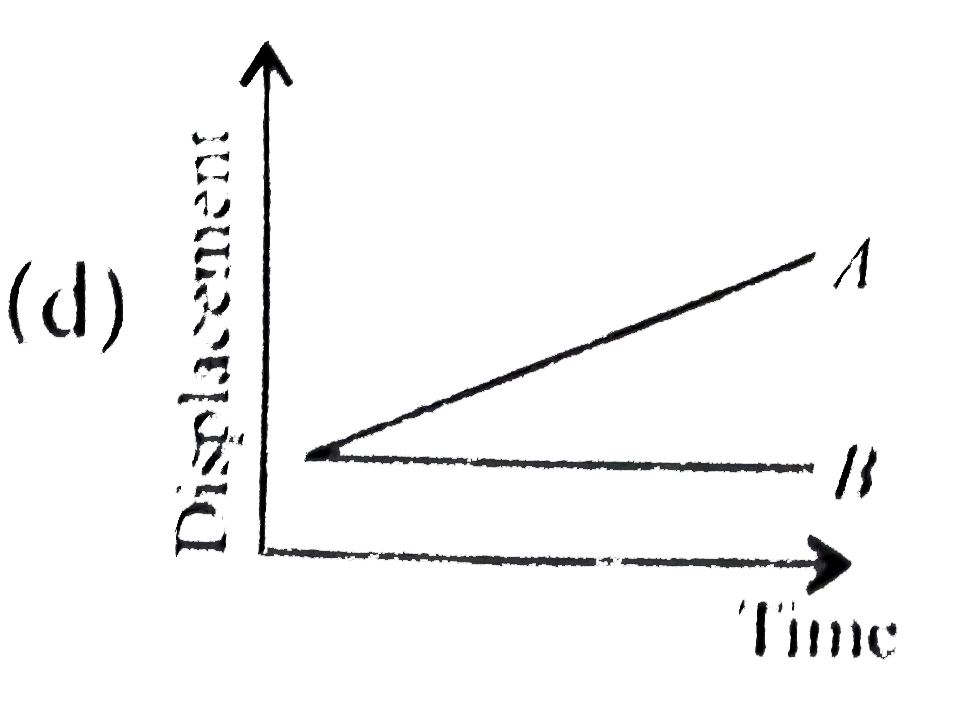
Draw the velocity-time graph of an object moving with uniform negative acceleration.
View SolutionWhich of the following x - t graphs shows an object moving with negative acceleration?

View SolutionA particle is moving along the x-axis and its position-time graph is shown. Determine the sign of acceleration.
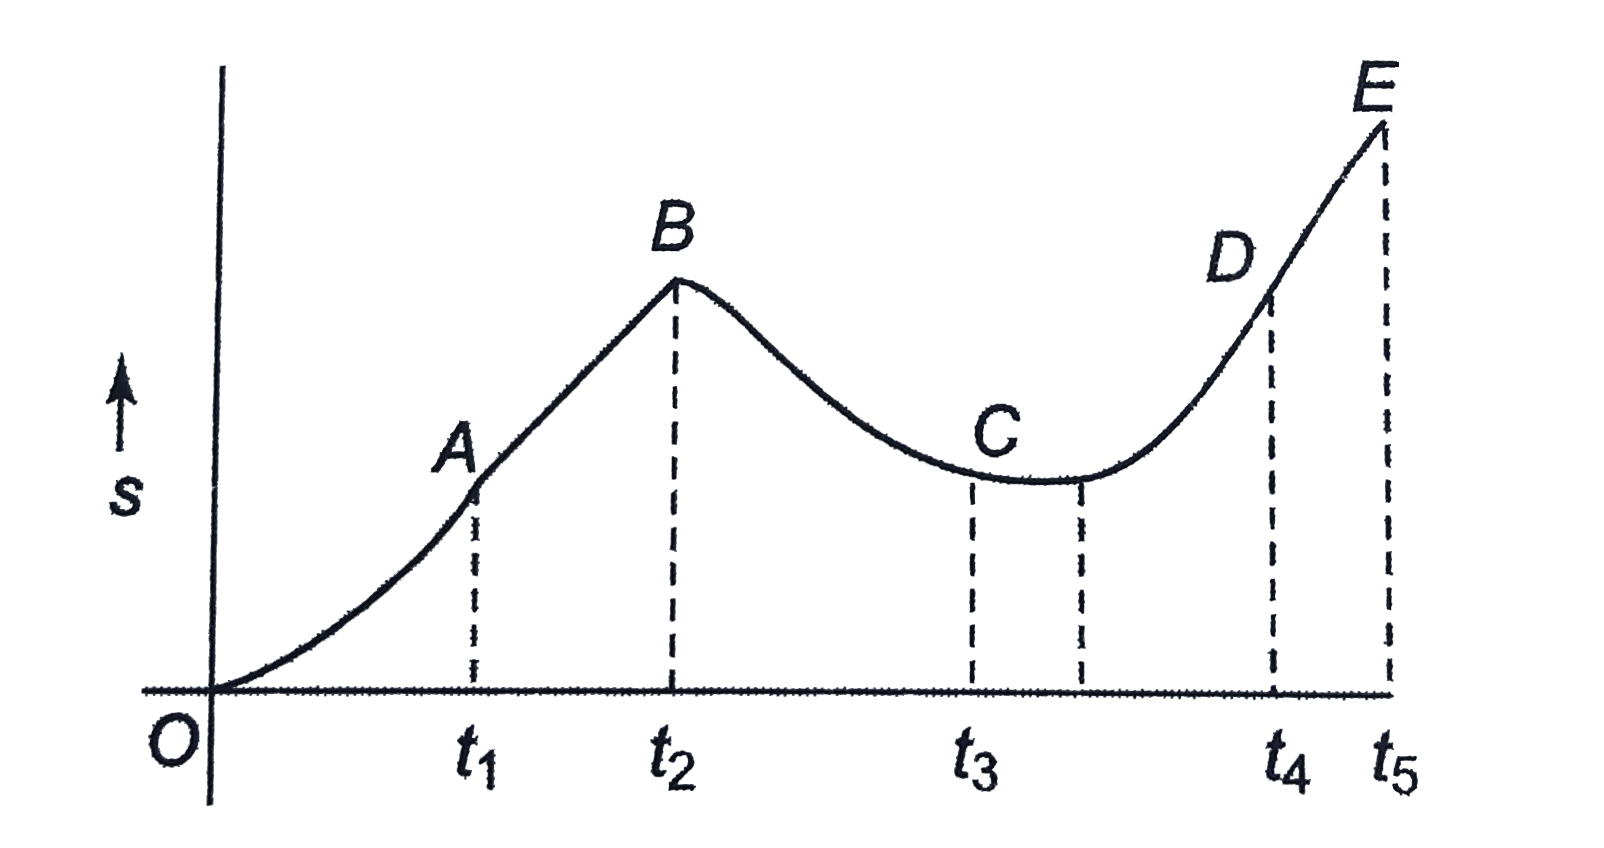
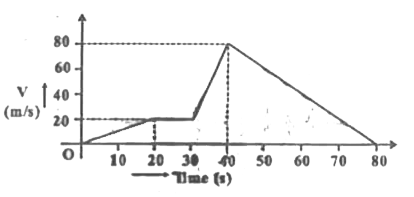
View SolutionThe velocity-time graph of a moving object is given in the figure. Draw the acceleration versus time and displacement versus time graph. Find the distance travelled during the time interval when the acceleration is maximum . Assume that the particle starts from origin.
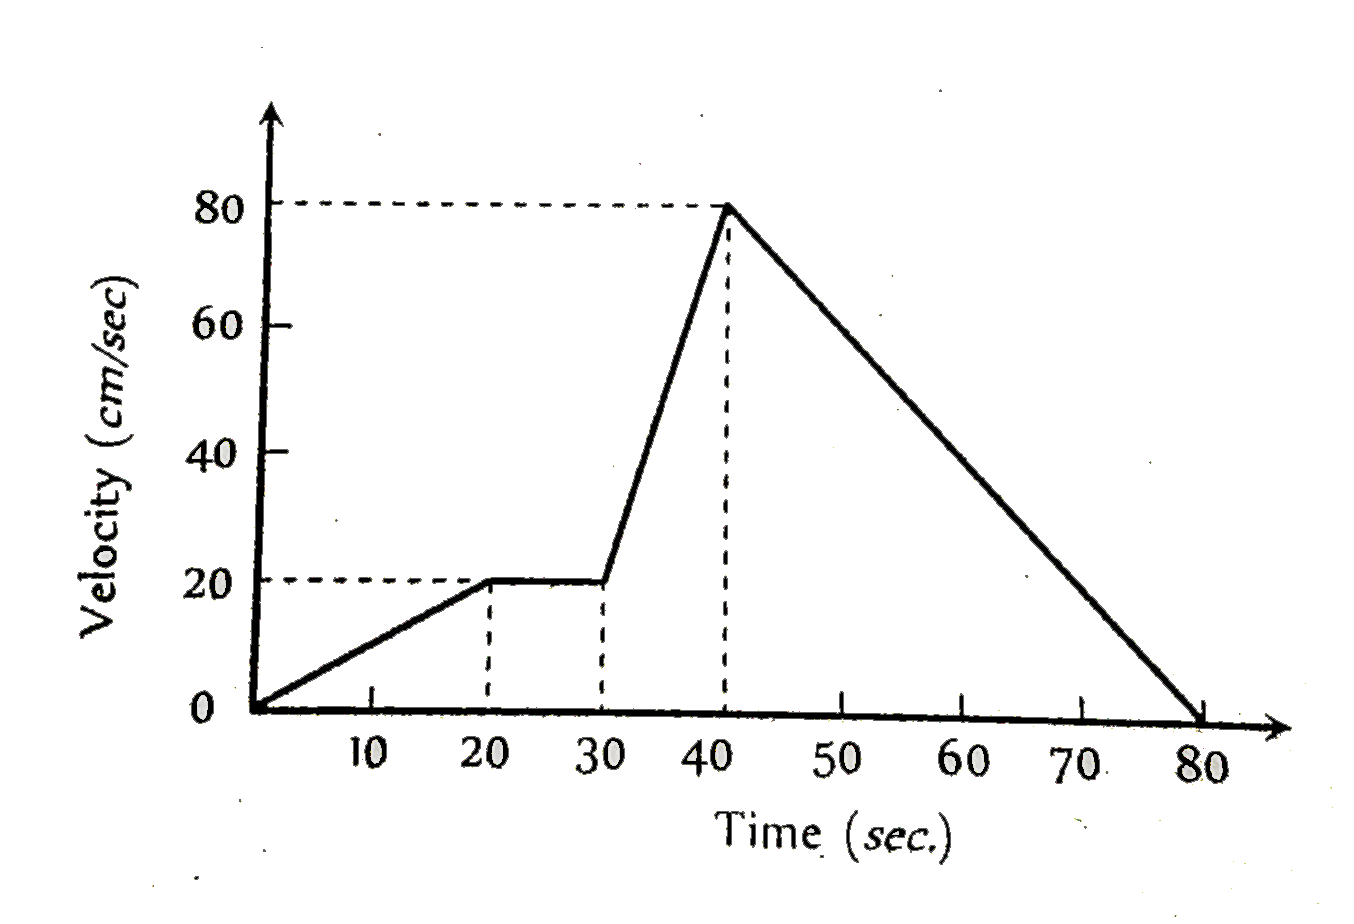
View SolutionThe following shows the velocity-timegraphfor a moving object. The maximum acceleration will be
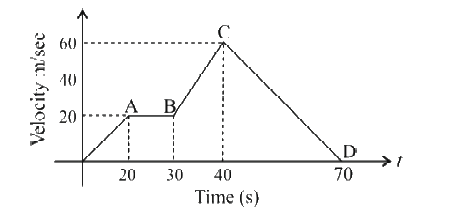
View SolutionThe v−t graph of a moving object is given in figure. The maximum acceleration is
View Solution