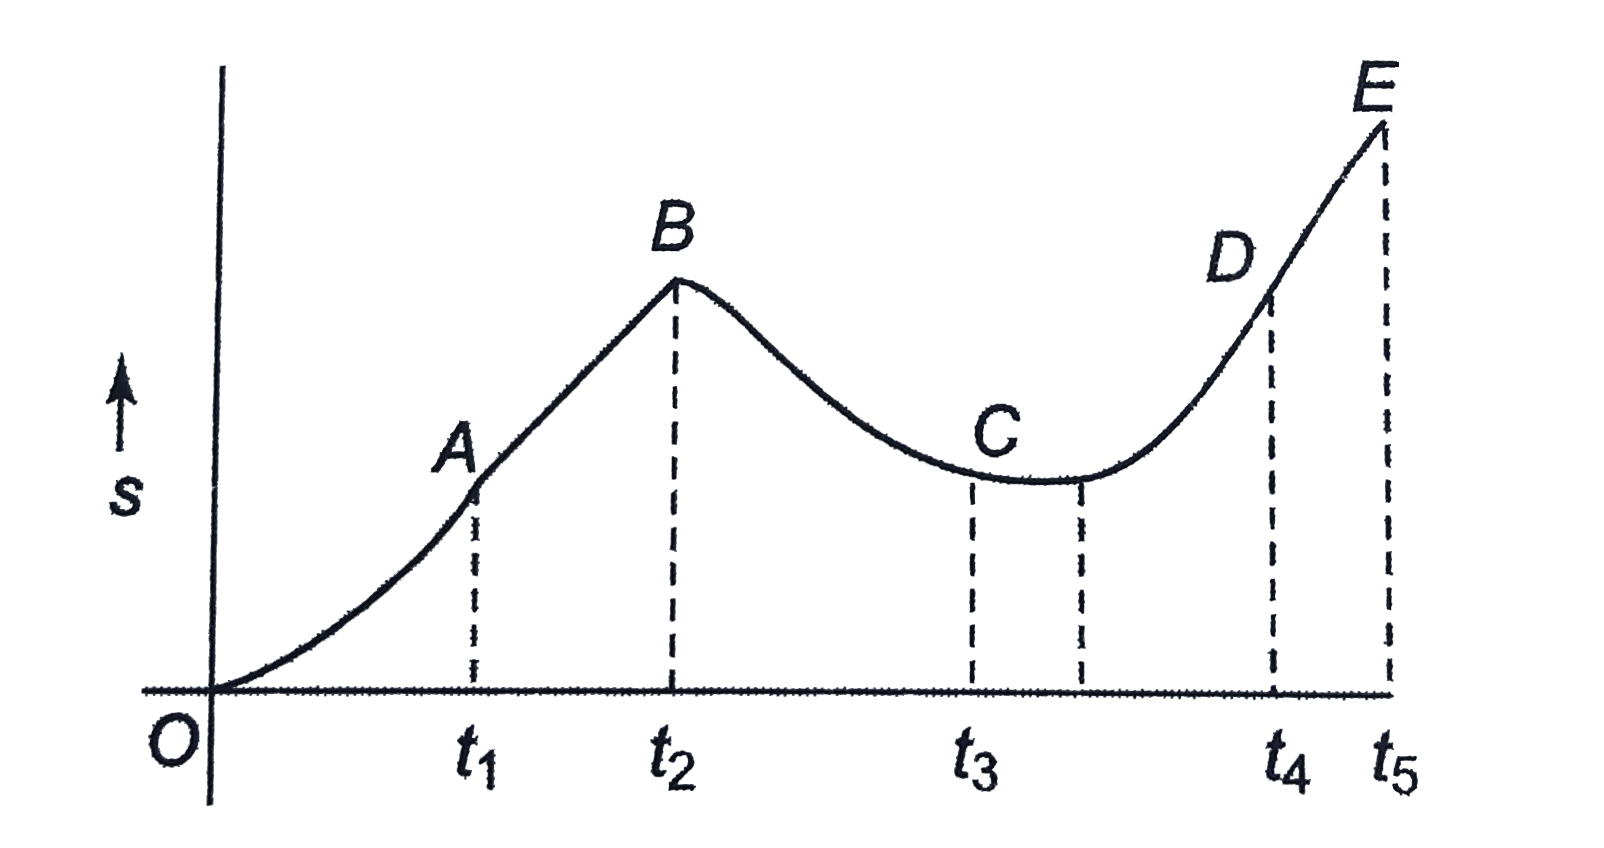
Draw the position-time graph of an object moving with positive accceleration.
To draw the position-time graph of an object moving with positive acceleration, we can follow these steps:
1. Understand the Concepts:
- Position (x): The location of the object at a given time.
- Time (t): The duration over which the object is moving.
- Velocity (v): The rate of change of position with respect to time.
- Acceleration (a): The rate of change of velocity with respect to time. Positive acceleration means that the velocity of the object is increasing.
2. Set Up the Axes:
- Draw a horizontal line for the time axis (x-axis) and label it as "Time (t)".
- Draw a vertical line for the position axis (y-axis) and label it as "Position (x)".
3. Identify the Nature of the Graph:
- Since the object is moving with positive acceleration, its velocity is increasing over time. This means that the position of the object will not change at a constant rate but will change at an increasing rate.
4. Sketch the Graph:
- Start at the origin (0,0) where time is zero and the position is zero.
- As time progresses, draw a curve that starts to rise gently and then steepens. This indicates that the position is increasing at an increasing rate.
- The curve should be concave upwards, showing that the rate of change of position (which is velocity) is increasing.
5. Label the Graph:
- Ensure that the axes are labeled with appropriate units (e.g., meters for position and seconds for time).
- Optionally, you can mark a few points on the graph to indicate specific positions at certain times.
Final Graph:
The final graph should show a smooth curve that starts from the origin and rises upwards, becoming steeper as time increases.
---
- Position (x): The location of the object at a given time.
- Time (t): The duration over which the object is moving.
- Velocity (v): The rate of change of position with respect to time.
- Acceleration (a): The rate of change of velocity with respect to time. Positive acceleration means that the velocity of the object is increasing.
- Draw a horizontal line for the time axis (x-axis) and label it as "Time (t)".
- Draw a vertical line for the position axis (y-axis) and label it as "Position (x)".
- Since the object is moving with positive acceleration, its velocity is increasing over time. This means that the position of the object will not change at a constant rate but will change at an increasing rate.
- Start at the origin (0,0) where time is zero and the position is zero.
- As time progresses, draw a curve that starts to rise gently and then steepens. This indicates that the position is increasing at an increasing rate.
- The curve should be concave upwards, showing that the rate of change of position (which is velocity) is increasing.
- Ensure that the axes are labeled with appropriate units (e.g., meters for position and seconds for time).
- Optionally, you can mark a few points on the graph to indicate specific positions at certain times.
The final graph should show a smooth curve that starts from the origin and rises upwards, becoming steeper as time increases.
Topper's Solved these Questions
- MOTION IN STRAIGHT LINEBOOK - AAKASH INSTITUTE ENGLISHCHAPTER - MOTION IN STRAIGHT LINEEXERCISE - Try Yourself
40 Videos
- MOTION IN STRAIGHT LINEBOOK - AAKASH INSTITUTE ENGLISHCHAPTER - MOTION IN STRAIGHT LINEEXERCISE - Assignment (SECTION - A)
50 Videos
- MOTION IN A STRAIGHT LINEBOOK - AAKASH INSTITUTE ENGLISHCHAPTER - MOTION IN A STRAIGHT LINEEXERCISE - ASSIGNMENT (SECTION - D)
15 Videos
- MOVING CHARGE AND MAGNESIUMBOOK - AAKASH INSTITUTE ENGLISHCHAPTER - MOVING CHARGE AND MAGNESIUMEXERCISE - SECTION D
16 Videos
Similar Questions
Draw the position-time graph of a moving object, moving with zero acceleration.
View SolutionDraw the velocity-time graph of an object moving with uniform negative acceleration.
View SolutionDraw the position-time graph of a stationary object.
View SolutionPosition - time graph for motion with negative acceleration is
View SolutionFigure shows the position -time graph of an object in SHM. The correct equation representing this motion is

View SolutionDraw the x-t graph of an object in uniform motion.
View SolutionA particle is moving along the x-axis and its position-time graph is shown. Determine the sign of acceleration.

View SolutionWhich graph corresponds to an object moving with a constant negative acceleration and a positive velocity ?
View SolutionWhich graph corresponds to an object moving with a constant negative acceleration and a positive velocity ?
View SolutionThe position-time graph of an object is a straight line parallel to time axis. This implies that the object is
View Solution
