The graph between displacement and time for a particle moving with uniform acceleration is a
straight line with a positive slope
parabola
ellipse
straight line parallel to time axis
The correct Answer is:B
To determine the graph between displacement and time for a particle moving with uniform acceleration, we can follow these steps:
Step 1: Understand the motion
A particle moving with uniform acceleration means that its acceleration (a) is constant over time. This affects how its displacement (x) changes with time (t).
Step 2: Use the equation of motion
The equation of motion that relates displacement, initial velocity, time, and acceleration is given by:
x=ut+12at2
Where:
- x is the displacement,
- u is the initial velocity,
- a is the acceleration,
- t is the time.
Step 3: Analyze the case of starting from rest
If the particle starts from rest, the initial velocity u=0. Thus, the equation simplifies to:
x=12at2
Step 4: Identify the relationship
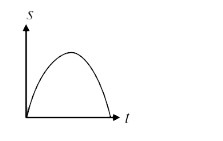
This equation shows that displacement x is proportional to the square of time t2 when acceleration a is constant. This indicates a parabolic relationship.
Step 5: Graph the relationship
- If acceleration a is positive, the graph of x versus t will be a parabola opening upwards.
- If acceleration a is negative, the graph will still be a parabola but opening downwards.
Step 6: Conclusion
The graph between displacement and time for a particle moving with uniform acceleration is a parabola.
A particle moving with uniform acceleration means that its acceleration (a) is constant over time. This affects how its displacement (x) changes with time (t).
The equation of motion that relates displacement, initial velocity, time, and acceleration is given by:
x=ut+12at2
Where:
- x is the displacement,
- u is the initial velocity,
- a is the acceleration,
- t is the time.
If the particle starts from rest, the initial velocity u=0. Thus, the equation simplifies to:
x=12at2
This equation shows that displacement x is proportional to the square of time t2 when acceleration a is constant. This indicates a parabolic relationship.
- If acceleration a is positive, the graph of x versus t will be a parabola opening upwards.
- If acceleration a is negative, the graph will still be a parabola but opening downwards.
The graph between displacement and time for a particle moving with uniform acceleration is a parabola.
Topper's Solved these Questions
- MOTION IN A PLANEBook:DC PANDEY ENGLISHChapter:MOTION IN A PLANEExercise:Check point 3.7
Explore 15 Videos
- MOTION IN A PLANEBook:DC PANDEY ENGLISHChapter:MOTION IN A PLANEExercise:(A) Taking it together
Explore 75 Videos
- MOTION IN A PLANEBook:DC PANDEY ENGLISHChapter:MOTION IN A PLANEExercise:Check point 3.5
Explore 25 Videos
- MOTIONBook:DC PANDEY ENGLISHChapter:MOTIONExercise:Medical entrances gallery
Explore 19 Videos
- PROJECTILE MOTIONBook:DC PANDEY ENGLISHChapter:PROJECTILE MOTIONExercise:Level - 2 Subjective
Explore 10 Videos
Similar Questions
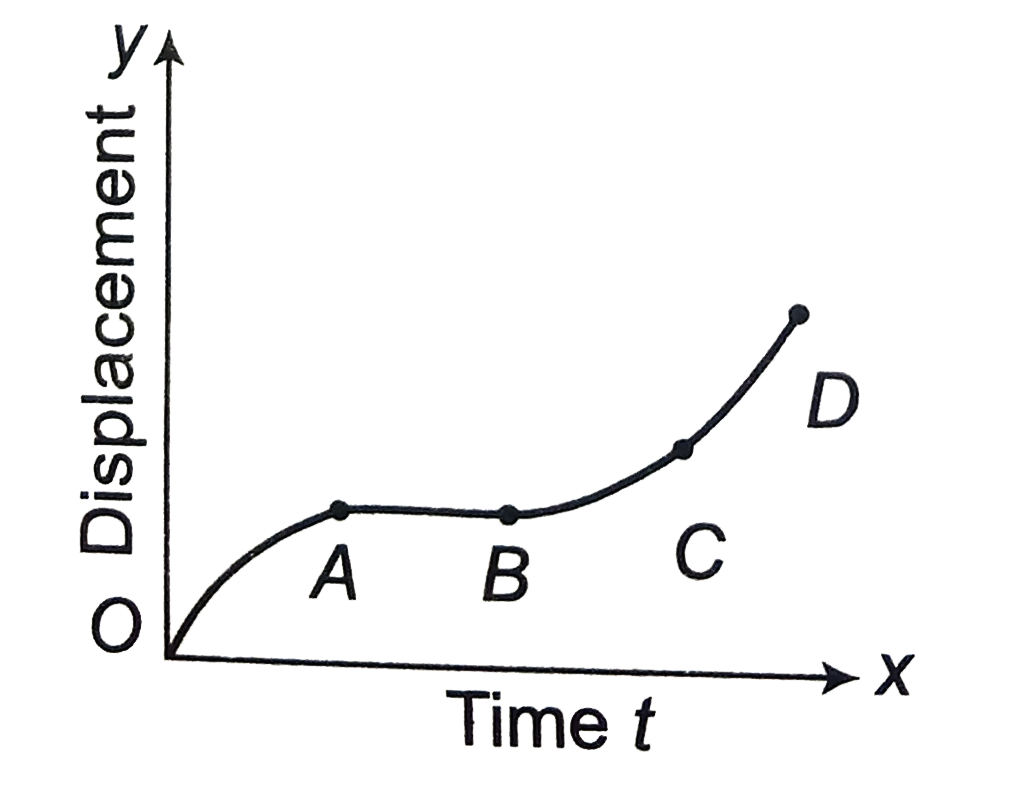
The graph between the displacement x and time t for a particle moving in a straight line is shown in the figure. During the interval OA,AB,BC and CD the acceleration of the particle is
OA,AB,BC,CD

View SolutionThe graph of displacement vs time for a particle moving along a straight line is as shown. The best option for the corresponding velocity - time graph will be:

View SolutionWhich of the following best represents the graph of velocity (v) versus displacement (s) for a particle travelling with an acceleration (uniform) and some non zero initial velocity?
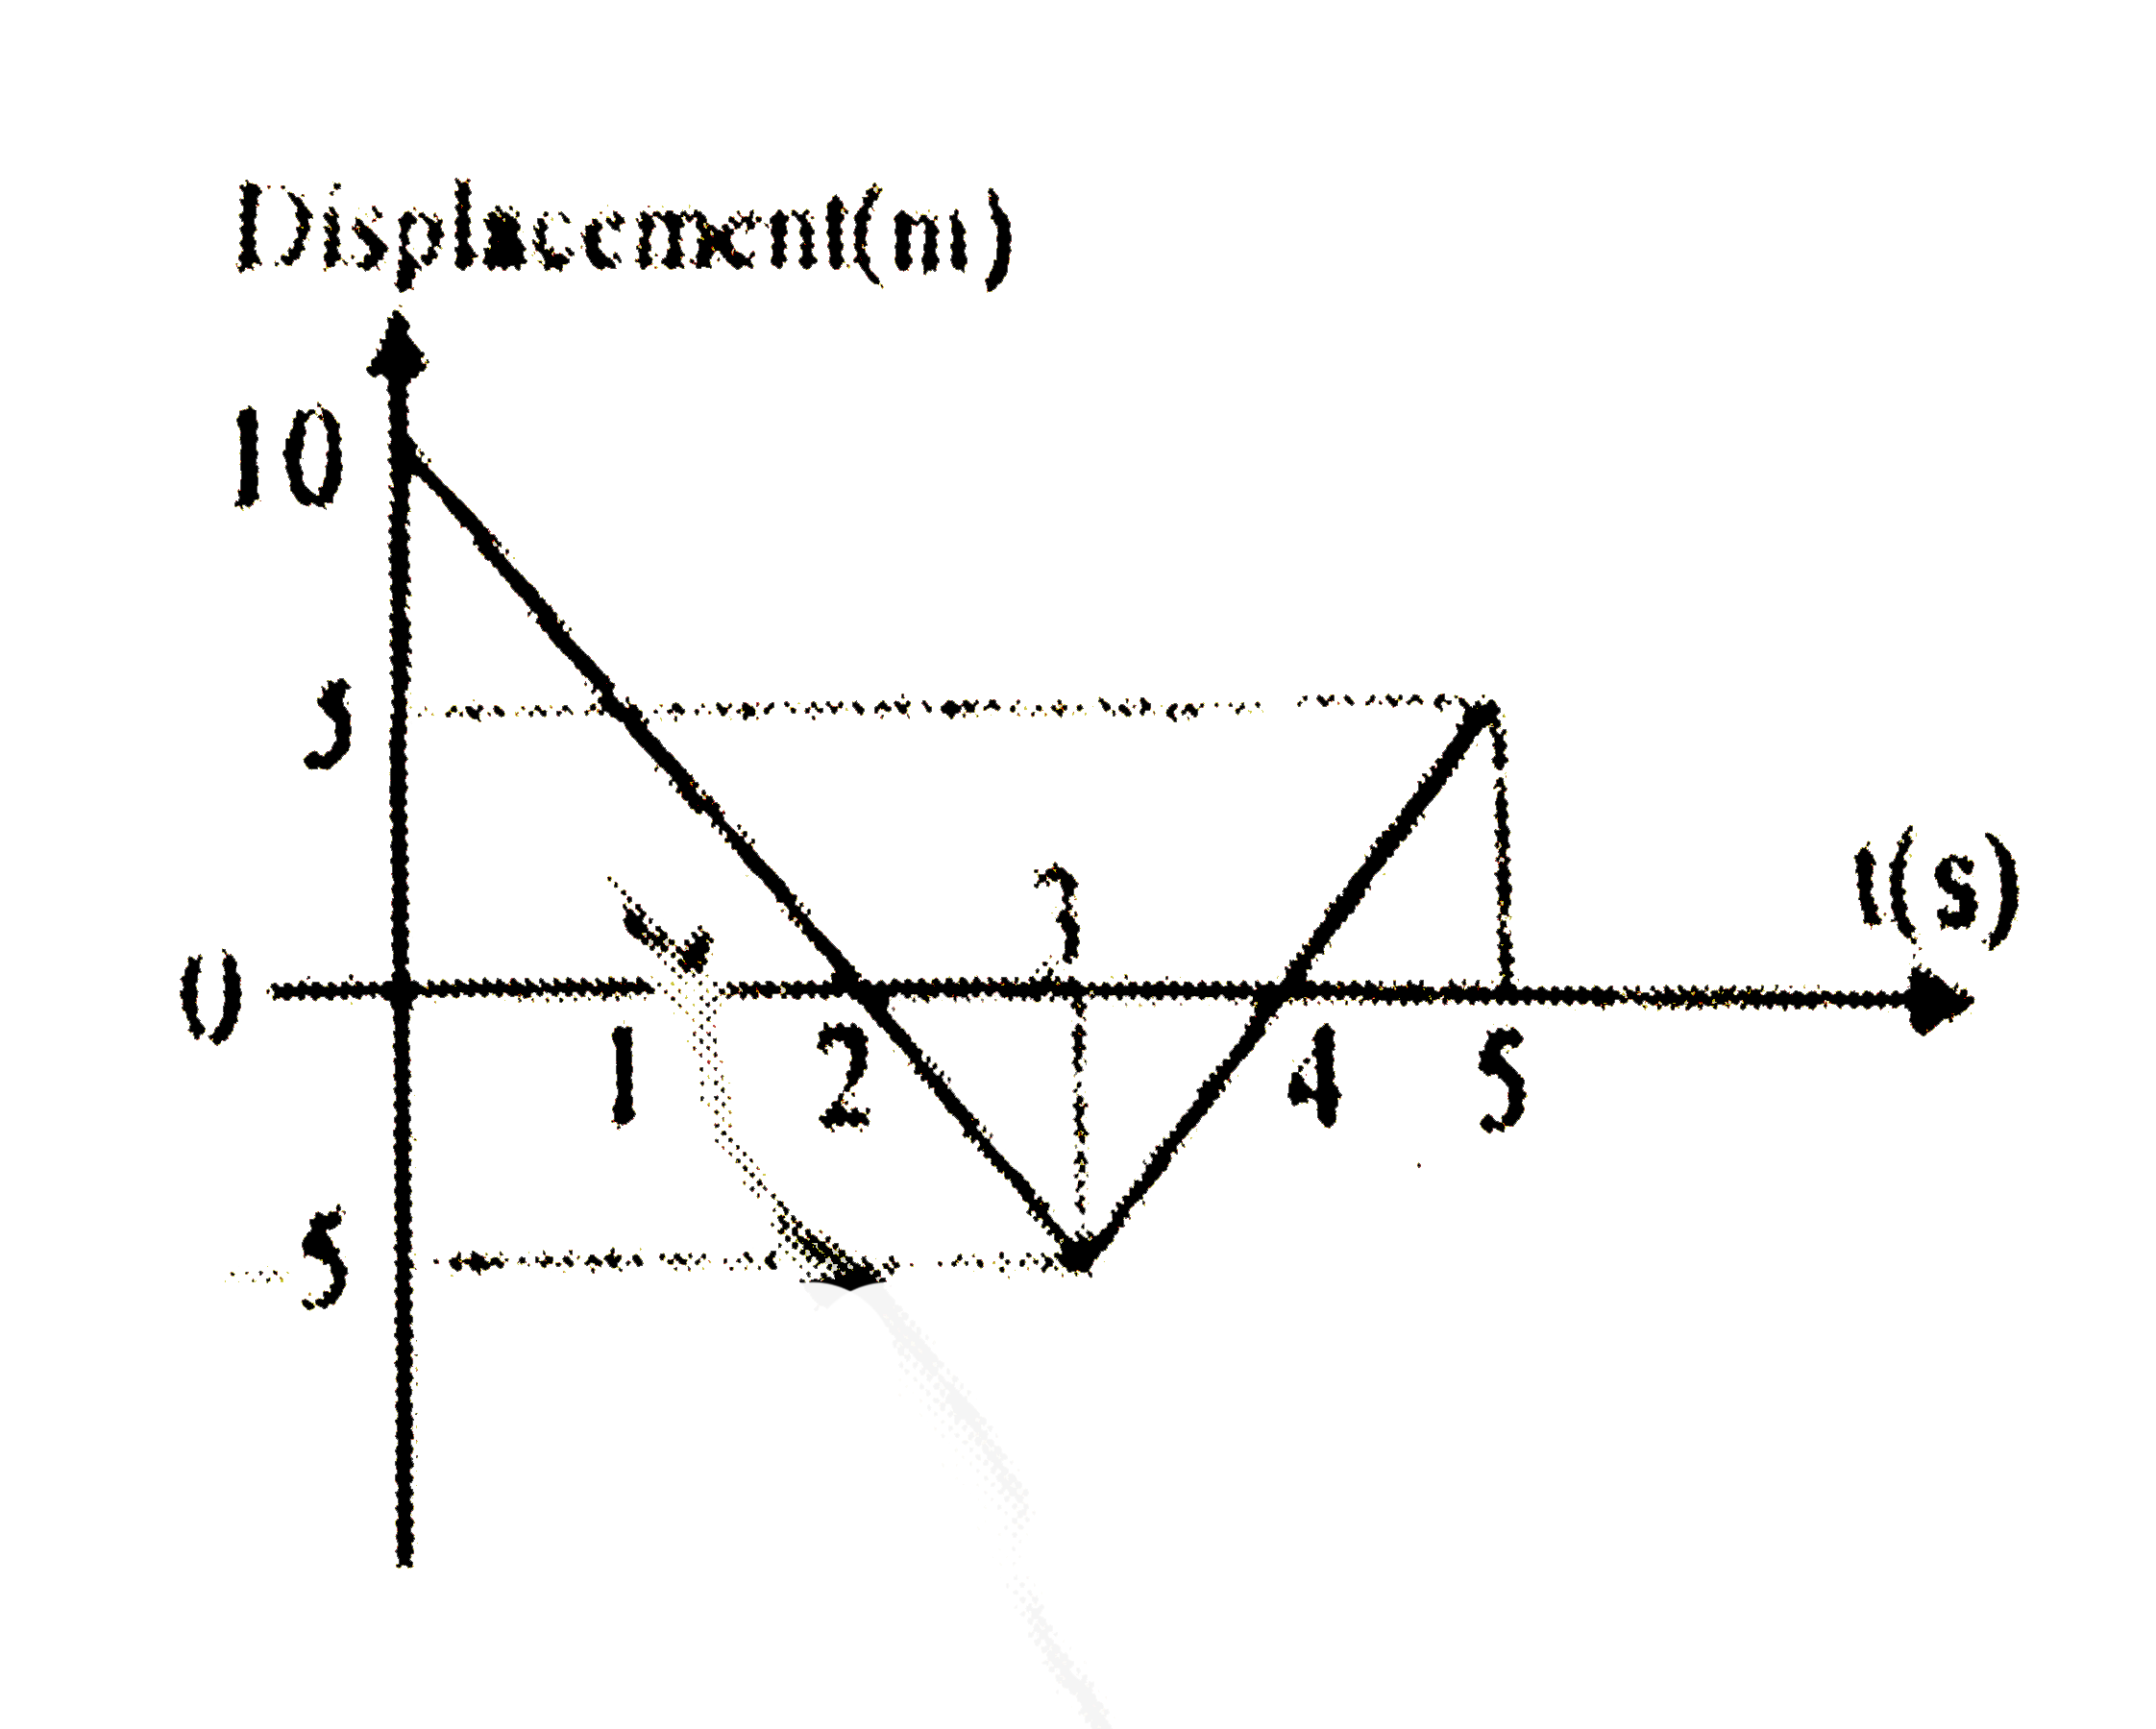
View SolutionThe diagram shows the displacement - time graph for a particle moving in a straight line. The distance (in m) coverted by the particle in the time interval t=0 to t=5s is

View SolutionDraw the graph between displacement and
kinetic energy for a particle executing SHM.
View SolutionDraw the graph between displacement and
total energy for a particle executing SHM.
View Solution(A):The displacement of a particle starting from rest is directly proportional to the cube of the time of travel then the particle is moving with non uniform acceleration.
(R ):Acceleration →a=d2→sdt2
View SolutionDraw the graph between displacement and
potential energy for a particle executing SHM.
View SolutionFigure shows the displacement time graph of a particle moving on the X-axis

View SolutionDisplacement time graph of a particle moving in a straight line is a shown in figure.

View Solution