Position-time graph for motion with zero acceleration is

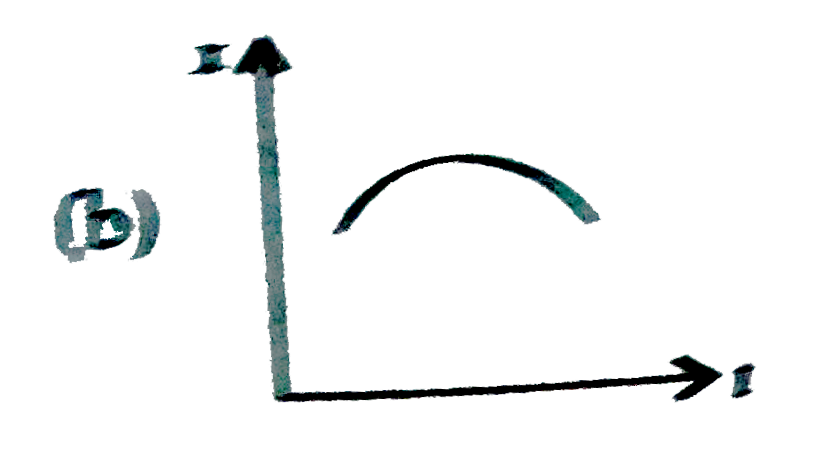
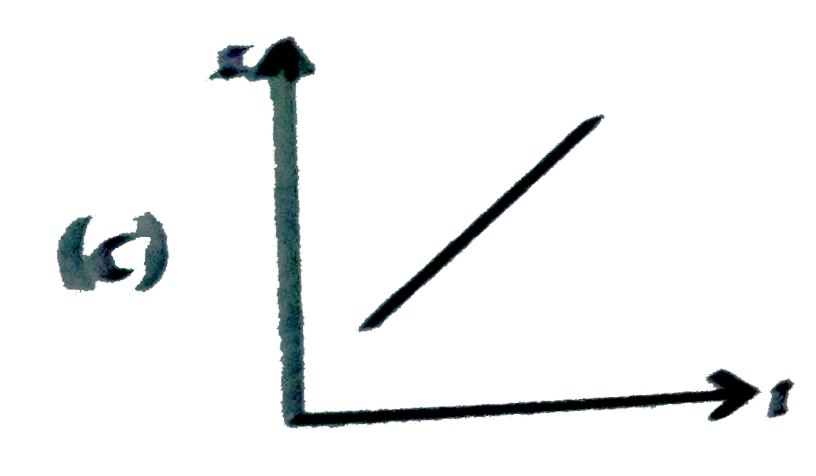
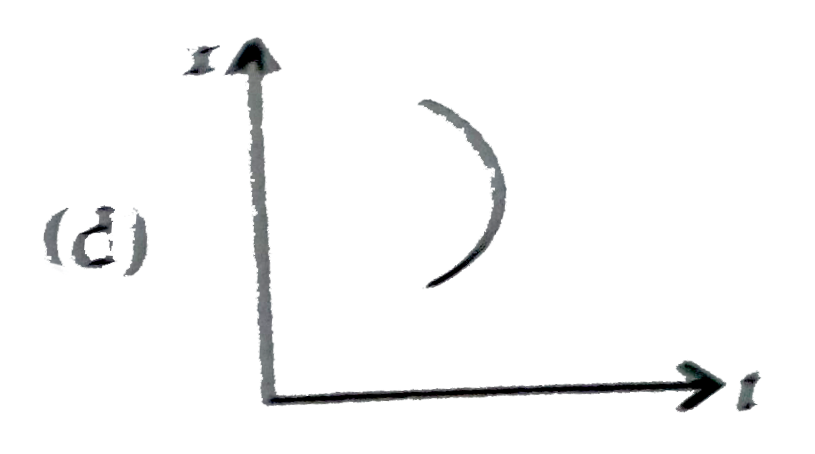
The correct Answer is:C
To determine the position-time graph for motion with zero acceleration, we can follow these steps:
1. Understand the Concept of Zero Acceleration:
- When acceleration is zero, it implies that the velocity of the object is constant. This means that the object is moving at a steady speed without speeding up or slowing down.
2. Define Constant Velocity:
- Let’s denote the constant velocity as v=k, where k is a constant value.
3. Relate Velocity to Position and Time:
- The relationship between velocity, position, and time can be expressed as:
v=dxdt
- Since v is constant, we can substitute k into the equation:
dxdt=k
4. Integrate to Find Position:
- To find the position x as a function of time t, we can rearrange and integrate:
dx=kdt
- Integrating both sides gives:
∫dx=∫kdt
- This results in:
x=kt+C
- Here, C is the constant of integration, which represents the initial position of the object at t=0.
5. Interpret the Equation:
- The equation x=kt+C describes a straight line when plotted on a position-time graph. The slope of the line is equal to the constant velocity k, and the y-intercept is the initial position C.
6. Draw the Position-Time Graph:
- Since the equation represents a linear relationship, the position-time graph will be a straight line. If k>0, the line will slope upwards, indicating motion in the positive direction. If k<0, the line will slope downwards, indicating motion in the negative direction.
Conclusion:
- The position-time graph for motion with zero acceleration is a straight line, which can be represented by the equation x=kt+C.
- When acceleration is zero, it implies that the velocity of the object is constant. This means that the object is moving at a steady speed without speeding up or slowing down.
- Let’s denote the constant velocity as v=k, where k is a constant value.
- The relationship between velocity, position, and time can be expressed as:
v=dxdt
- Since v is constant, we can substitute k into the equation:
dxdt=k
- To find the position x as a function of time t, we can rearrange and integrate:
dx=kdt
- Integrating both sides gives:
∫dx=∫kdt
- This results in:
x=kt+C
- Here, C is the constant of integration, which represents the initial position of the object at t=0.
- The equation x=kt+C describes a straight line when plotted on a position-time graph. The slope of the line is equal to the constant velocity k, and the y-intercept is the initial position C.
- Since the equation represents a linear relationship, the position-time graph will be a straight line. If k>0, the line will slope upwards, indicating motion in the positive direction. If k<0, the line will slope downwards, indicating motion in the negative direction.
- The position-time graph for motion with zero acceleration is a straight line, which can be represented by the equation x=kt+C.
Topper's Solved these Questions
- MOTION IN A STRAIGHT LINEBOOK - NCERT FINGERTPS ENGLISHCHAPTER - MOTION IN A STRAIGHT LINEEXERCISE - KINEMATIC EQUATIONS FOR UNIFORMLY ACCELERATED MOTION
32 Videos
- MOTION IN A STRAIGHT LINEBOOK - NCERT FINGERTPS ENGLISHCHAPTER - MOTION IN A STRAIGHT LINEEXERCISE - RELATIVE VELOCITY
18 Videos
- MOTION IN A STRAIGHT LINEBOOK - NCERT FINGERTPS ENGLISHCHAPTER - MOTION IN A STRAIGHT LINEEXERCISE - INSTANTANEOUS VELOCITY AND SPEED
16 Videos
- MOTION IN A PLANE BOOK - NCERT FINGERTPS ENGLISHCHAPTER - MOTION IN A PLANE EXERCISE - Assertion And Reason
15 Videos
- OSCILLATIONS BOOK - NCERT FINGERTPS ENGLISHCHAPTER - OSCILLATIONS EXERCISE - Assertion And Reason
15 Videos
Similar Questions
Position - time graph for motion with negative acceleration is
View SolutionSTATEMENT - 1 : The slope on a position-time graph is representative of the acceleration of the object.
STATEMENT - 2 : A straight, diagonal line on a position-time graph is representative of an onject with a constant velocity.
STATEMENT - 3 : I an object is at rest, then the position-time graph must be a horizontal line located on the time-axis.
View SolutionAn object thrown vertically. Thevelocity-time graph for the motion of the particle is .
View SolutionDraw the position-time graph of a moving object, moving with zero acceleration.
View SolutionGraphs are very useful to represent a physical situation. Various quantities can be easily represented on graphs and other quantites can be determined from the graph. For example the slope of velocity-time graph represents instantaneous acceleration. For a motion with constant acceleration slope of velocity-time graph is constant. If acceleration is changing with time, slope with change and thus velocity-time graph will be a non-linear curve. Further the area of velocity-time graph gives displacement.
For the above situation let t1 be the time of accelerated motion and t2 be the time or retarded motion, then the correct relation is
View SolutionGraphs are very useful to represent a physical situation. Various quantities can be easily represented on graphs and other quantites can be determined from the graph. For example the slope of velocity-time graph represents instantaneous acceleration. For a motion with constant acceleration slope of velocity-time graph is constant. If acceleration is changing with time, slope will change and thus velocity-time graph will be a non-linear curve. Further the area of velocity-time graph gives displacement.
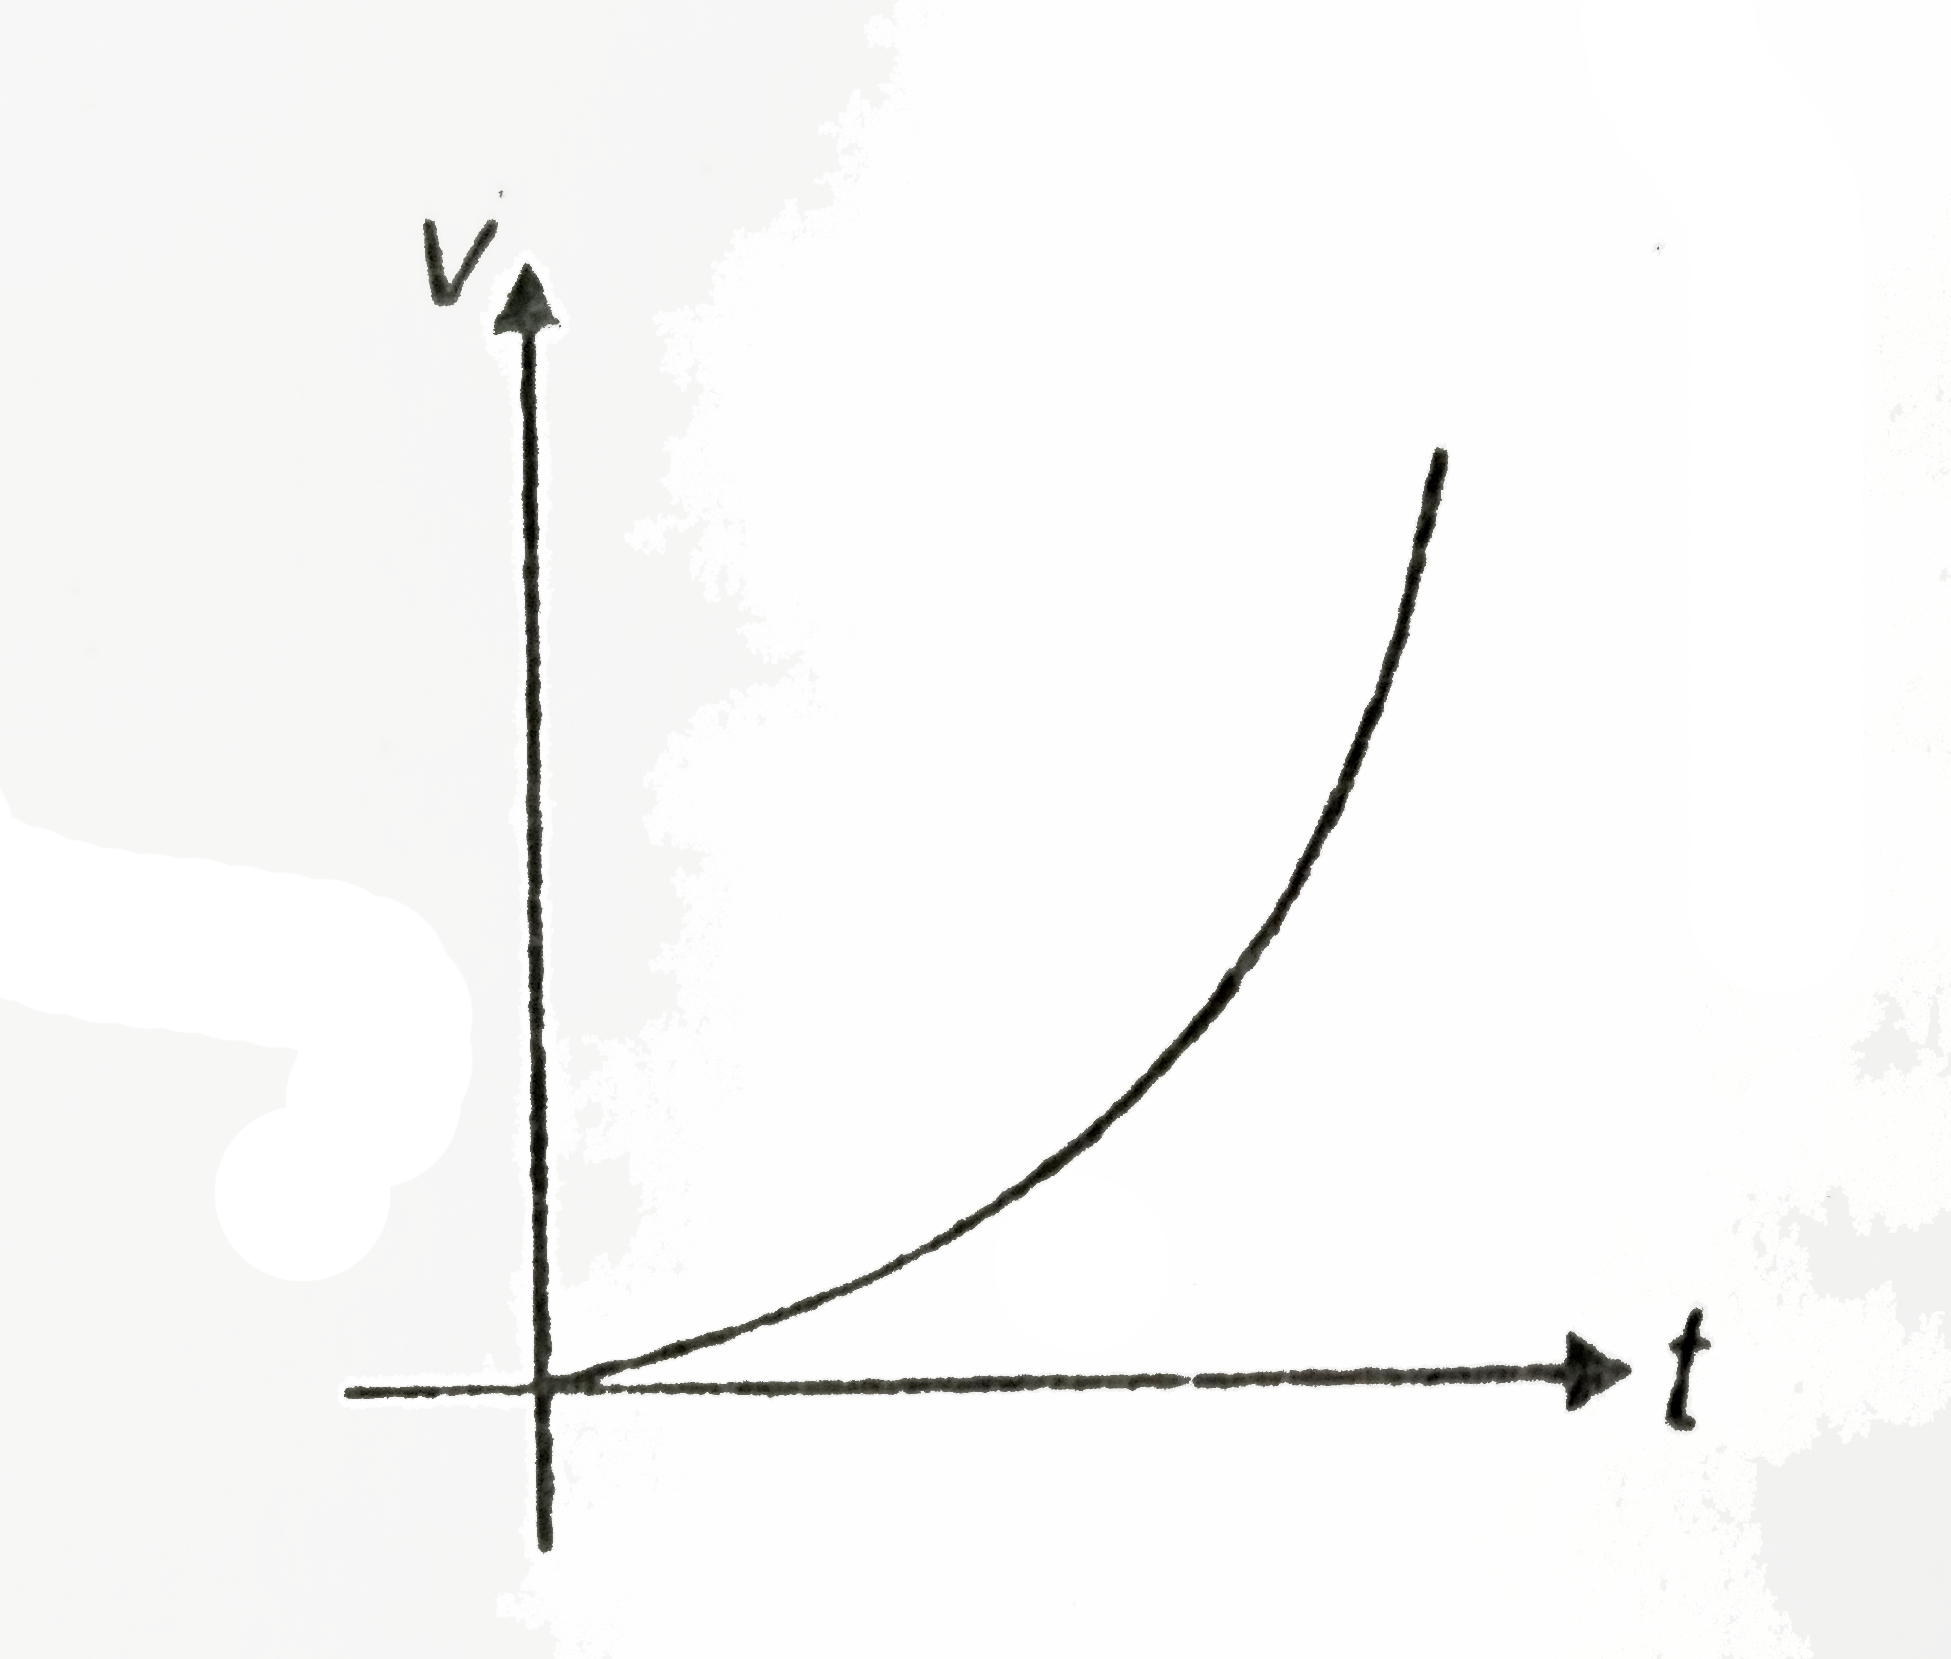
For the given velocity-time graph the possibly correct acceleration-time relationship is
View SolutionGraphs are very useful to represent a physical situation. Various quantities can be easily represented on graphs and other quantites can be determined from the graph. For example the slope of velocity-time graph represents instantaneous acceleration. For a motion with constant acceleration slope of velocity-time graph is constant. If acceleration is changing with time, slope with change and thus velocity-time graph will be a non-linear curve. Further the area of velocity-time graph gives displacement.
The velocity-time graph for two objects P and Q are shown. The ratio of their respective acceleration is
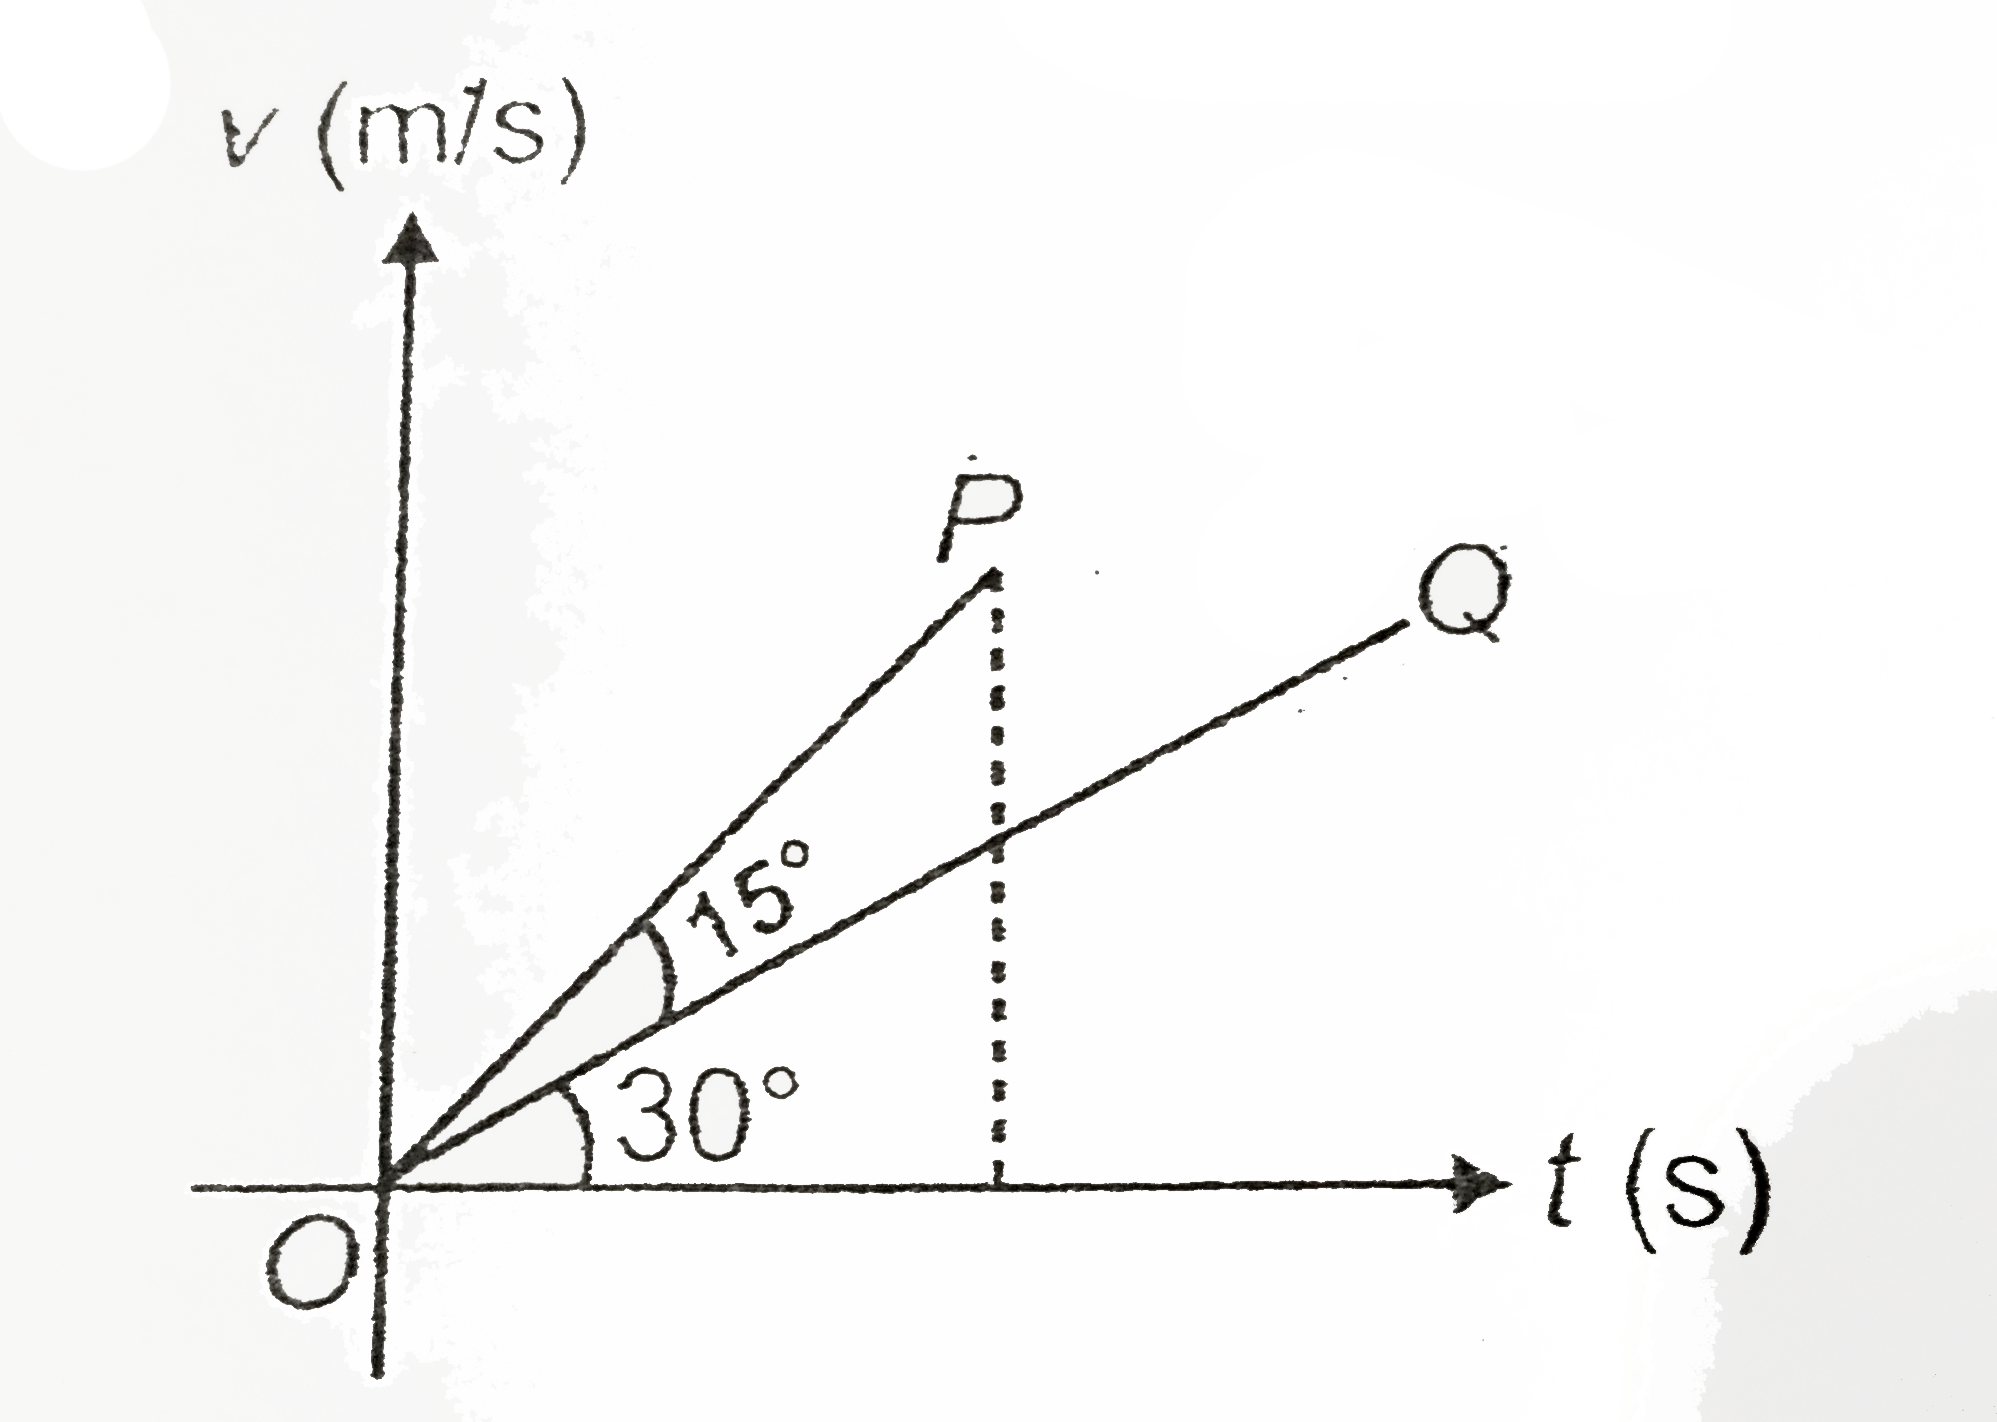
View SolutionGraphs are very useful to represent a physical situation. Various quantities can be easily represented on graphs and other quantites can be determined from the graph. For example the slope of velocity-time graph represents instantaneous acceleration. For a motion with constant acceleration slope of velocity-time graph is constant. If acceleration is changing with time, slope with change and thus velocity-time graph will be a non-linear curve. Further the area of velocity-time graph gives displacement.
The average velocity of the car for the entire trip is
View SolutionGraphs are very useful to represent a physical situation. Various quantities can be easily represented on graphs and other quantites can be determined from the graph. For example the slope of velocity-time graph represents instantaneous acceleration. For a motion with constant acceleration slope of velocity-time graph is constant. If acceleration is changing with time, slope will change and thus velocity-time graph will be a non-linear curve. Further the area of velocity-time graph gives displacement.
The correct relation between v0,a1,a2andt0 is
View SolutionGraphs are very useful to represent a physical situation. Various quantities can be easily represented on graphs and other quantites can be determined from the graph. For example the slope of velocity-time graph represents instantaneous acceleration. For a motion with constant acceleration slope of velocity-time graph is constant. If acceleration is changing with time, slope will change and thus velocity-time graph will be a non-linear curve. Further the area of velocity-time graph gives displacement.
For the given velocity-time graph the displacement of the object between t = 2 s to t = 4 s is
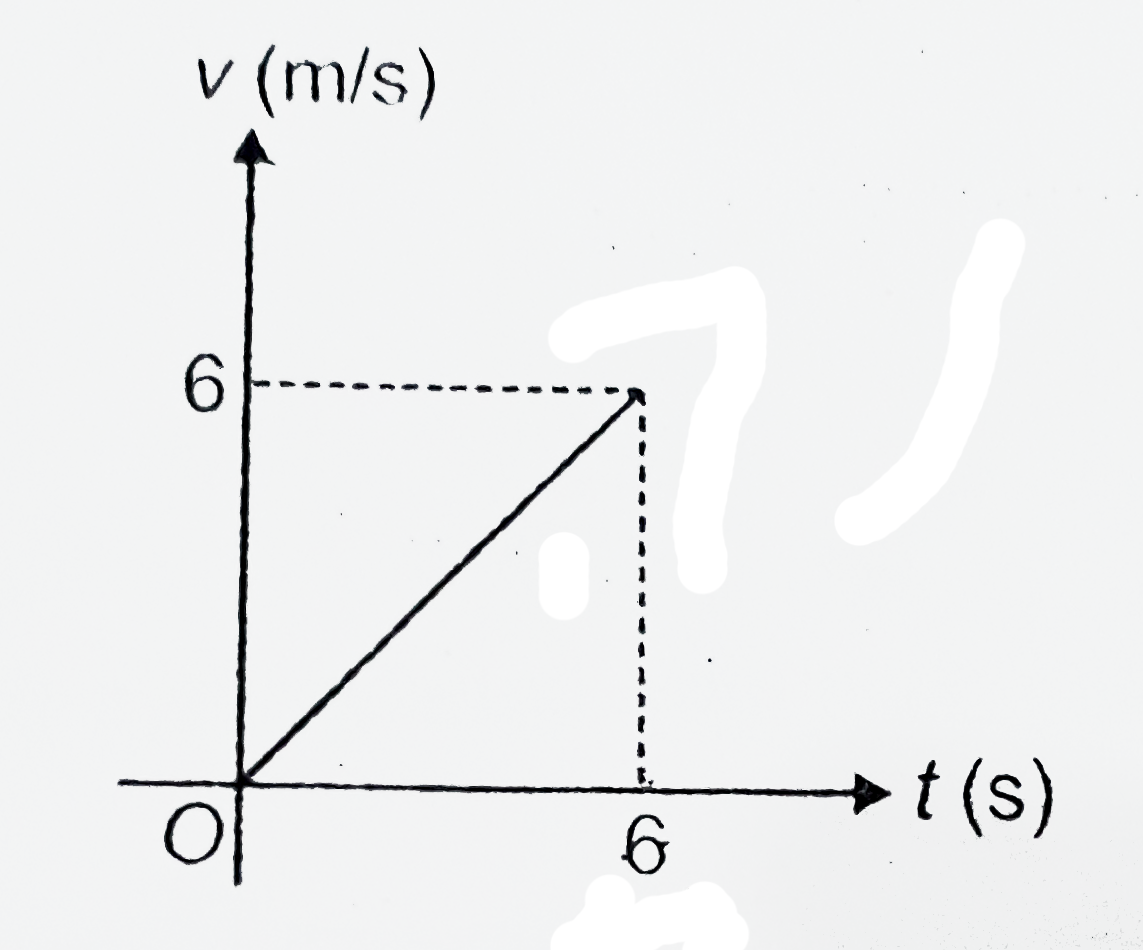
View Solution
