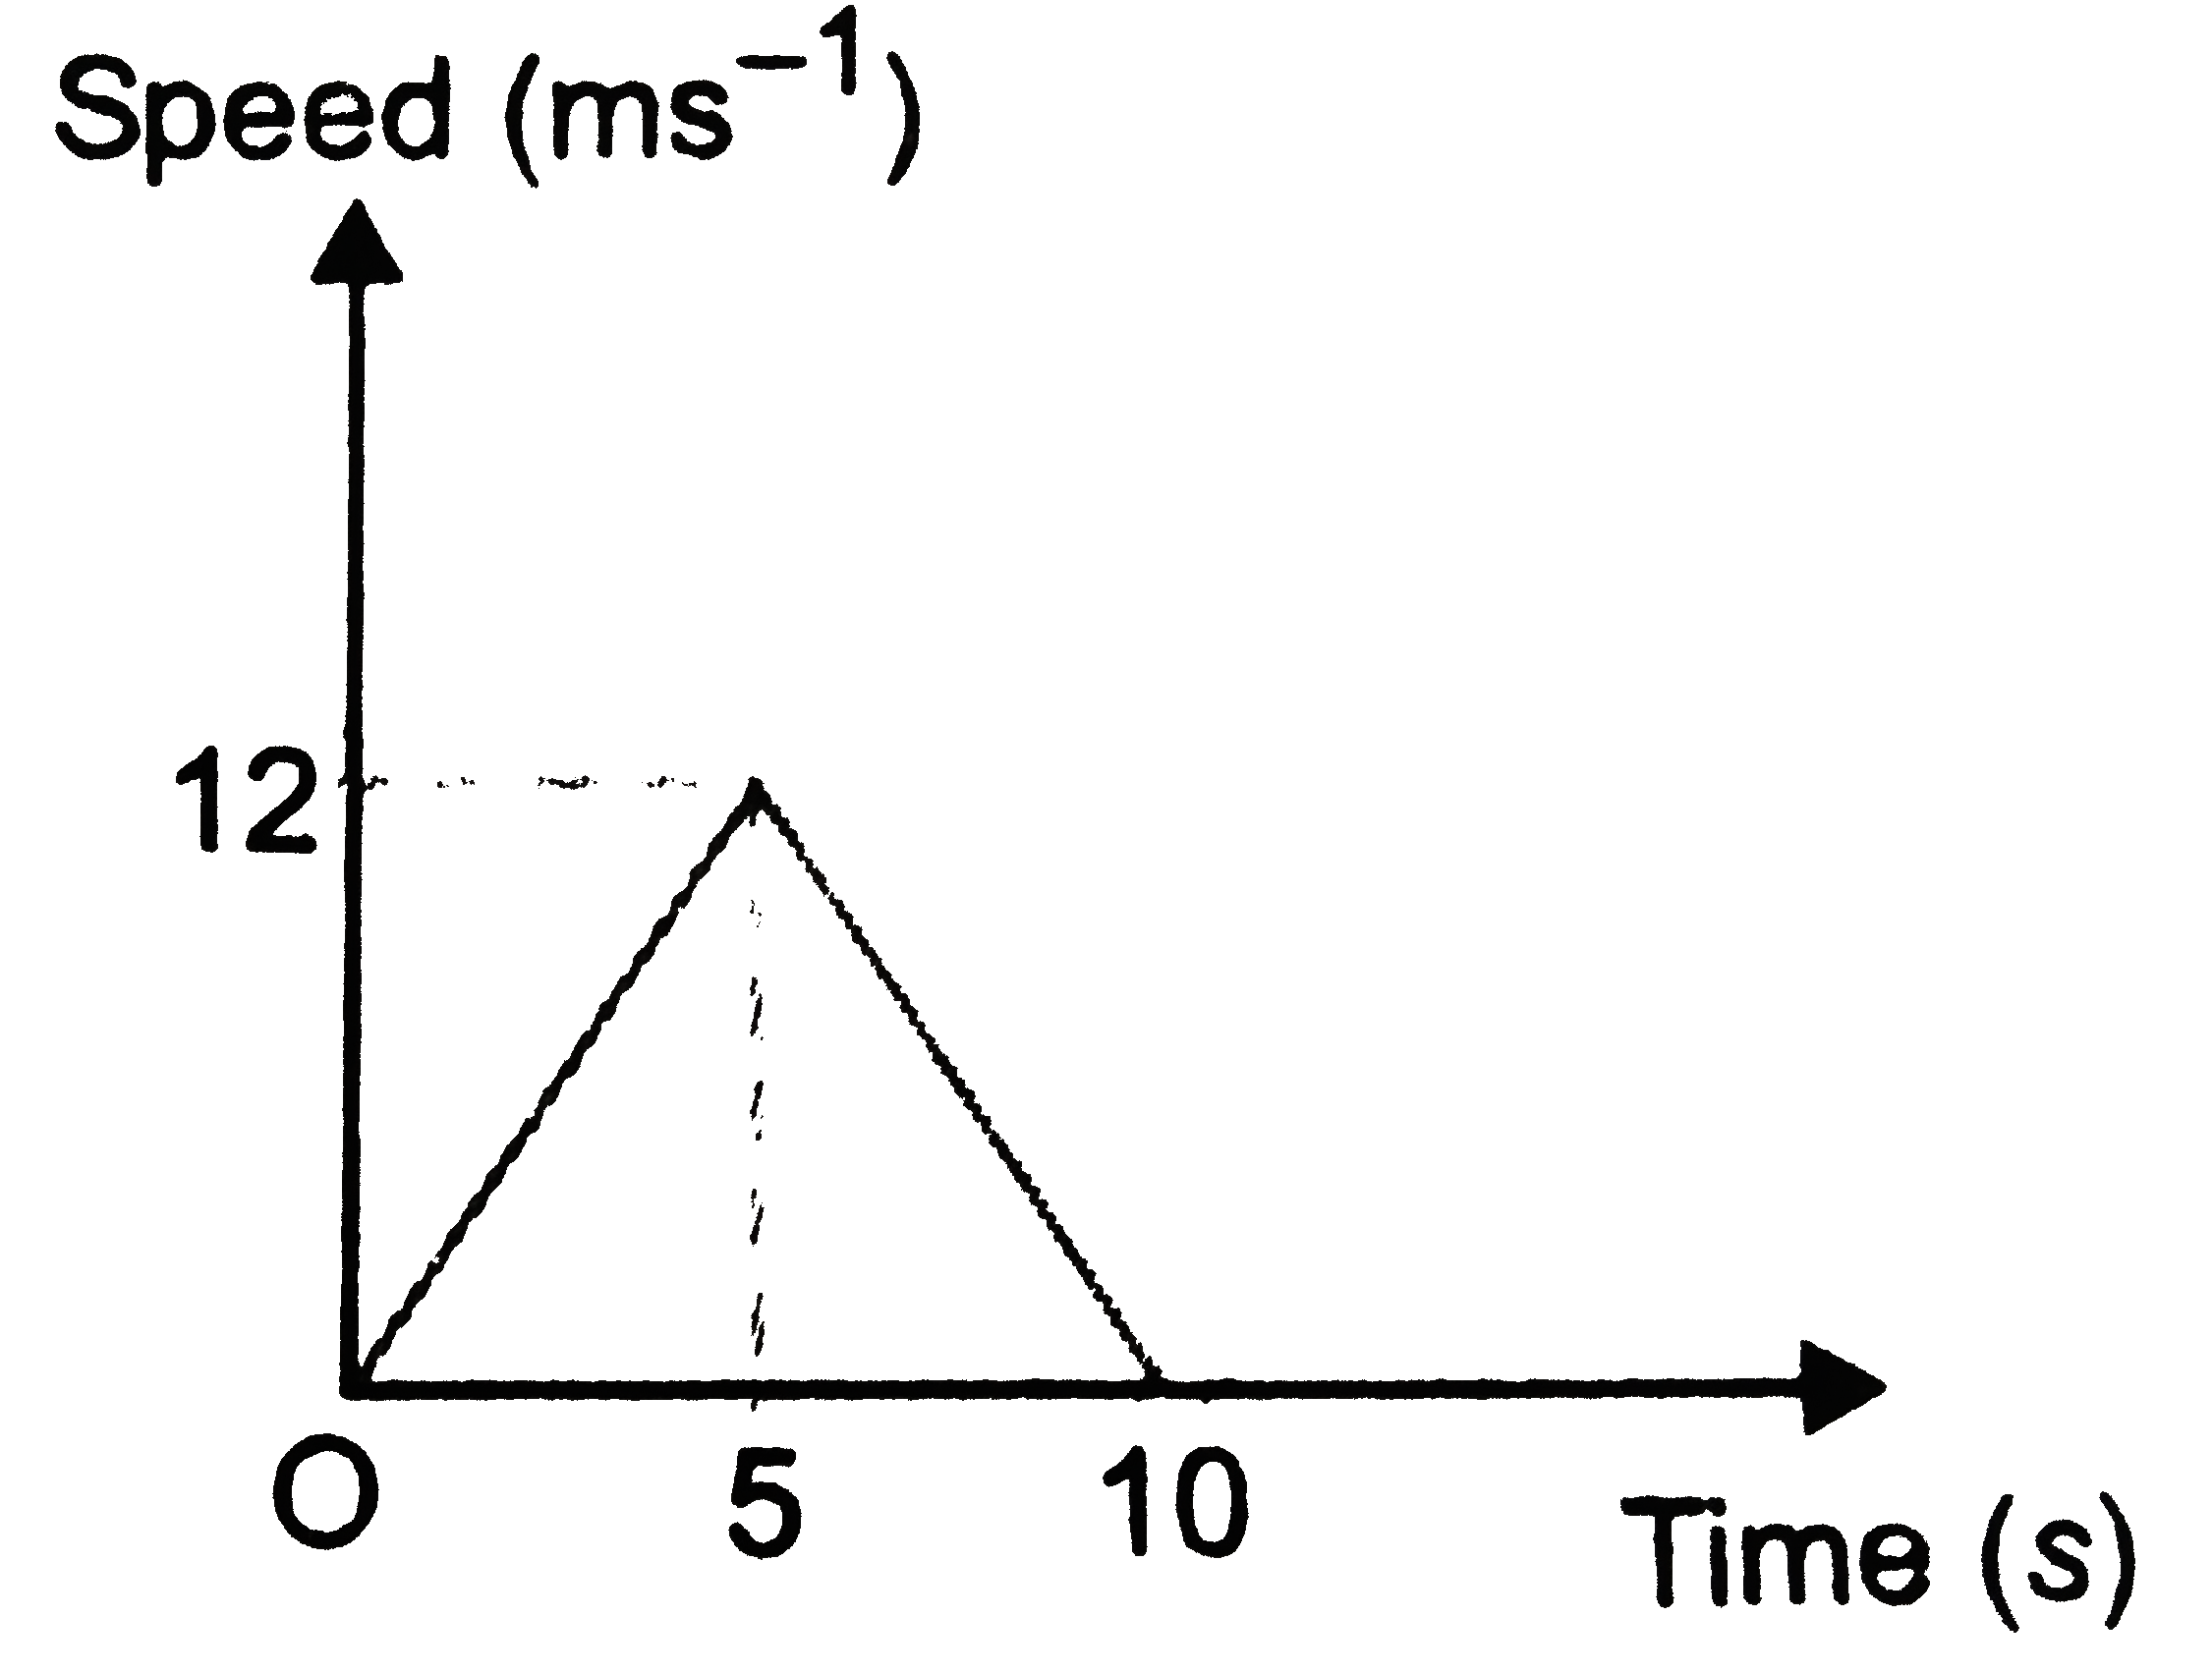
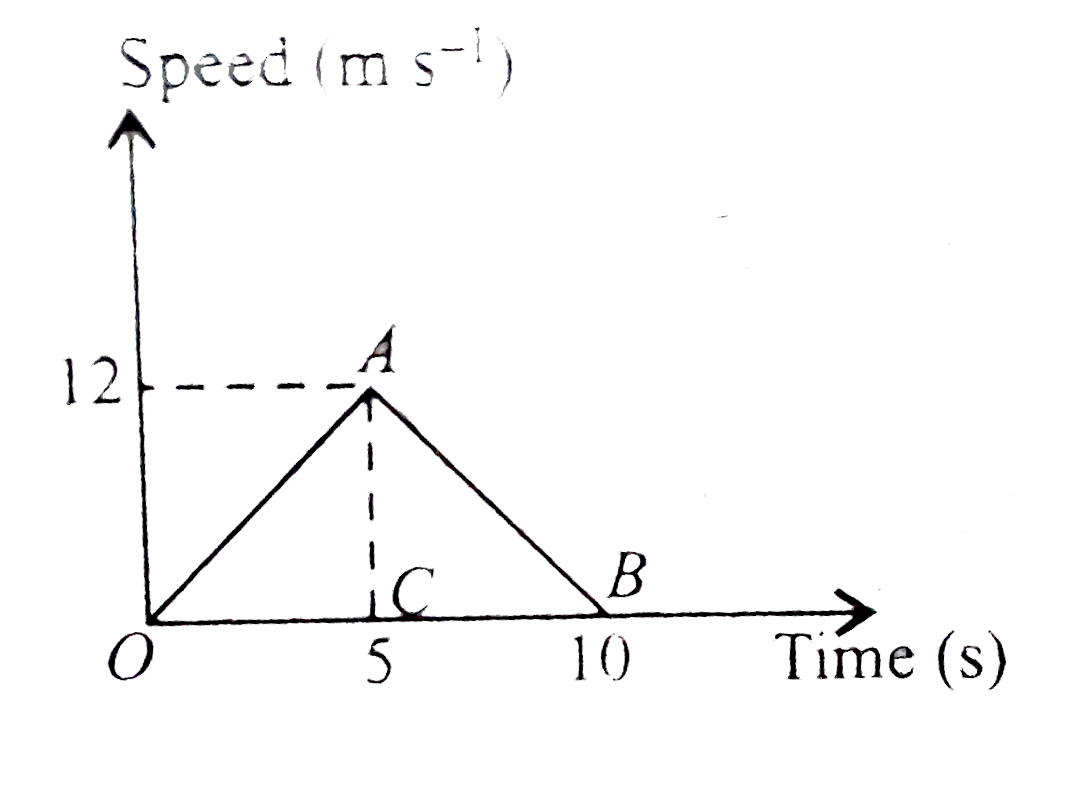
The speed-time graph of a particle moving along a fixed direction is shown in the Fig. 2 (CF) . 15. The distance traversed by the particle between t=2s and 6s is .
 .
.
1. 26 m
2. 36 m
3. 46 m
4. 56 m
The correct Answer is:B
Let S1 be the distance travelled by particle in time 2 to 5 s and S2 be the distance travelled by particle in time 5 to 6 s.
Time distance travelled,
S=S1+S2.
During the time interval 9 to 5 s, the acceleration of particle is equal to the slope of line OA
i.e. a=125=2.4ms−2
Velocity at the end of 2 s will be,
v=0+2.4×2=4.8ms−1
Taking motion of particle for time interval 2 s to 5 s,
Here, u=4.8ms−1,a=2.4ms−2,S=S1,t=5−2=3s
Then, S1=4.8×3+12×2.4×32 = 25.2 m
Acceleration of the particle during the motion t = 5 s to t = 10 s is
a = Slope of line AB=−125=−2.4ms−2
Taking motion of the particle for the time 1 s (i.e 5 s to 6 s), Here, u = 12ms−2,t=1s,S=S2
∴ S2=12×1+12(−2.4)×12 = 10.8 m
∴ S = S1+S2=25.2+10.8=36m
Topper's Solved these Questions
- MOTION IN A STRAIGHT LINEBOOK - NCERT FINGERTPS ENGLISHCHAPTER - MOTION IN A STRAIGHT LINEEXERCISE - KINEMATIC EQUATIONS FOR UNIFORMLY ACCELERATED MOTION
32 Videos
- MOTION IN A STRAIGHT LINEBOOK - NCERT FINGERTPS ENGLISHCHAPTER - MOTION IN A STRAIGHT LINEEXERCISE - RELATIVE VELOCITY
18 Videos
- MOTION IN A STRAIGHT LINEBOOK - NCERT FINGERTPS ENGLISHCHAPTER - MOTION IN A STRAIGHT LINEEXERCISE - INSTANTANEOUS VELOCITY AND SPEED
16 Videos
- MOTION IN A PLANE BOOK - NCERT FINGERTPS ENGLISHCHAPTER - MOTION IN A PLANE EXERCISE - Assertion And Reason
15 Videos
- OSCILLATIONS BOOK - NCERT FINGERTPS ENGLISHCHAPTER - OSCILLATIONS EXERCISE - Assertion And Reason
15 Videos
Similar Questions
The speed-time graph of a particle moving along a fixed direction is shown in the Fig. The distance traversed by the particle between (a) t=0s→10s .
 .
what is the average speed of the particle over the intervals?
View SolutionThe speed-time graph of a particle moving along a fixed direction is shown in Fig. Then which of the following is wrong?

View Solution
Knowledge Check
The speed-time graph of a particle moving along a fixed direction as shown in the figure. The distance traversed by the particle between t = 0 s to t = 10 s is
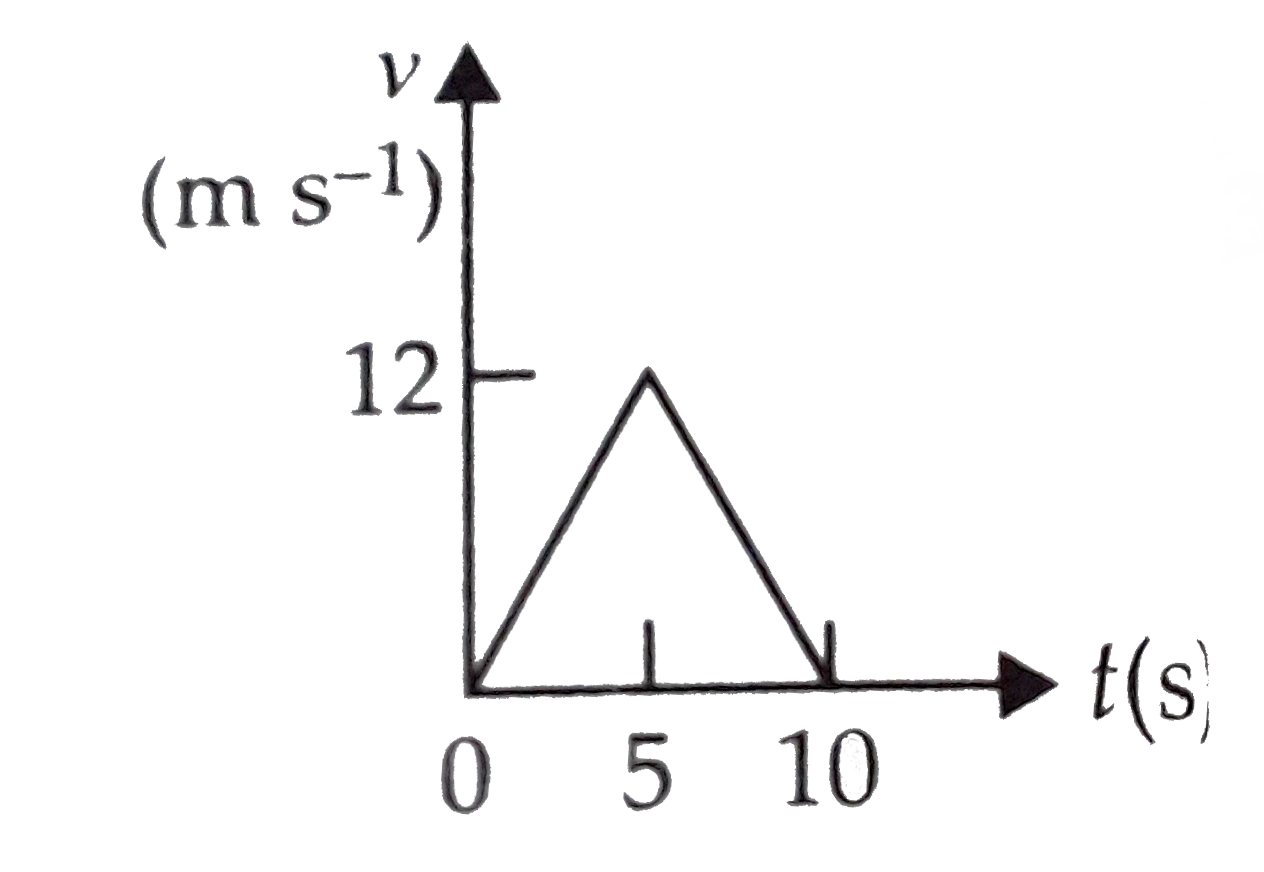 A20 mB40 mC60 mD80 m
The speed - time graph of a particle moving along a solid curve is shown below. The distance traversed by the particle from t = 0 to t = 3 is
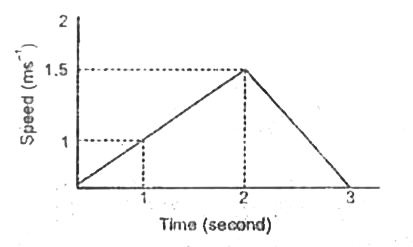
View SolutionThe variation of velocity of a particle moving along a straight line is shown in the figure. The distance travelled by the particle in 4s is

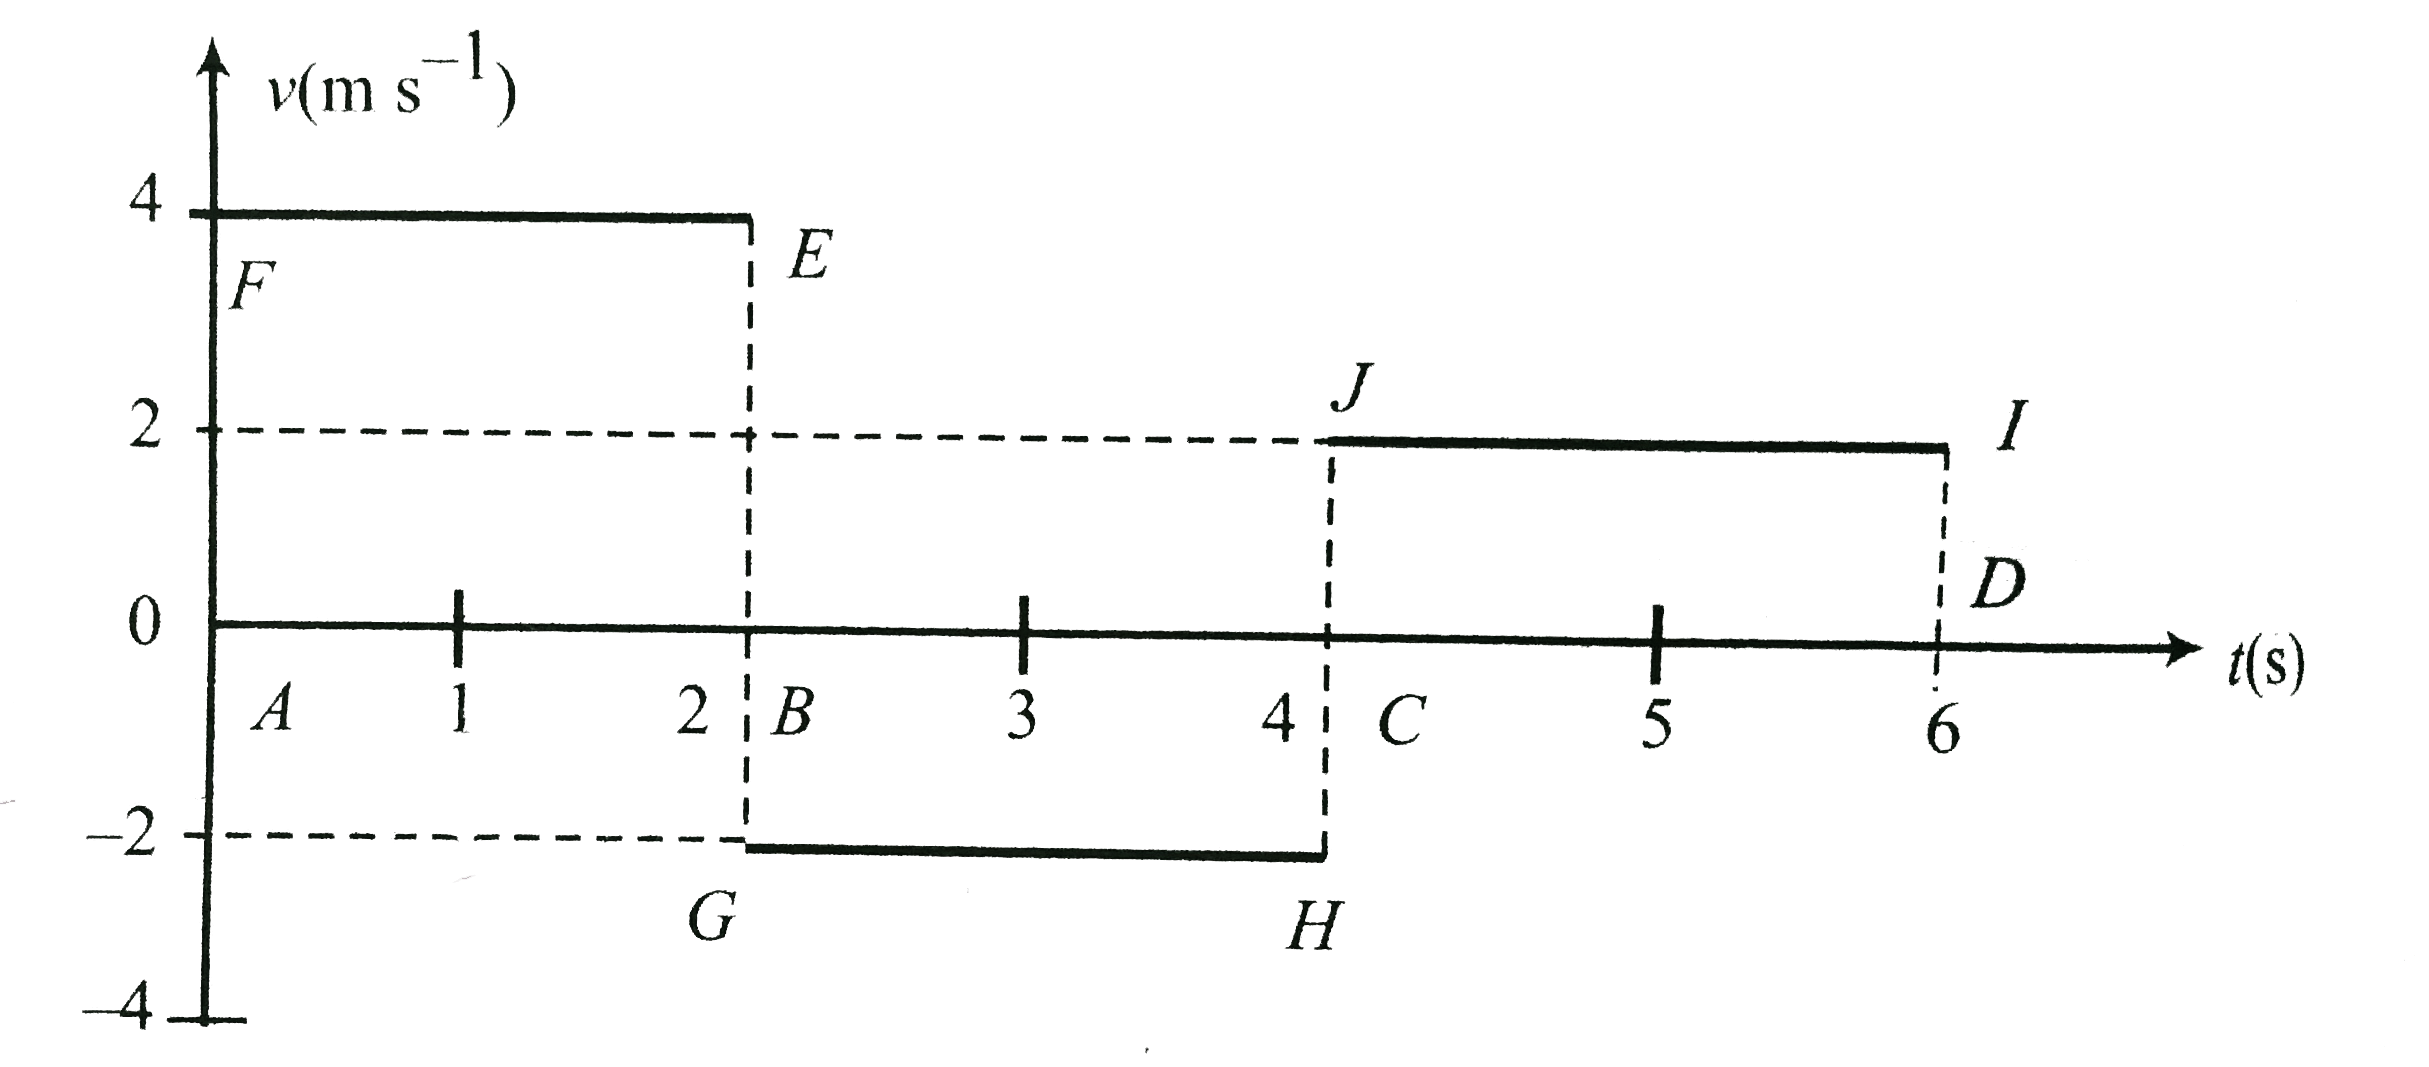
View SolutionThe velocity-time graph of a particle moving in a staight line is shown in the . Find the displacement and the distance trav elled by the particle in 6s.
 .
.
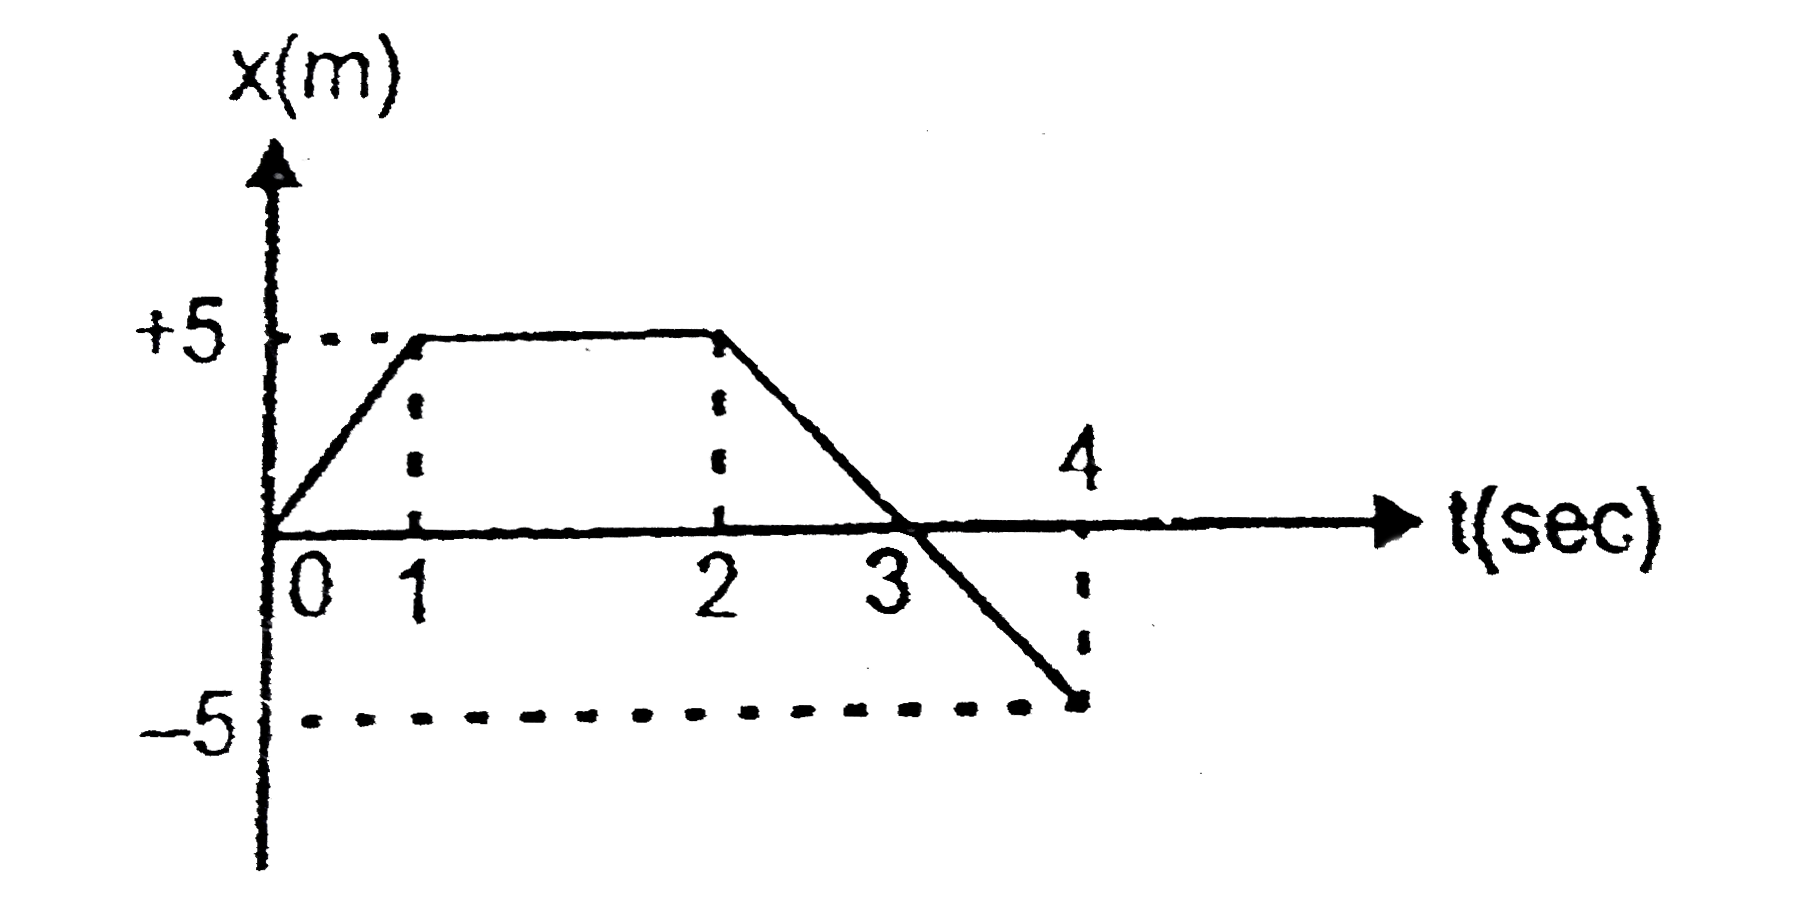
View SolutionPosition-time graph for a particle moving along x− direction is as shown in the figure. Average speed of the particle from t=0 to t=4 is :
View Solution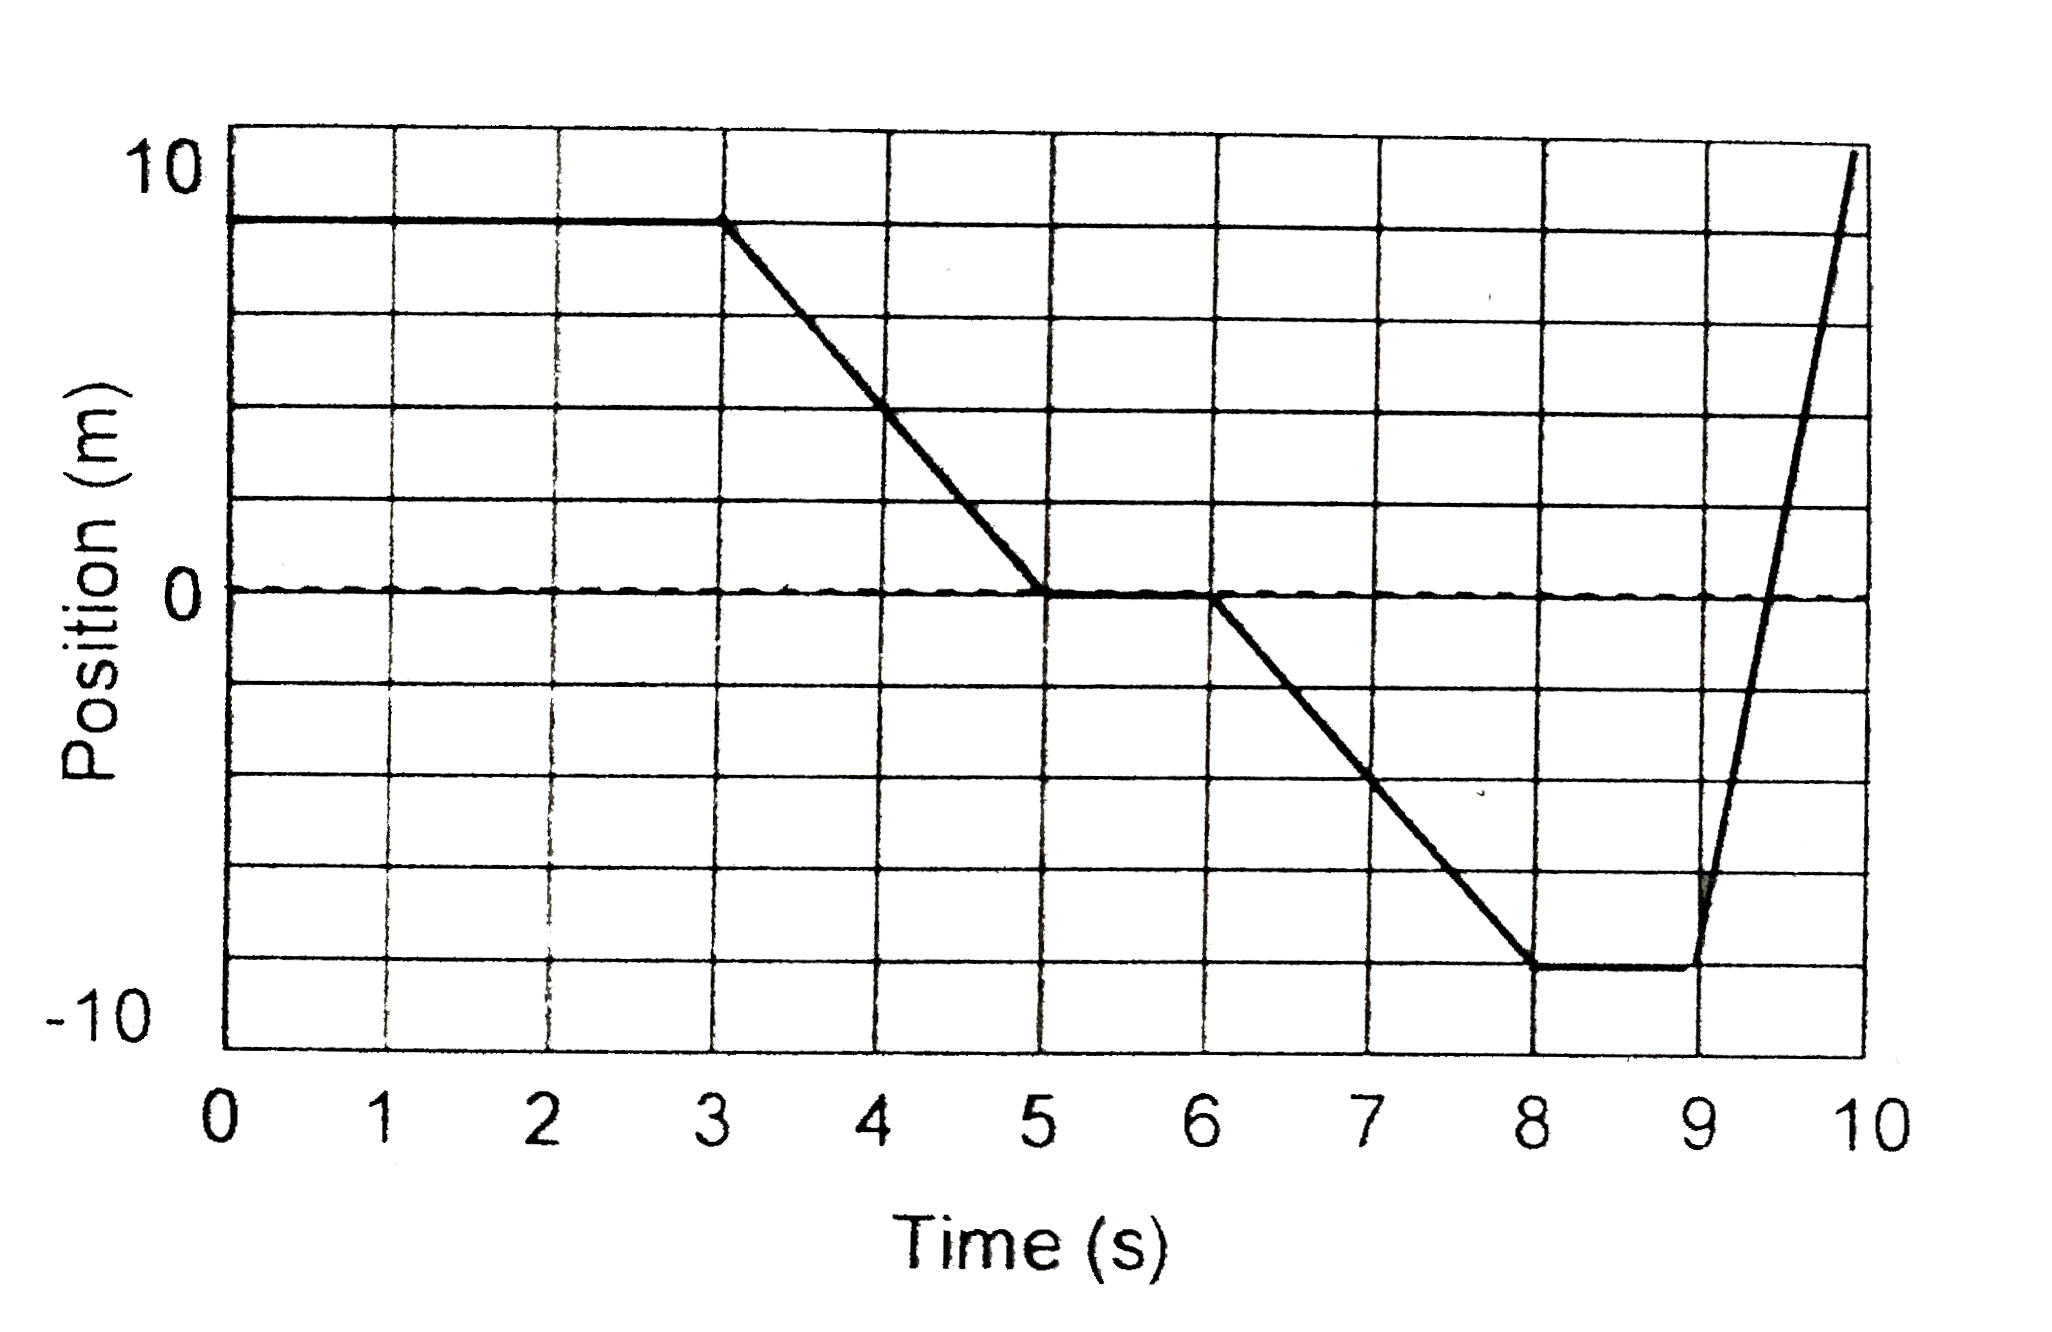
The position versus time graph of a particle moving along a straight line is shown. What is the total distance travelled by the particle from t=0s to t=10s?
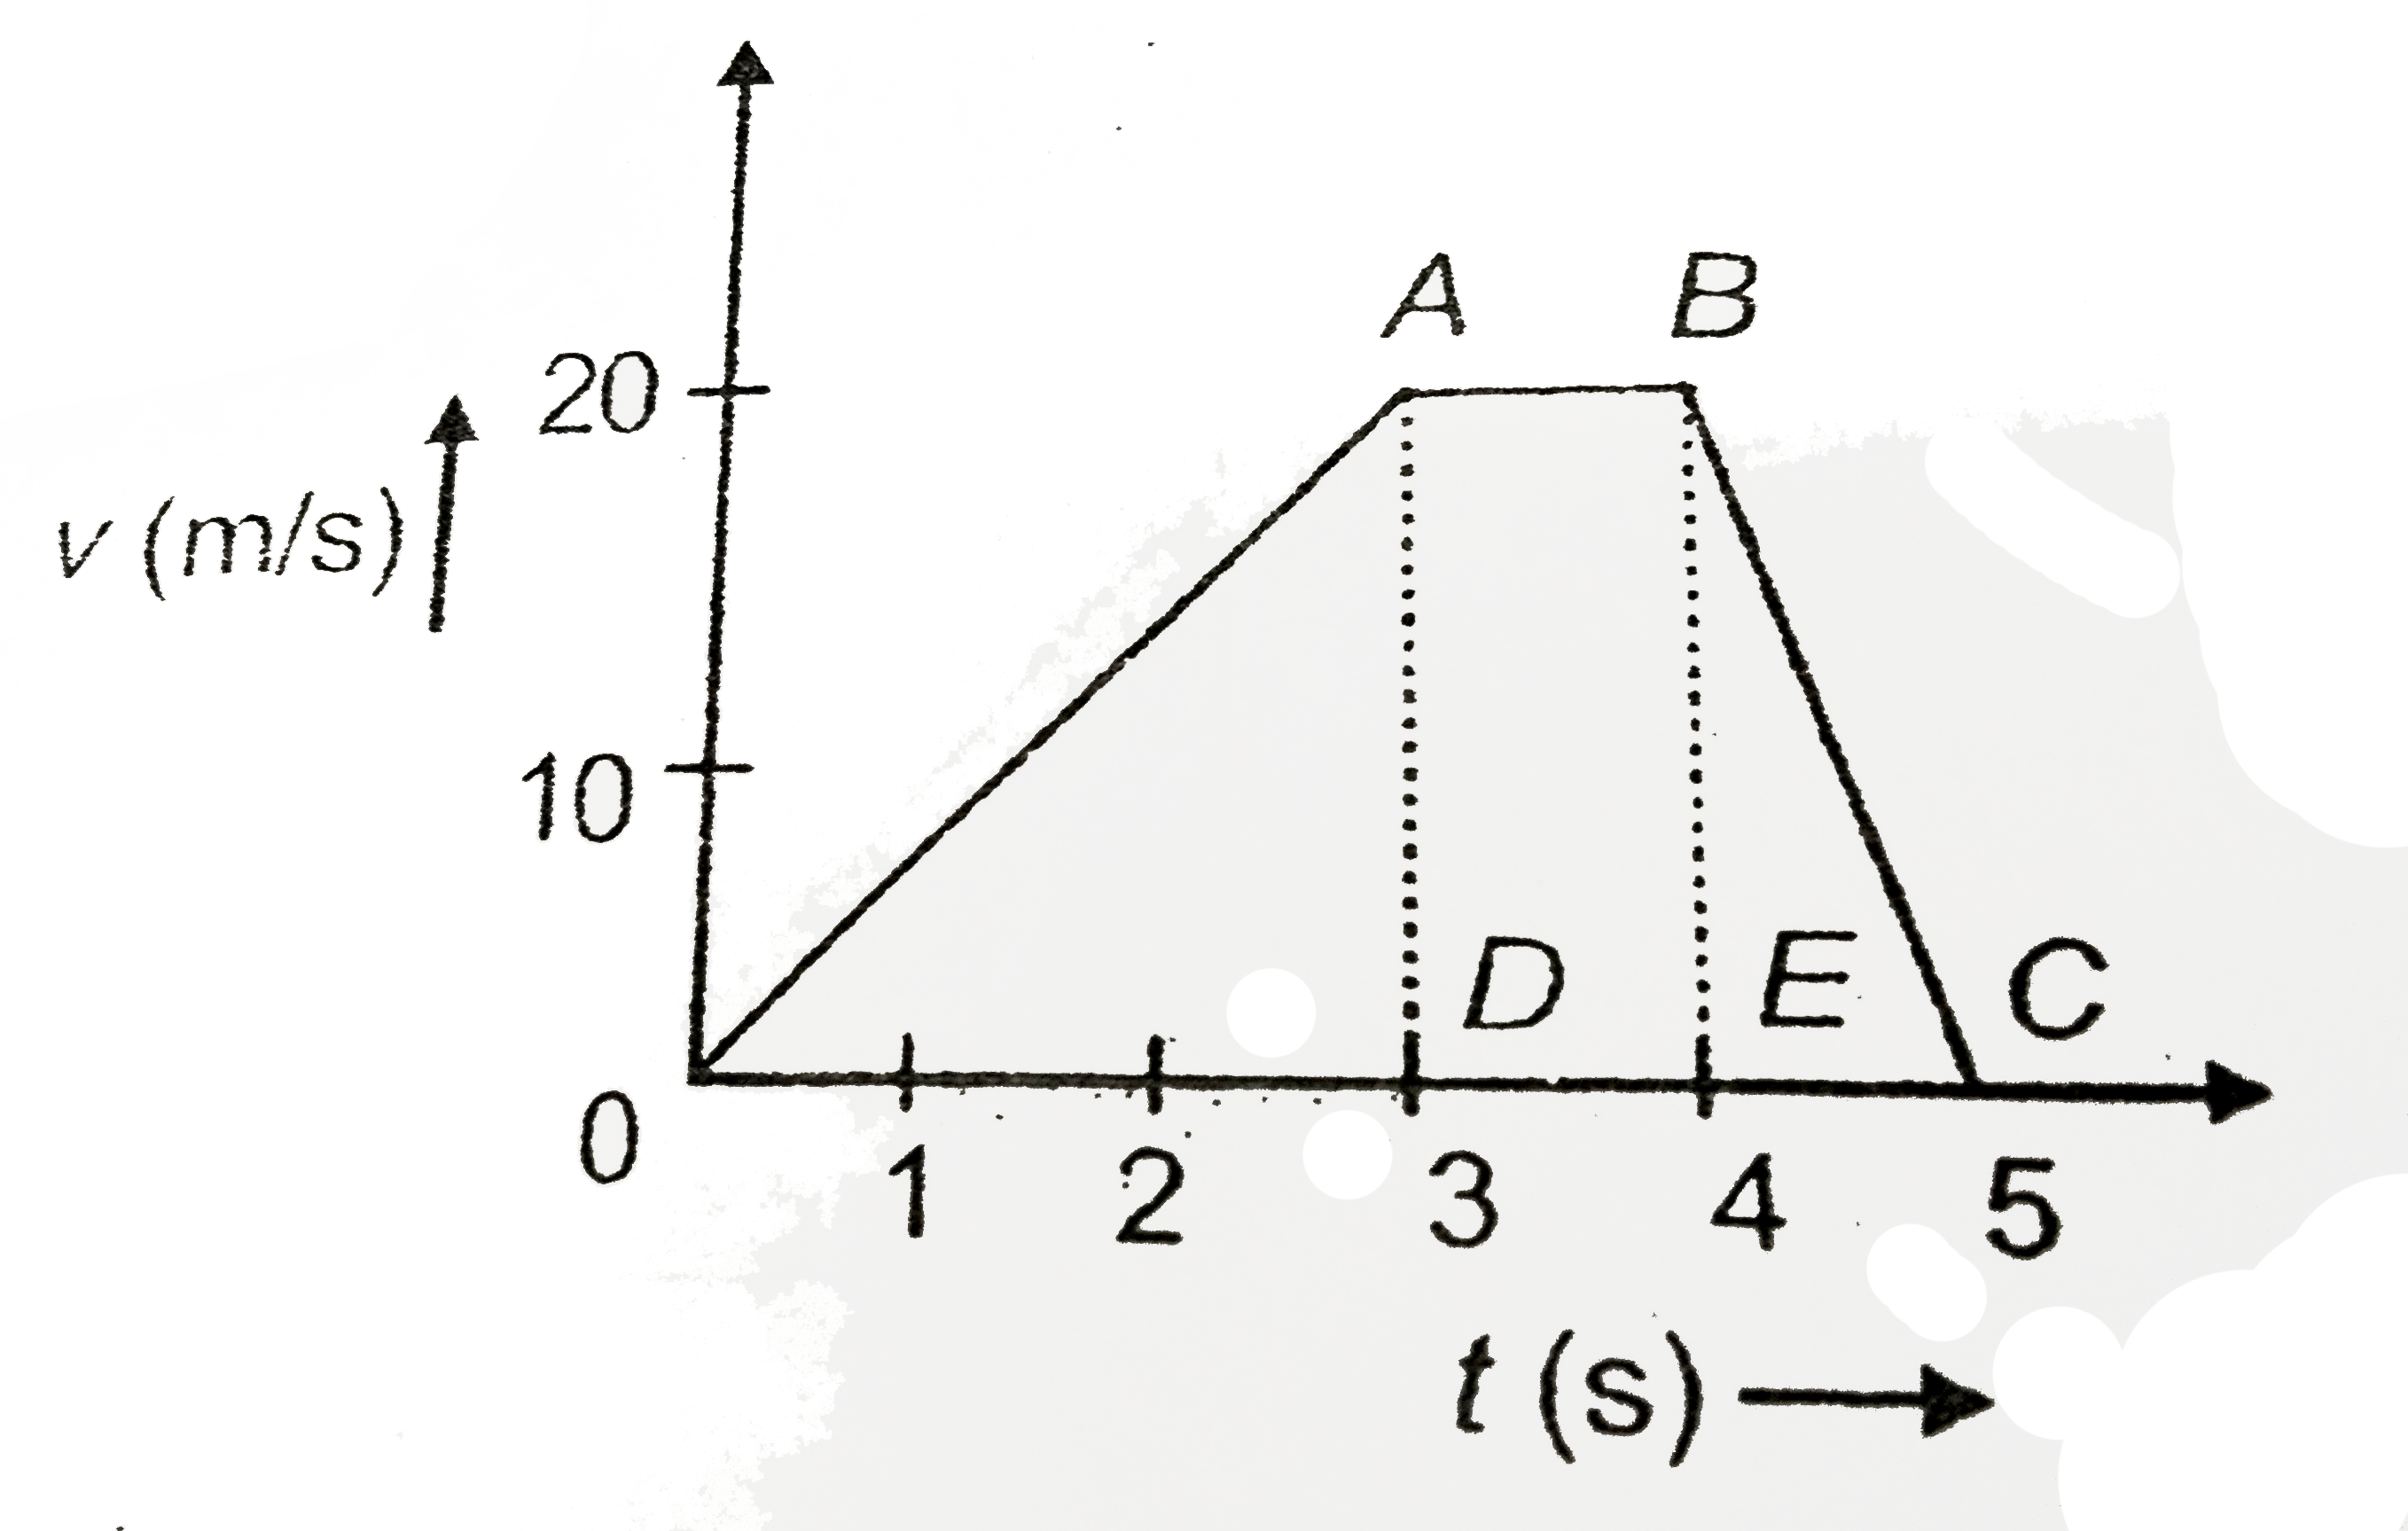
View SolutionThe variation of velocity of a particle moving along a straight line is as shown in the figure given below. The distance travelled by the particle in 5 s is
View SolutionThe position - time graph for a particle moving along a straight line is shown in figure. The total distance travelled by it in time t = 0 to t = 10 s is
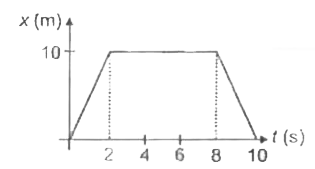
View Solution
